




Get Indexology® Blog updates via email.

In This List

S&P DJI's Global Islamic Benchmarks Outperformed Conventional Peers in Q3 2026

A Dual-Quality Lens for U.S. Small-Cap Dividend Growth: The S&P SmallCap 600 Dividend Aristocrats

Introducing the S&P/BMV IPC Futures Indices: A Futures-Based View of the Mexican Equity Market

Poll Position: Performance of the S&P MidCap 400 around Mid-Term Elections

The Case for Indexing Cryptocurrencies

S&P DJI's Global Islamic Benchmarks Outperformed Conventional Peers in Q3 2026

Contributor Image
Sue Lee

APAC Head of Index Investment Strategy

S&P Dow Jones Indices

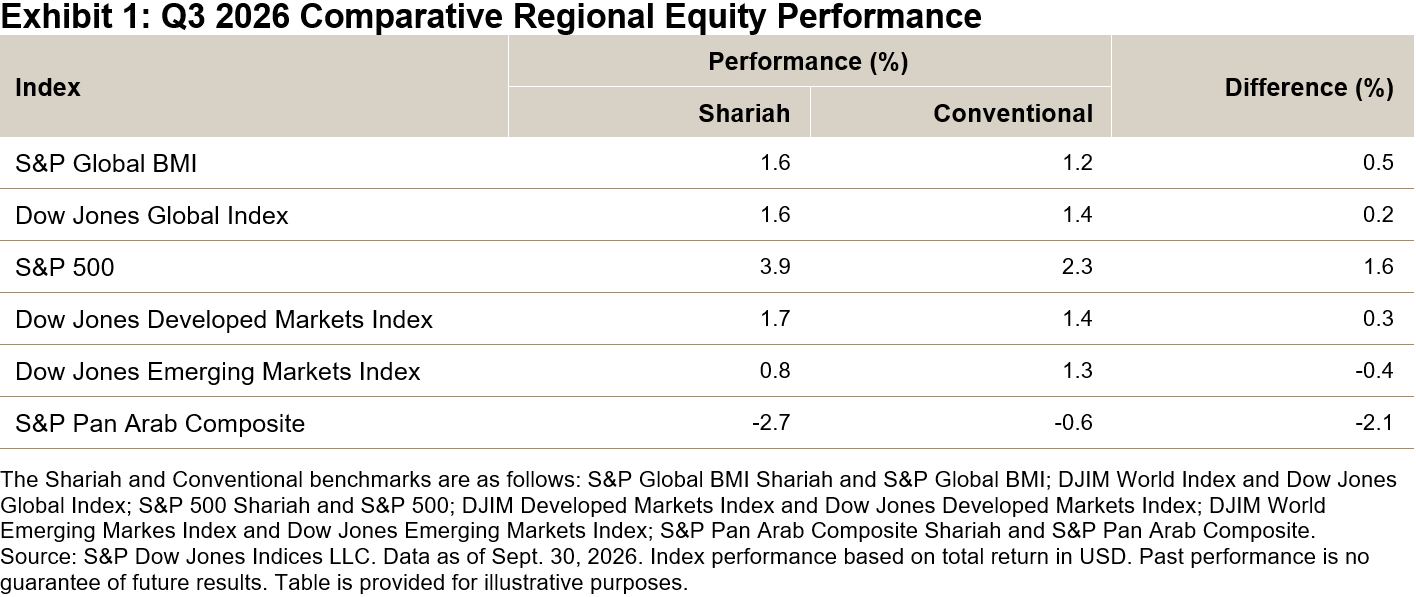
Global equities posted modest gains in the third quarter of 2026, supported by resilient corporate earnings despite persistent geopolitical uncertainty and growing concerns over the sustainability of the AI-driven market rally. Conventional benchmarks advanced across global, U.S. and developed markets, while emerging markets also ended the quarter higher. MENA equities declined amid ongoing geopolitical tensions (see Exhibit 1).

Shariah-compliant equities outperformed conventional benchmarks in most major markets. The S&P Global BMI Shariah rose 1.6%, outperforming the S&P Global BMI by 0.5 percentage points, while the Dow Jones Islamic Market World Index gained 1.6%, outperforming the Dow Jones Global Index by 0.2 percentage points. The S&P 500® Shariah demonstrated the strongest relative performance among the indices shown, rising 3.9% and outperforming the S&P 500 by 1.6 percentage points. However, Shariah benchmarks underperformed their conventional counterparts in emerging markets and the MENA region (see Exhibit 1). See the Q3 2026 S&P Shariah and Dow Jones Islamic Market Indices Scorecard for more performance details.
Drivers of Shariah Index Performance in Q3 2026

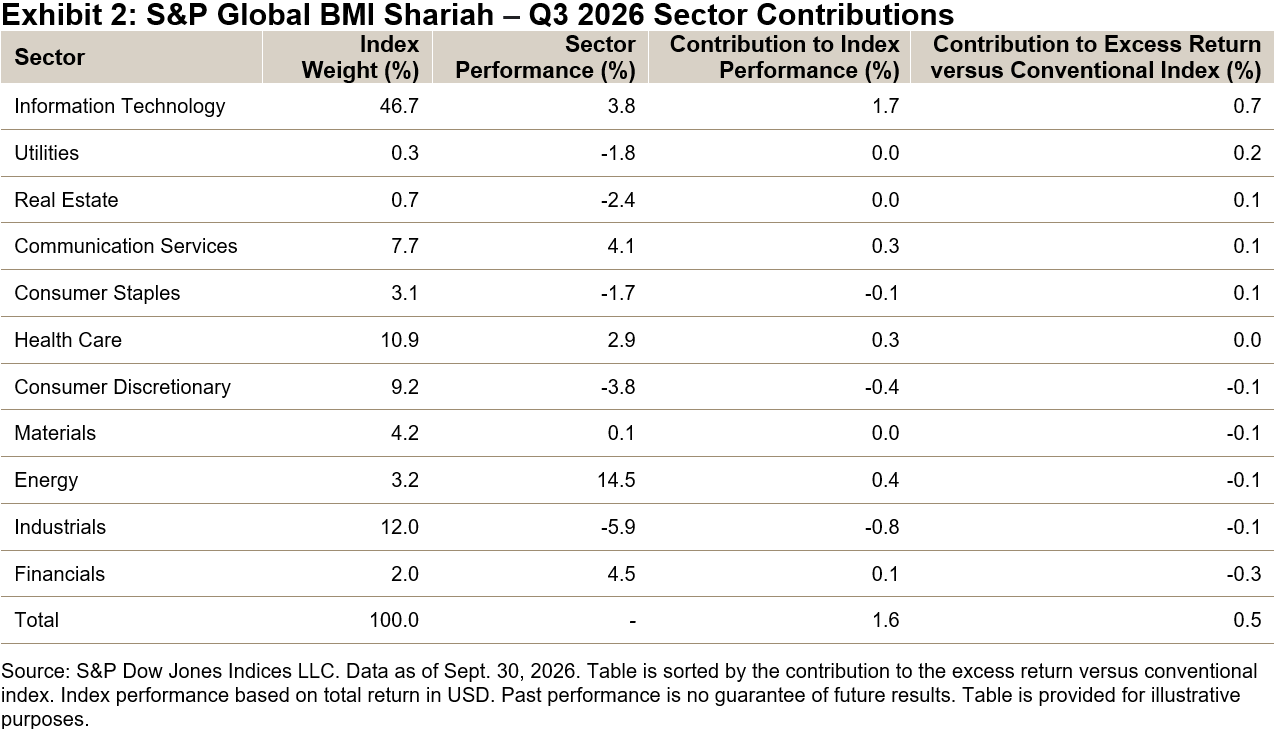
Sector positioning was the main driver of relative performance (see Exhibit 2). Information Technology, the largest sector in the S&P Global BMI Shariah at 46.7%, gained 3.8% and contributed 0.7 percentage points to excess return versus the conventional benchmark. Utilities, the smallest sector in the S&P Global BMI Shariah at 0.3%, declined 1.8% but contributed 0.2 percentage points to excess return, due to stronger performance of Shariah-compliant companies versus non-Shariah-compliant ones within the sector. Conversely, the index’s limited weight in Financials detracted 0.3 percentage points from excess return.
Global Sukuk Declined in Q3 2026

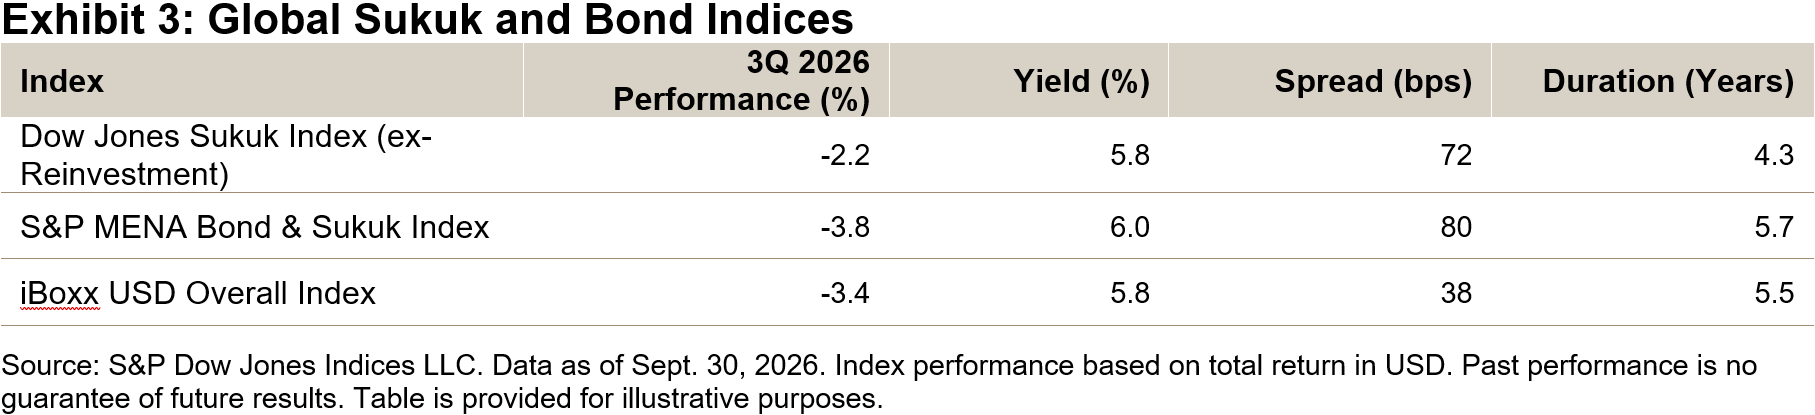
Global fixed income markets declined in the third quarter as rising yields associated with the repricing of inflation and growth expectations weighed on bond and sukuk performance. The Dow Jones Sukuk Index (ex-Reinvestment) fell 2.2%, compared with a loss of 3.4% for the iBoxx USD Overall. The S&P MENA Bond & Sukuk Index declined 3.8%, driven by longer duration exposure and widening spreads.

At quarter-end, the Dow Jones Sukuk Index (ex-Reinvestment) and the iBoxx USD Overall Index each yielded 5.8%, with sukuk having a wider spread (72 bps versus 37 bps) but a shorter duration (4.3 years versus 5.5 years) (see Exhibit 3).
This article was first published in IFN Volume 23 Issue 42 dated Oct. 21, 2026.

This content may be AI-assisted and is composed, reviewed, edited, and approved by S&P Global.

The posts on this blog are opinions, not advice. Please read our Disclaimers.

A Dual-Quality Lens for U.S. Small-Cap Dividend Growth: The S&P SmallCap 600 Dividend Aristocrats

Contributor Image
George Valantasis

Director, Factors and Dividends

S&P Dow Jones Indices

In April 2026, S&P Dow Jones Indices launched the S&P SmallCap 600® Dividend Aristocrats®, completing the U.S. core series of S&P Dividend Aristocrats Indices. With this addition, market participants can now measure consistent dividend growers across the large-, mid- and small-cap segments of the U.S. equity market.

The launch extends the S&P Dividend Aristocrats methodology to a segment in which consistent, long-term dividend growth is particularly rare—and potentially meaningful. This blog introduces the index and examines its methodology, performance and key characteristics.

Methodology

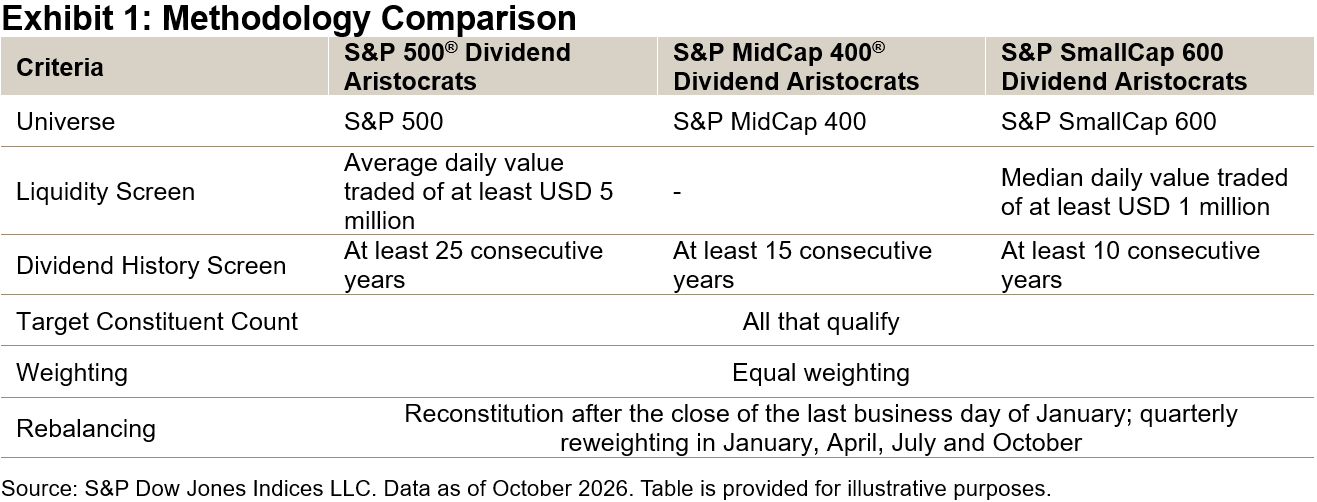
The S&P SmallCap 600 Dividend Aristocrats stands out within the small-cap space through its dual layers of quality focus. First, its eligible universe is the S&P SmallCap 600, which distinguishes itself from other benchmarks1 by requiring constituents to demonstrate profitability for inclusion. From this universe, companies must meet an additional stringent criterion: a track record of at least 10 consecutive years of dividend increases. All companies that satisfy the eligibility requirements are selected and equally weighted.2

Constituent Overview

As of the most recent index reconstitution on Jan. 31, 2026, 79 companies qualified for inclusion in the S&P SmallCap 600 Dividend Aristocrats. Of note, because the index draws constituents from a distinct, market-capitalization-based universe, it has no constituent overlap with the S&P 500 Dividend Aristocrats or the S&P MidCap 400 Dividend Aristocrats.

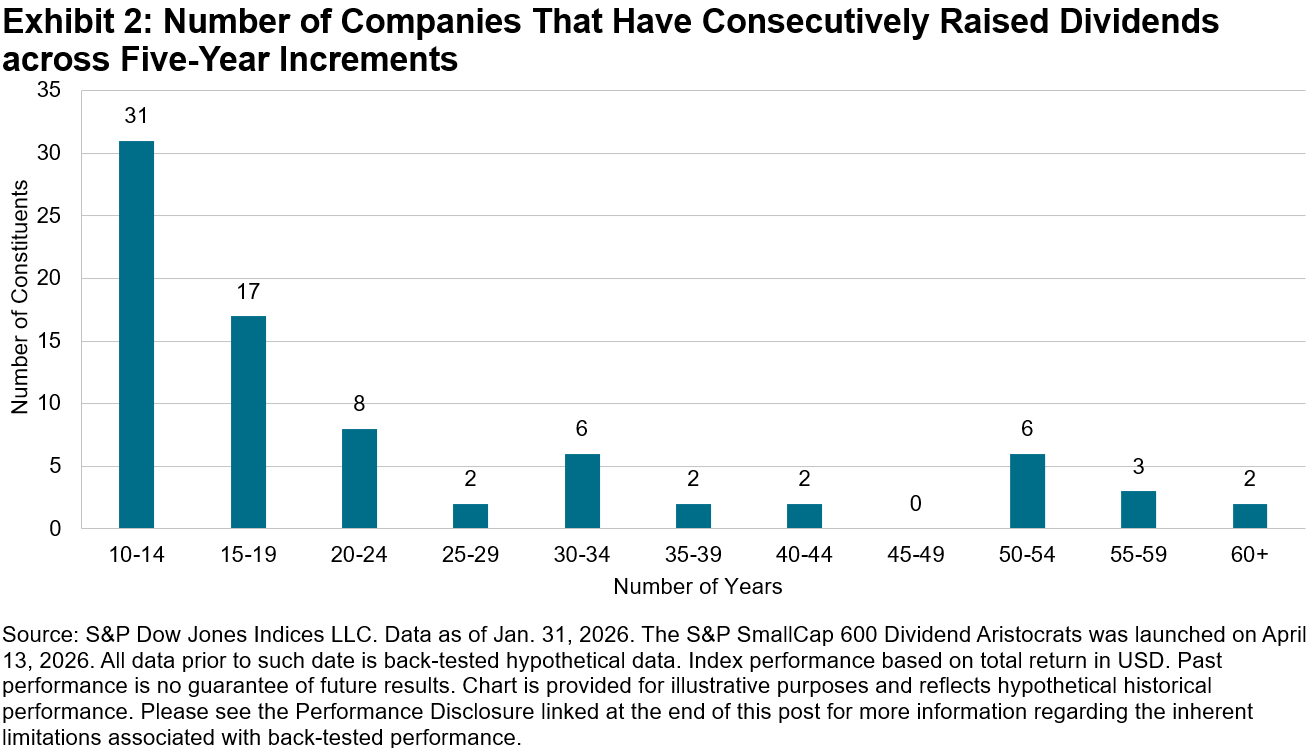
Exhibit 2 summarizes the number of constituents by consecutive years of dividend increases, grouped into five-year increments. More than 60% of the 79 constituents have increased their dividends for at least 15 consecutive years, while approximately 39% have maintained dividend growth streaks of more than 20 years.

Long-Term Outperformance with Lower Volatility

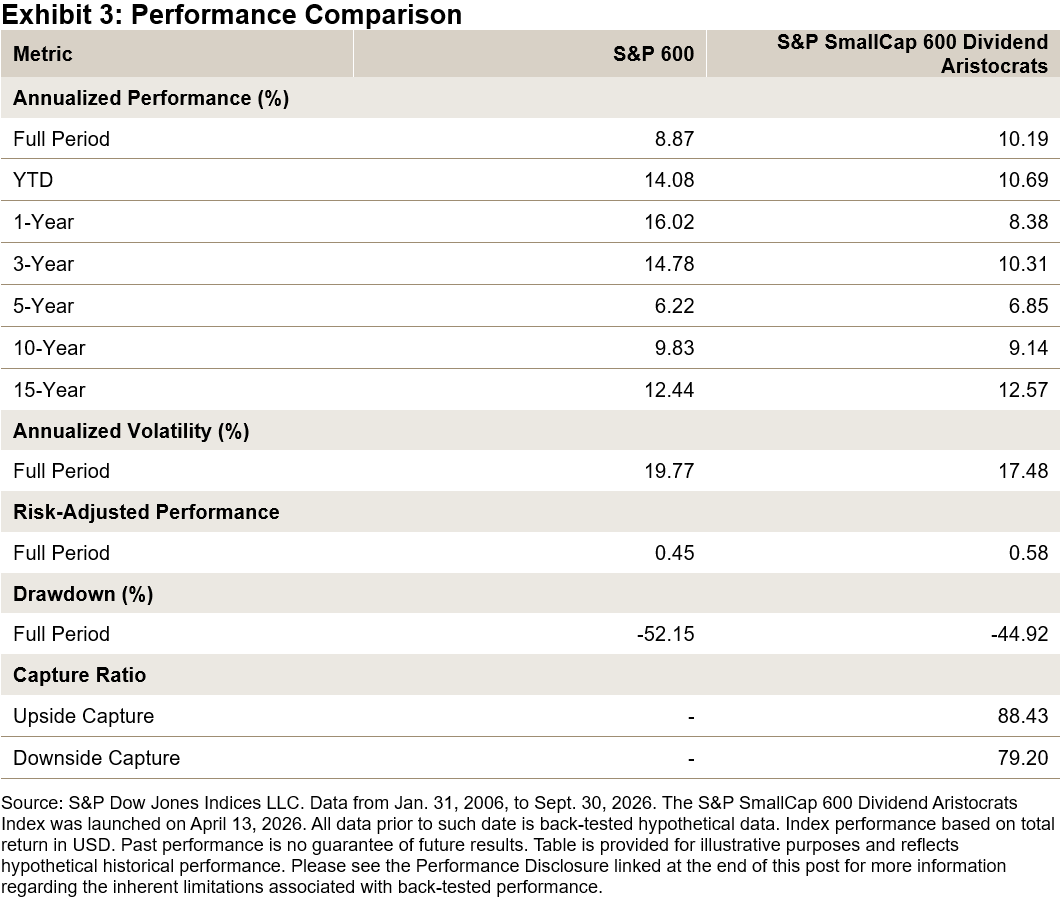
The S&P SmallCap 600 Dividend Aristocrats has shown long-term outperformance and defensive characteristics over the back-tested period observed. Over the full period, the index outperformed the S&P 600® by approximately 132 bps annualized, gaining 10.19% versus 8.87%, respectively (see Exhibit 3). It also exhibited defensive qualities consistent with the broader S&P Dividend Aristocrats Index Series, including lower volatility, a lower maximum drawdown and lower downside capture over the same period.

Higher Quality through Higher Profitability

The S&P Dividend Aristocrats Indices are often associated with quality because of their simple yet stringent dividend growth screens. A company’s ability to increase dividends consistently over the long term and across a range of market and macroeconomic environments may indicate financial strength, disciplined capital allocation and resilient business models.

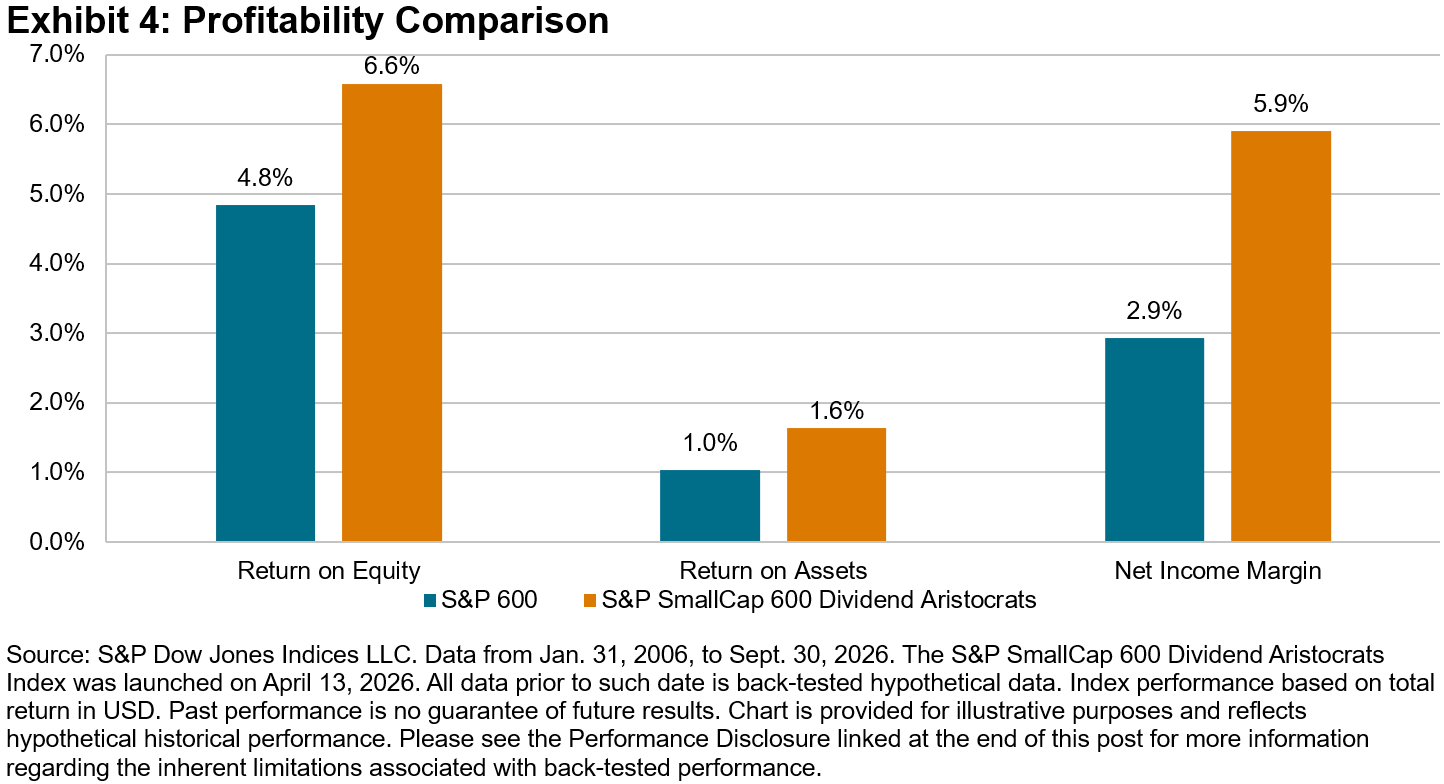
Constituents of the S&P SmallCap 600 Dividend Aristocrats exhibited a similar quality tilt, as reflected in their higher profitability. Exhibit 4 shows that the index generated materially higher returns on equity and assets than the S&P SmallCap 600, as well as a net income margin more than twice as high.

Consistently Higher Dividend Yield

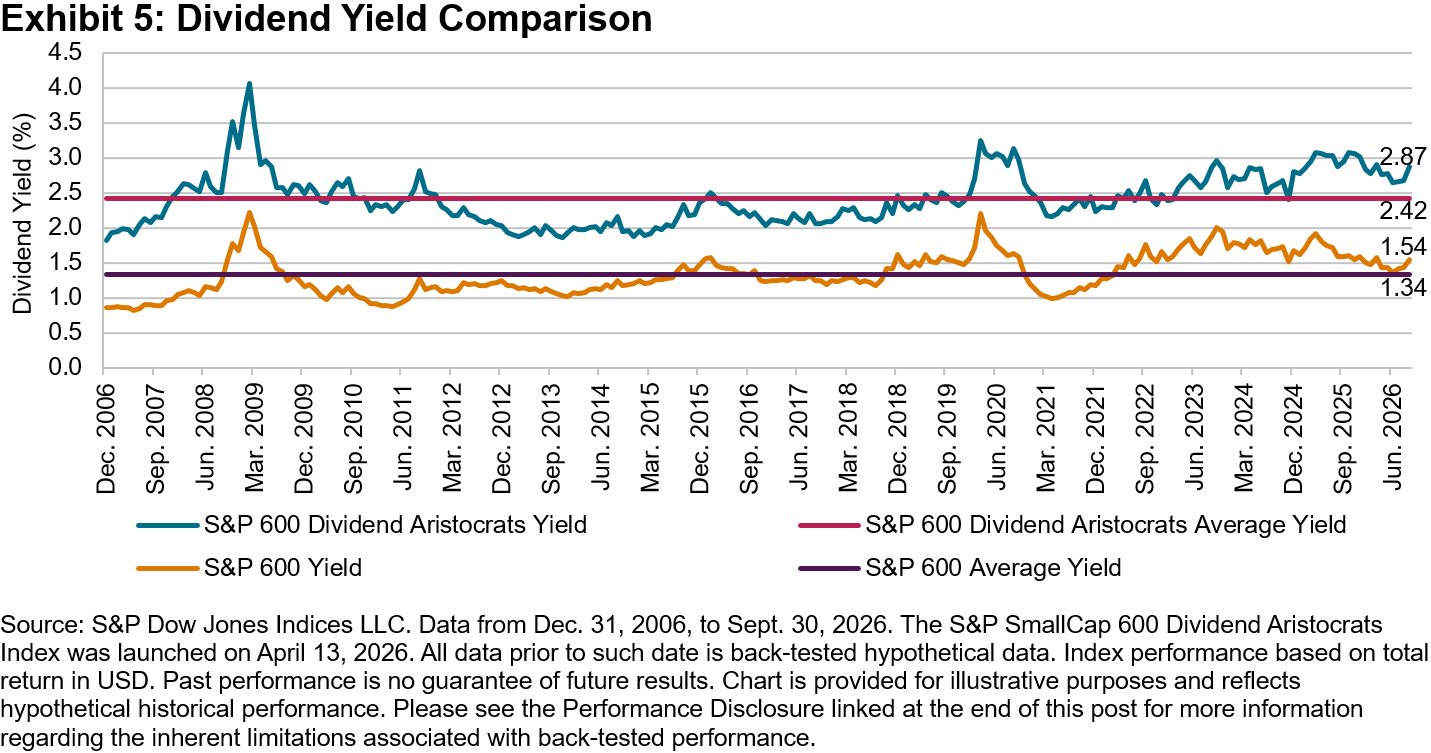
Over the full back-tested period, the average dividend yield of the S&P SmallCap 600 Dividend Aristocrats was 108 bps higher versus the S&P SmallCap 600, with an average yield of 2.42% versus 1.34%, respectively. As of Sept. 30, 2026, that difference has widened to 133 bps, with the index yielding 2.87% compared to 1.54% for its benchmark universe.

Sector Overview

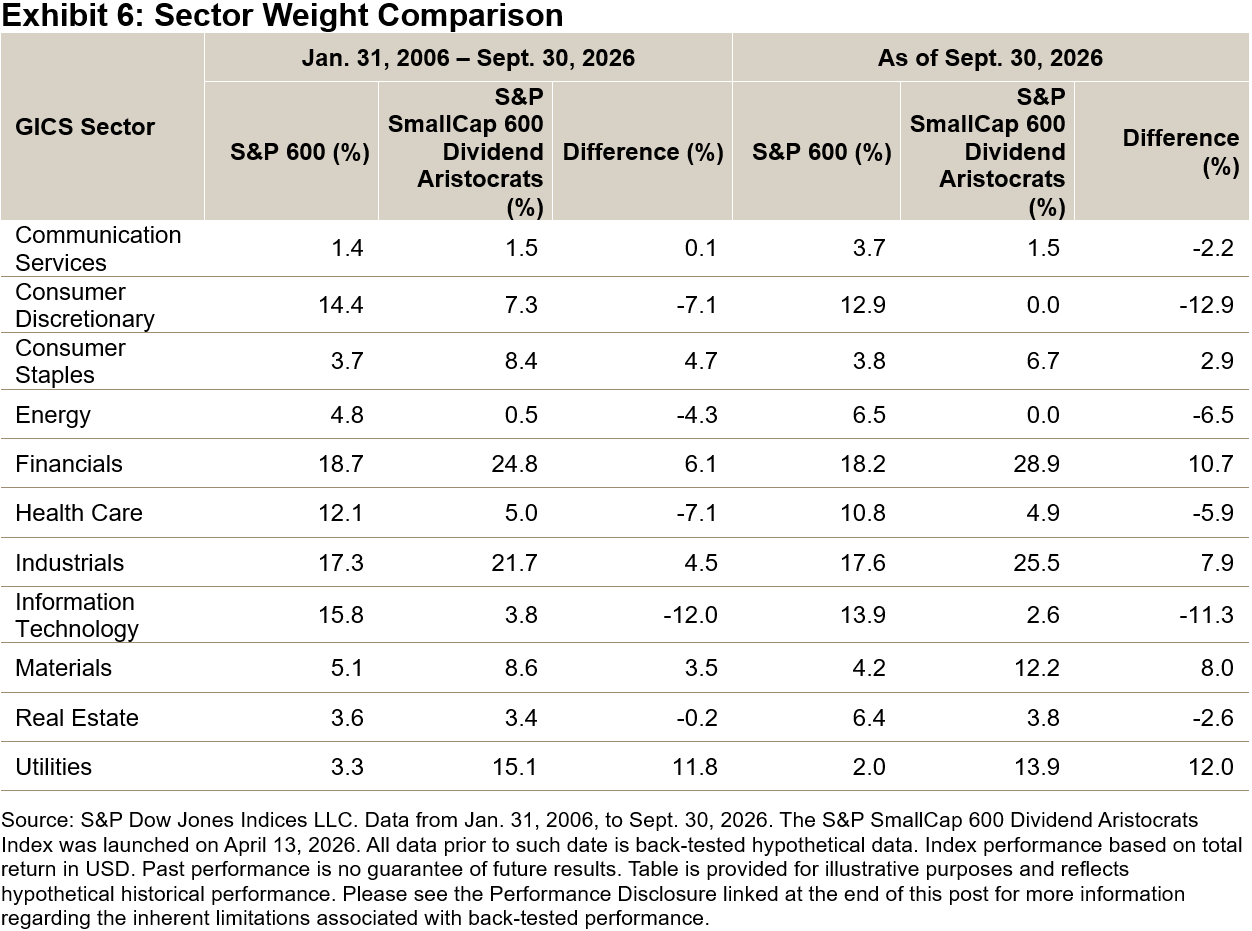
From a sector standpoint, the S&P SmallCap 600 Dividend Aristocrats tended to be underweight sectors such as Consumer Discretionary, Energy and Information Technology, while being overweight sectors such as Utilities, Financials and Consumer Staples (see Exhibit 6).

Conclusion

The launch of the S&P SmallCap 600 Dividend Aristocrats completes the S&P Dividend Aristocrats Index Series across the U.S. equity market, complementing the S&P 500 and S&P MidCap 400 versions. The index applies a dual-quality lens, combining a profitability screen within the S&P SmallCap 600 with a specific dividend growth requirement.

This focus on profitability may be particularly meaningful in the small-cap segment, which has historically lagged its mid- and large-cap counterparts on these measures. Over the long term, the index has exhibited characteristics consistent with the broader S&P Dividend Aristocrats Index Series, including higher risk-adjusted performance and defensive qualities.

1 See Preston, Hamish, Fei Wang and Sherifa Issifu, “Celebrating 30 Years of the S&P SmallCap 600,” S&P Dow Jones Indices, Oct. 31, 2024.

2 For mor information on index construction, see the S&P Dividend Aristocrats Indices Methodology.

The posts on this blog are opinions, not advice. Please read our Disclaimers.
Introducing the S&P/BMV IPC Futures Indices: A Futures-Based View of the Mexican Equity Market

Contributor Image
Eduardo Olazabal

Associate Director, Global Exchange Indices

S&P Dow Jones Indices

Introduction

The S&P/BMV IPC is Mexico’s flagship equity index, and around it sits a growing ecosystem of investable products, including futures listed on MexDer and CME.

The S&P/BMV IPC Futures Series was launched to serve that market, tracking a rolling long position in IPC futures rather than the underlying shares and published in price, excess and total return versions. It complements the S&P/BMV IPC rather than replacing it: a futures position carries a roll and earns no dividends, so the two indices measure different things by design.

Understanding the S&P/BMV IPC Futures Return Types: Why Performance Can Differ

A futures contract is not the same as owning the shares it tracks. Contracts expire, so maintaining continuity means rolling from on contract into the next, which carries a cost or a benefit. Futures also require only a margin deposit rather than the full amount, so investors decide how much cash to hold alongside the position.

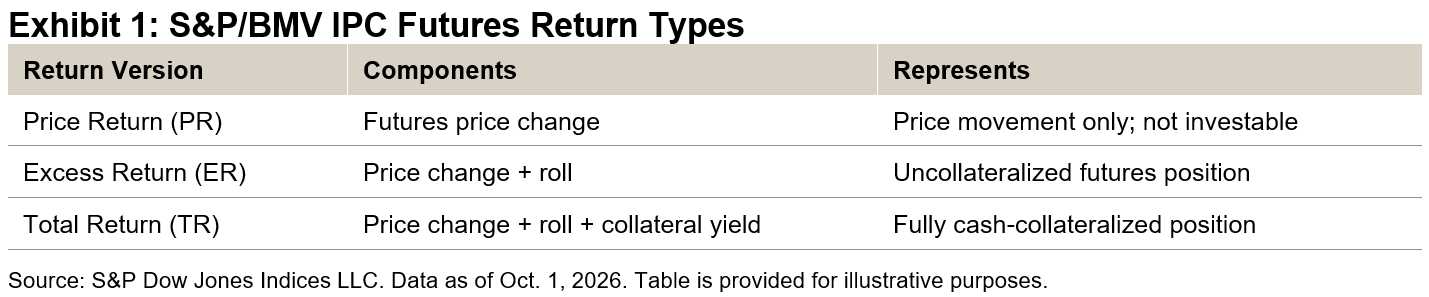
These two elements—the roll and future prices—are part of the differences between the return types. The spot version reflects the change in the futures price alone. The excess return version adds the roll. The total return version adds to the interest earned on cash held as collateral. Each return type measures something different, and each suits a different purpose.

How Does the S&P/BMV Futures Series Differ from the S&P/BMV IPC?

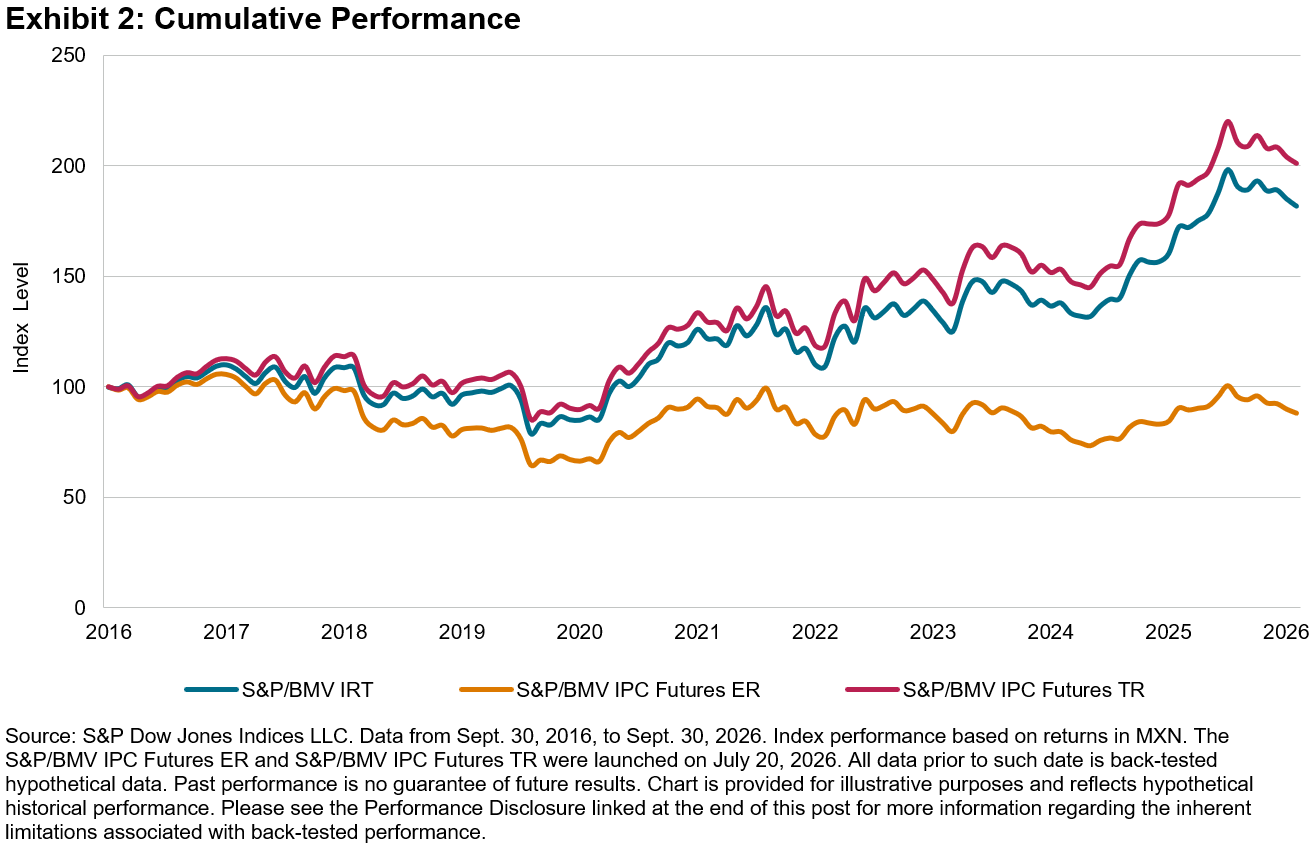
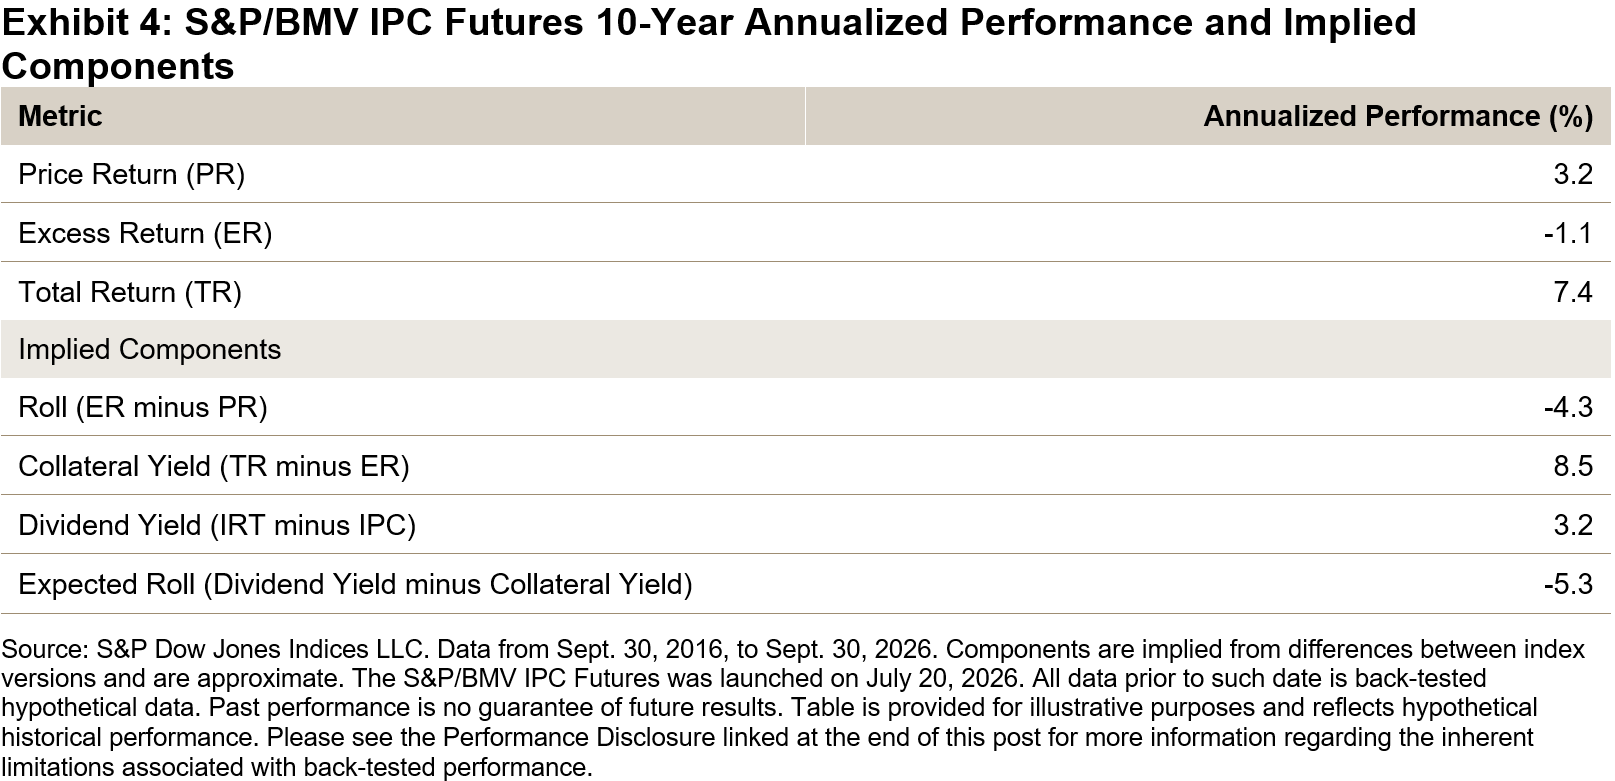
The S&P/BMV IPC Futures measures the S&P/BMV IPC as held through contracts rather than shares. The S&P/BMV IPC has tracked the S&P/BMV IPC Futures PR closely—3.1% versus 3.2% annualized over ten years—confirming the contracts priced the index faithfully. However, this version is not investable, since maintaining a futures position requires periodic rolling. The S&P/BMV IPC Futures ER and S&P/BMV IPC Futures TR account for that cost and for the treatment of cash held against the position.

Each time an expiring contract is replaced, the next one is priced to reflect the cost of financing the exposure less the dividends foregone. The S&P/BMV IPC Futures ER reflects this: it sits 4.3% a year below the spot version, which is the cost of the roll. The S&P/BMV IPC Futures TR then adds the interest earned on cash held as collateral, 8.5% a year, lifting it above the S&P/BMV IRT.

The size of the roll is worth noting. Futures are priced to reflect the cost of financing the exposure less the dividends foregone, so with a collateral yield of 8.5% and a dividend yield of 3.2%—both implied by the gaps in Exhibit 3—the roll would be expected to cost around 5.3% a year. It cost 4.3%.

Leveraged and Inverse Versions Are Also Available

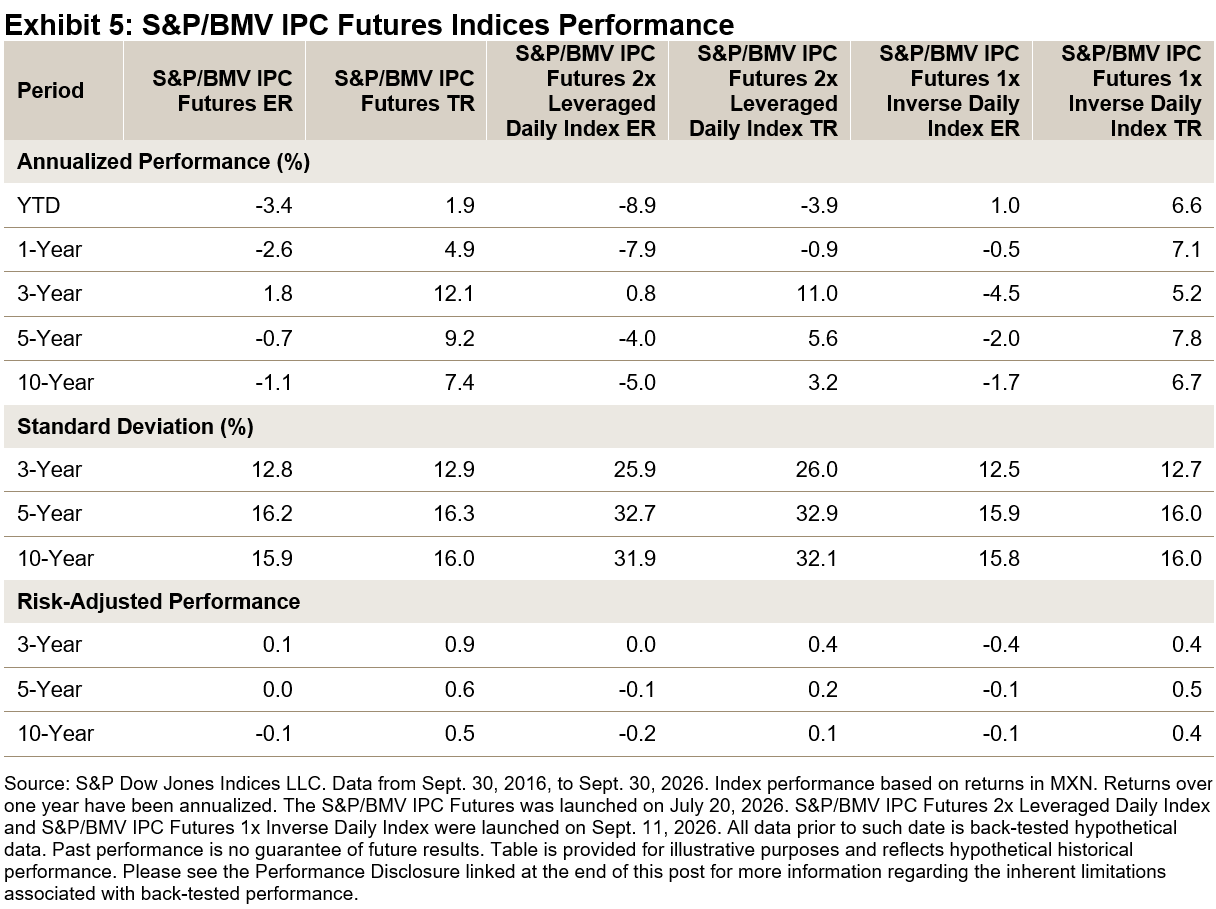
The series extends to the S&P/BMV IPC Futures 2x Leveraged Daily Index and S&P/BMV IPC Futures 1x Inverse Daily Index, built from the same contracts and reset daily.

Because the multiple is reset each day, returns compound from one day to the next. Over longer periods, the result can differ substantially from the stated multiple, and the difference grows as volatility rises. Leveraged and inverse indices are therefore typically used for short-term hedging and directional positioning rather than long-term holding.

The 10-year figures show this. Twice the 1x ER of -1.1% would be -2.2%; however, the S&P/BMV IPC Futures 2x Leveraged Daily Index ER fell 5.0% annualized, with volatility roughly doubling from 15.9% to 31.9%. For the S&P/BMV IPC Futures 1x Inverse Daily Index, a -1x multiple would imply +1.1%, while the S&P/BMV IPC Futures 1x Inverse Daily Index ER fell 1.7%.

The collateral yield does not scale either—8.5% annualized for the 1x version and 8.2% for the 2x—because it is earned on the capital invested rather than the exposure taken.

The roll also works in the opposite direction for a short position, which receives it rather than paying it. That cushioned the inverse ER over 10 years in which prices rose, and left its TR of 6.7% close to the 7.4% of the long TR.

Conclusion

The S&P/BMV IPC Futures Indices expand the toolkit for analyzing Mexican equities by recognizing that, when exposure is held through contracts, measured performance depends on the roll and the funding assumption applied. By viewing the futures versions alongside the S&P/BMV IPC and S&P/BMV IRT, market participants can separate price movement from the roll and the collateral yield.

The S&P/BMV IPC Futures 2x Leveraged Daily Index and S&P/BMV IPC Futures 1x Inverse Daily Index extend the same framework to daily-reset exposures, where compounding means longer-period performance can differ substantially from the stated multiple.

The posts on this blog are opinions, not advice. Please read our Disclaimers.
Poll Position: Performance of the S&P MidCap 400 around Mid-Term Elections

Contributor Image
Florence Chapman

Senior Analyst, U.S. Equities

S&P Dow Jones Indices

The S&P 500®, the S&P MidCap 400® and the S&P SmallCap 600® measure the performance of the large-, mid- and small-cap segments of the U.S. equity market, respectively. When considered together, they provide broad coverage of the U.S. equity market; however, each index represents a distinct segment with a unique constituent profile, sector composition and risk/performance characteristics.

Large caps typically offer scale and global reach, small caps can be associated with earlier-stage company growth and mid caps tend to occupy the space in between. Often overlooked, mid-cap companies can be established enough to offer operating scale and access to capital, yet still early enough in development for growth to matter.1

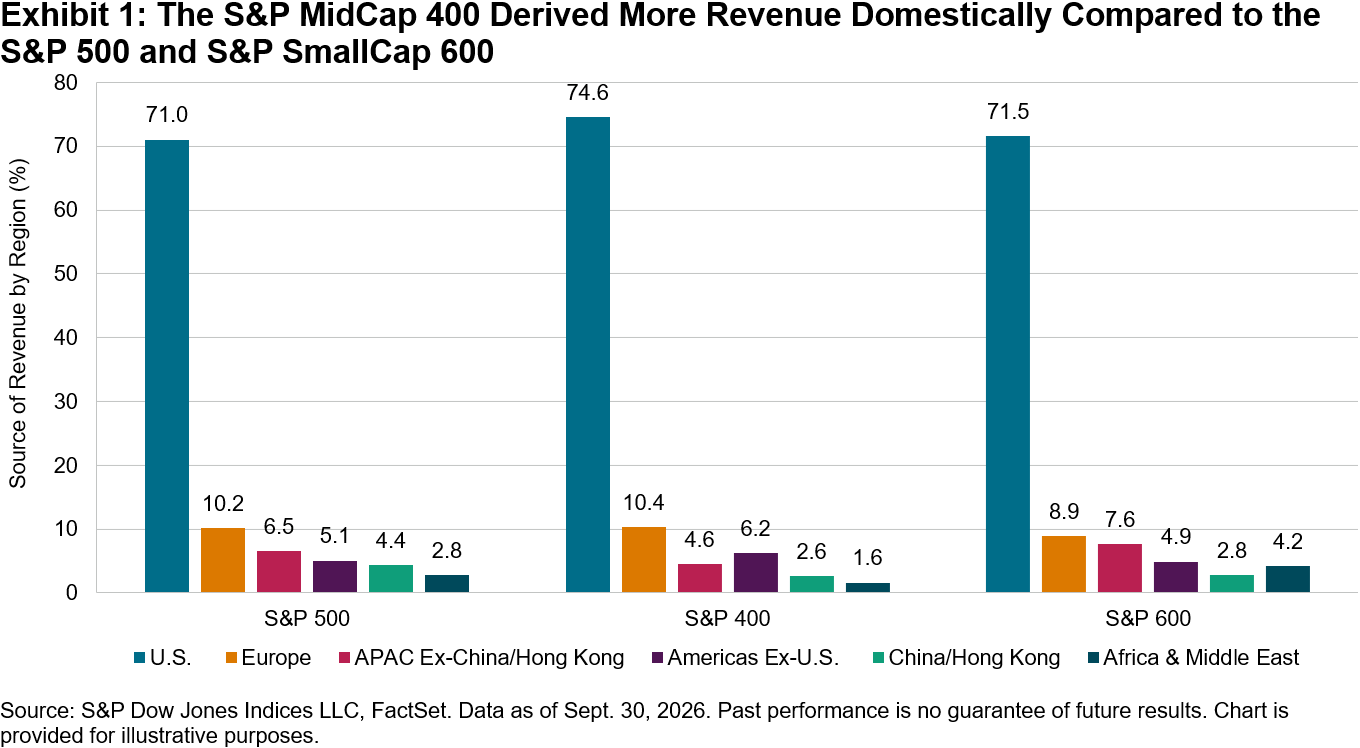
One example of how differing constituent profiles can translate into distinct characteristics is geographic revenue. Exhibit 1 shows the revenue breakdown by geography for the S&P 500, S&P 400® and S&P 600® as of the end of September 2026. On a sales-weighted basis, the S&P 400 had the highest domestic revenue exposure of the three indices, with 74.6% sourced from the U.S., compared with 71.0% and 71.5% for the S&P 500 and S&P 600, respectively. This higher domestic revenue exposure reflects, in part, the S&P MidCap 400’s sector composition, with relatively greater weights in more domestically oriented sectors such as Industrials and Real Estate.2

Differences in index characteristics can be informative when market attention shifts between global and domestic drivers. One historical lens through which to examine this dynamic may be the U.S. mid-term elections, which are held every four years, midway through a presidential term.3 Mid-term elections can coincide with a shift from pre-election uncertainty toward changing expectations for domestic policy and the U.S. economic outlook.

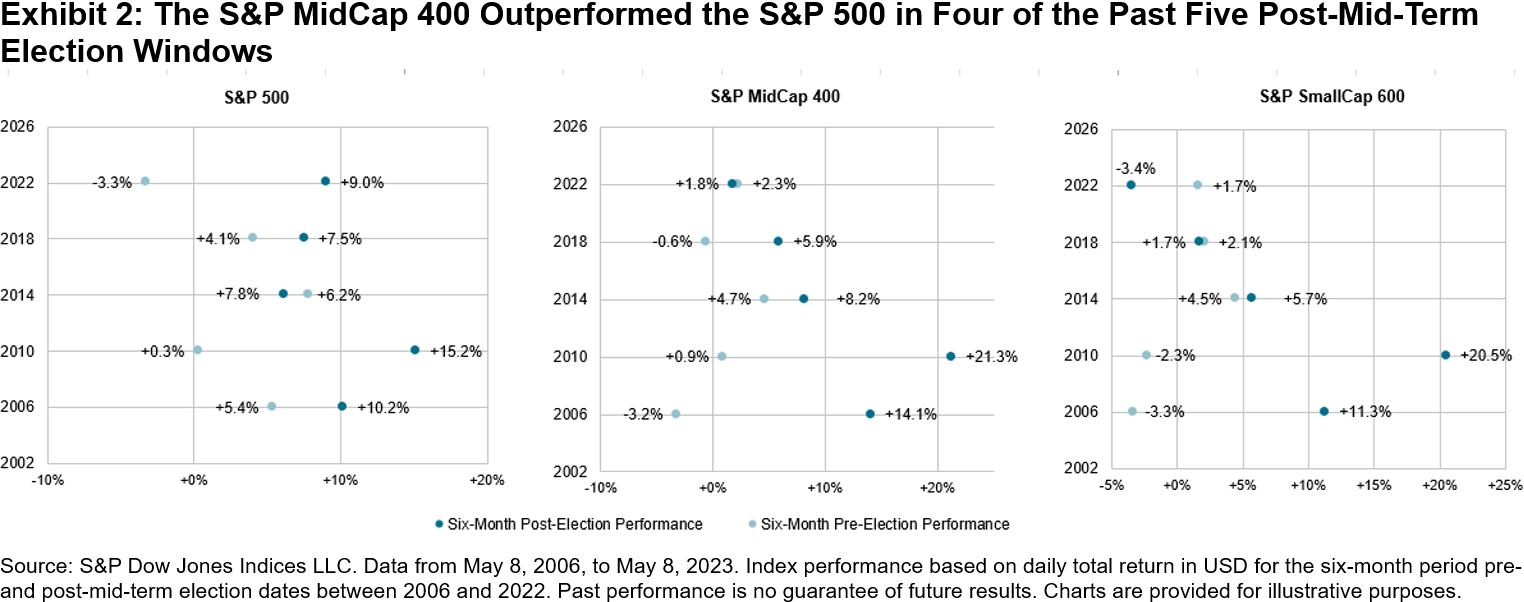
Exhibit 2 compares the performance of the S&P MidCap 400 with that of the S&P 500 and S&P SmallCap 600 over the six-month period before and after each of the five U.S. mid-term elections since 2006.

The S&P 400 outperformed the S&P 500 in four of the past five six-month periods following the mid-term elections. The mid-cap benchmark also outperformed the S&P SmallCap 600 in three of these periods. Across the five election cycles examined, the post-election performance ranged from 1.8% to 21.3% for the S&P 400, compared with -3.4% to 20.5% for the S&P 600 and 6.2% to 15.2% for the S&P 500. While the magnitude of performance varied from one cycle to the next, mid caps were strong performers in most of the post-election windows examined. While the drivers of performance varied across market cycles, these results highlight how differences in constituent profile, sector composition and economic sensitivity can contribute to distinct outcomes across market-cap segments.

More notably, perhaps, Exhibit 2 also shows the change in performance on either side of the election date. In four of the five cycles, mid caps posted stronger performance in the six months following the election than in the six months prior. The improvement ranged from 3.5% in 2014, to more than 20% in both 2006 and 2010, with 2022 representing the only exception. Although stronger post-election performance was also observed in four and three of the five cycles for the large and small caps, respectively, the increase between the pre- and post-election periods was the largest for the S&P MidCap 400.

Applying the same analysis to equivalent dates in non-election years4 showed a weaker relationship between pre- and post-period performance, suggesting that the historical post-mid-term pattern may not be explained by calendar timing alone. One possible explanation is that market participants may have historicaly reasessed the domestic outlook more positively following mid-term elections.

Conclusion

Historical index performance around mid-term elections provides one example of how the distinct characteristics of the S&P MidCap 400 have translated into different outcomes from its large- and small-cap counterparts. While these observations do not establish a persistent relationship, they illustrate how differences in constituent profile, sector composition and economic sensitivity have impacted performance across market-cap segments. More broadly, these differing characteristics can reinforce the case for looking beyond large caps when considering the breadth of U.S. equities.

1 Explore these characteristics in greater detail in the S&P MidCap 400 Brochure.

For further reading, see Bellucci, Louis and Hamish Preston, “The S&P MidCap 400: Outperformance and Potential Application,” S&P Dow Jones Indices, July 9, 2019.

2 For current detail on sector weights, see the S&P MidCap 400 webpage.

3 For a broader analysis on the relationship between election cycles and index performance, see Hyman, Lucas, “Ballots and Benchmarks: How Elections Shake Markets around the World,” S&P Dow Jones Indices, Aug. 31, 2026.

4 Analysis based on equivalent mid-term calendar dates in the following years: 2007, 2011, 2015, 2019 and 2023.

The posts on this blog are opinions, not advice. Please read our Disclaimers.
The Case for Indexing Cryptocurrencies

Contributor Image
Marco Zhang

Quantitative Analyst, Index Investment Strategy

S&P Dow Jones Indices

While indexing has been established as a core building block in traditional asset classes such as U.S. equities,1 digital assets continue to be viewed largely through the lens of individual tokens, particularly Bitcoin. Seventeen years after Bitcoin’s genesis block, the market now includes increasing institutional participation, regulated exchanges, spot ETFs and an ecosystem that extends well beyond Bitcoin. In this blog, we are taking a look into a diversified index approach for cryptocurrencies.

Why Does Indexing Work?

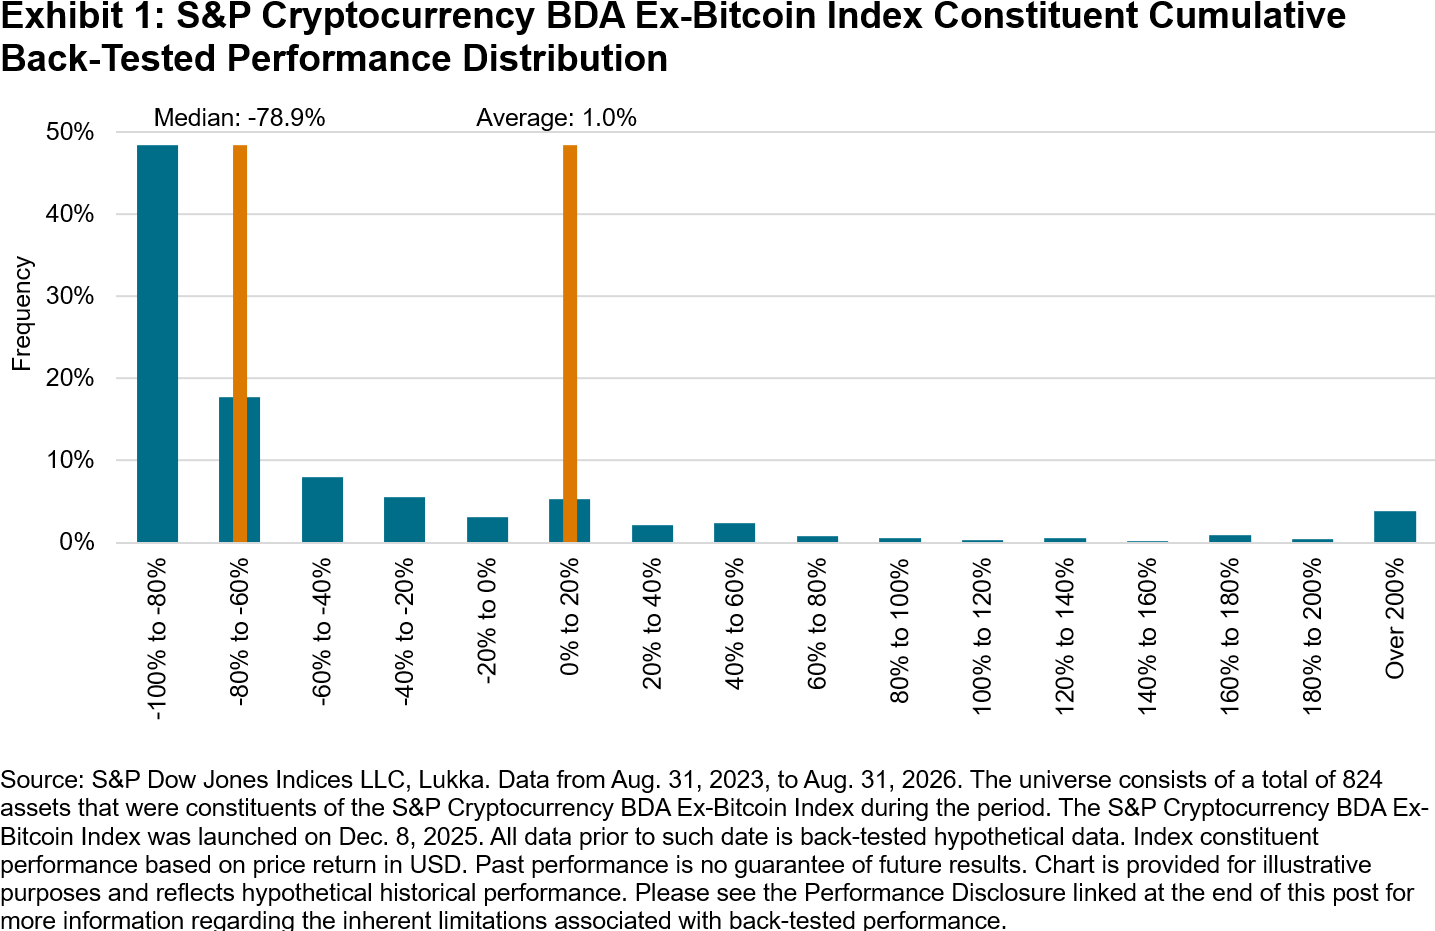
A key context for understanding indexing can be found in the performance distribution of the underlying assets. Exhibit 1 illustrates the distribution of cumulative performance for the constituents of the S&P Cryptocurrency Broad Digital Asset (BDA) Ex-Bitcoin Index over the three-year period ending Aug. 31, 2026. Outside of Bitcoin, cryptocurrencies had a median cumulative performance of -78.9%, compared with an average of 1.0%. A small number of tokens posted outsized gains of over 200%, lifting the average well above the median. Only 16% of constituents outperformed the average, while nearly half lost over 80% of their value. This positive skew in cryptocurrency performance generally held true over both the short and long term, similar to what we have observed in stock performance.2

In other words, successful coin selection depended on identifying a relatively small number of exceptional performers from a much larger universe of constituents. That is a difficult task. A diversified index approach, by contrast, aims to widen the focus beyond any single cryptocurrency and maintain representation across the opportunity set that drives market performance. Over the same period shown in Exhibit 1, the S&P Cryptocurrency BDA Ex-Bitcoin Index gained 37.1%, leaving just 10% of constituents above the index performance.

Diversification beyond Bitcoin

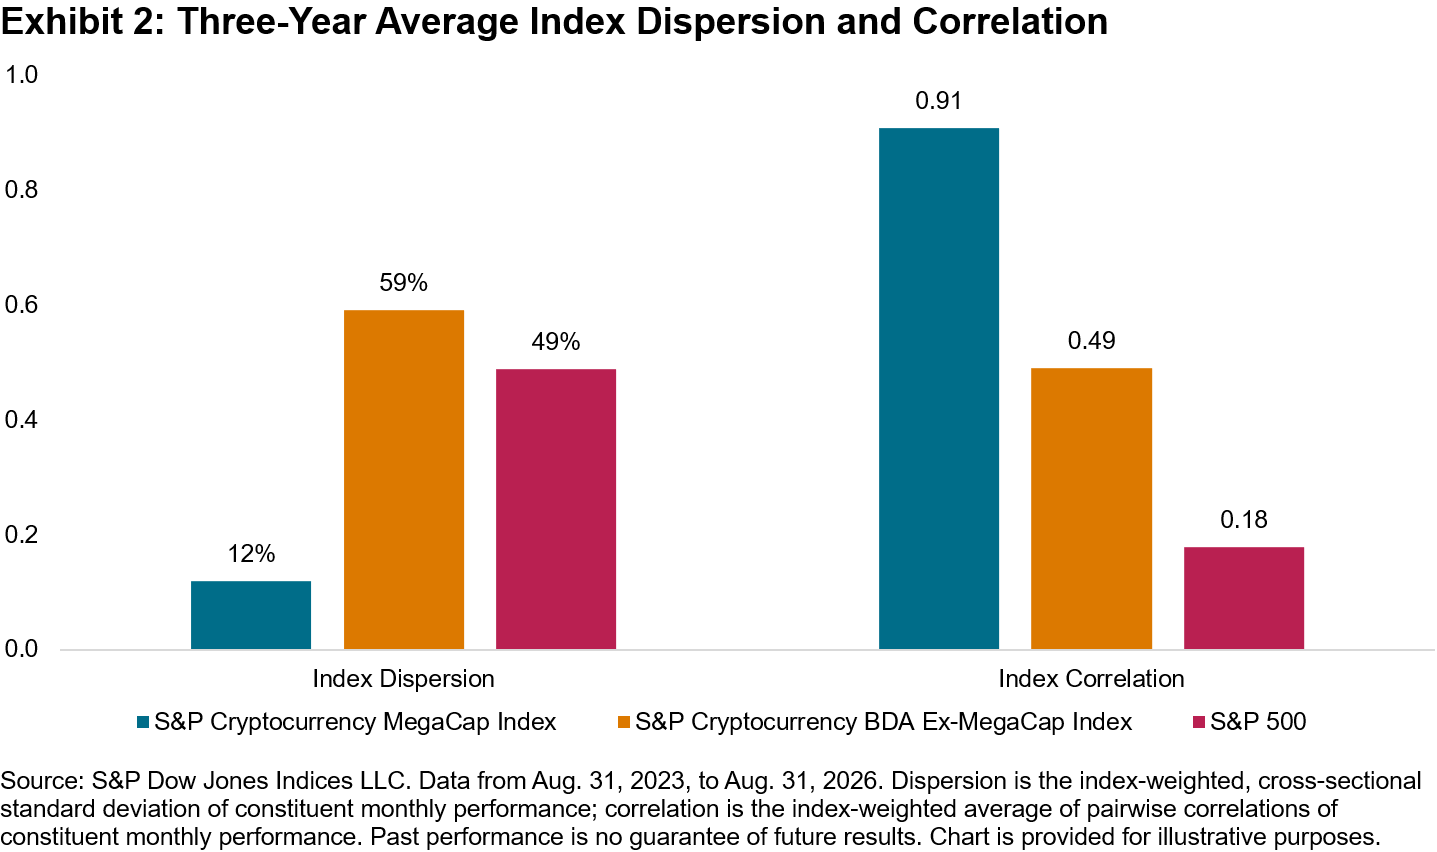
Although cryptocurrencies have long been dominated by Bitcoin and Ether, diversification opportunities did exist beyond these mega caps. As shown in Exhibit 2, the S&P Cryptocurrency BDA Ex-MegaCap Index exhibited considerably higher dispersion and lower correlation among constituents than the S&P Cryptocurrency MegaCap Index over the three-year period ending Aug. 31, 2026. The broader universe contained a wider range of performance drivers than Bitcoin and Ether alone.

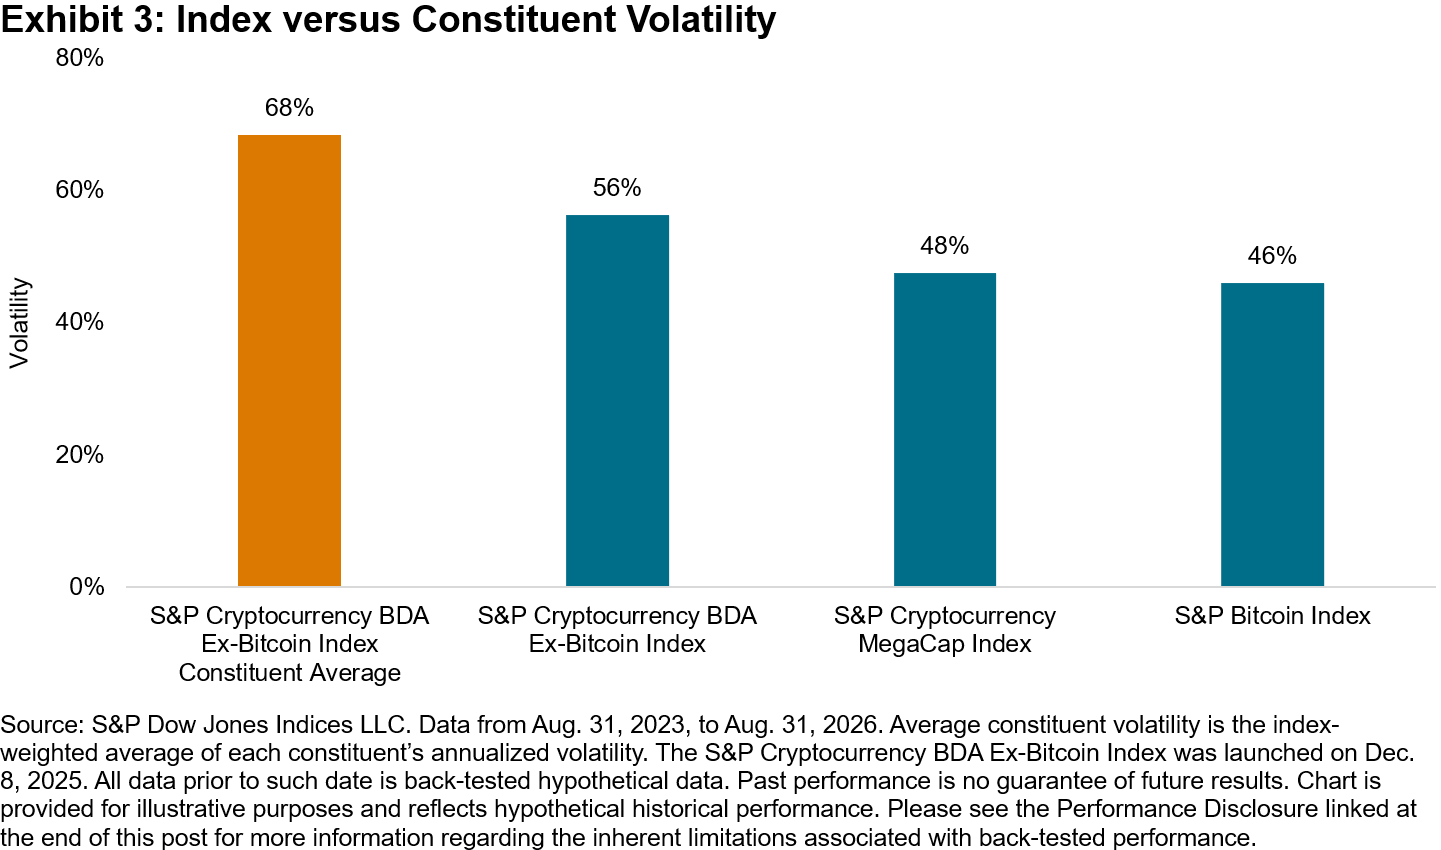
Diversification can reduce volatility when the underlying assets do not move in lockstep. As shown in Exhibit 3, the volatility of the S&P Cryptocurrency BDA Ex-Bitcoin Index was considerably lower than the average volatility of its constituents over the three-year period ending Aug. 31, 2026. However, the index remained more volatile than the S&P Bitcoin Index over the same period, reflecting the higher risk profile of the outside-of-Bitcoin universe.

Exploring Indexing Approaches

While market capitalization weighting is among the most common approaches to indexing, there could be many different ways to construct cryptocurrency indices.3 The S&P Pantera Digital Asset Index, for example, uses a systematic approach that applies fundamental screens for positive protocol revenue and excludes Bitcoin entirely.

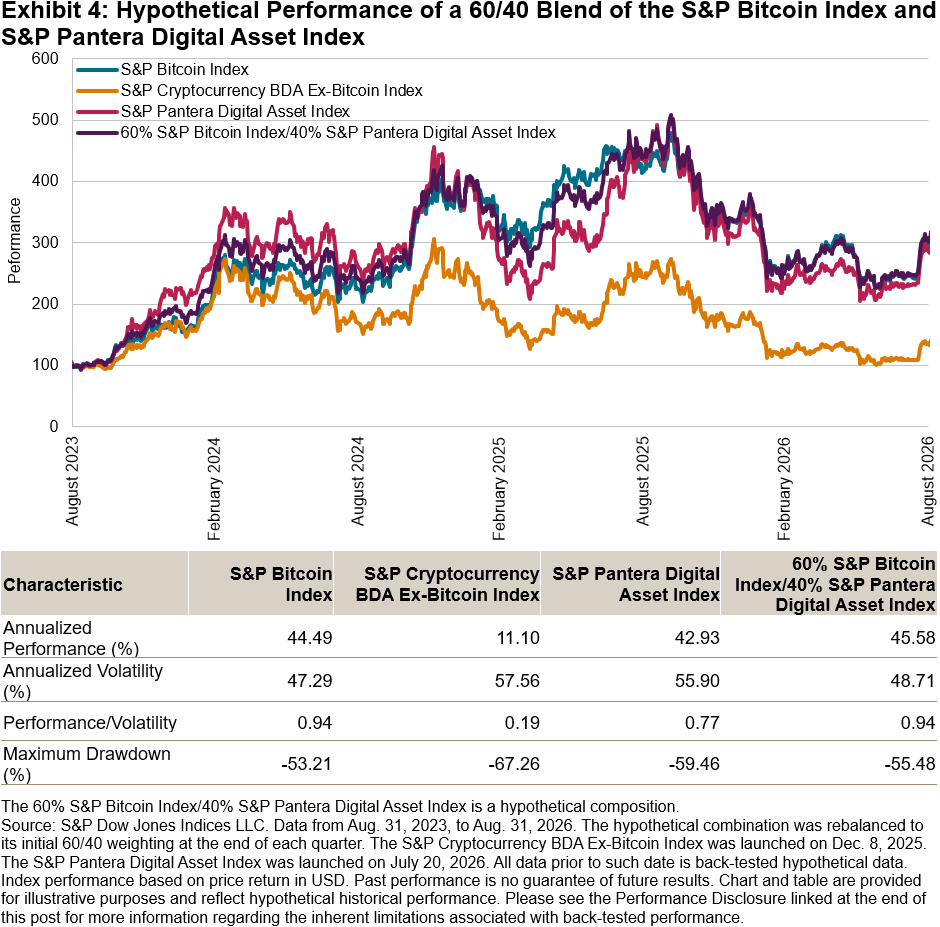
Exhibit 4 illustrates the performance of the S&P Pantera Digital Asset Index and a hypothetical blend of 60% S&P Bitcoin Index and 40% S&P Pantera Digital Asset Index, a combination that broadly mirrors Bitcoin’s share of the cryptocurrency market.

During the three-year back-tested period ending Aug. 31, 2026, the S&P Pantera Digital Asset Index outperformed the S&P Cryptocurrency BDA Ex-Bitcoin Index on both absolute and risk-adjusted bases. More interestingly, the 60/40 index blend resulted in higher absolute performance than the S&P Bitcoin Index and comparable risk-adjusted performance, while experiencing slightly larger drawdowns. These results suggest that a “barbell” approach combining Bitcoin with a diversified index that excludes Bitcoin demonstrated a balance between performance potential and risk exposure.

The potential for indexing cryptocurrencies may rest on lessons from equities. With positively skewed individual asset performance, identifying outperformers in advance has proven statistically difficult. As institutional adoption broadens and the digital asset ecosystem matures, indexing may play a similar role in cryptocurrencies to the one it has long played in equities by providing a transparent, diversified and systematic approach to the market.

1 Approximately USD 16 trillion was indexed to the S&P 500 as of December 2025. See “S&P Dow Jones Indices Annual Survey of Assets” for further details.

2 For the skew in equity returns, see Ganti, Anu R. and Craig J. Lazzara, “Shooting the Messenger,” S&P Dow Jones Indices LLC, Nov. 22, 2022.

3 See the Digital Assets page for the full list of digital asset indices offered by S&P Dow Jones Indices. In addition, S&P Dow Jones Indices recently announced a partnership with Kaiko to launch the S&P Kaiko Digital Asset Indices suite. See the Kaiko website for information.

The posts on this blog are opinions, not advice. Please read our Disclaimers.