






In April 2026, S&P Dow Jones Indices launched the S&P SmallCap 600® Dividend Aristocrats®, completing the U.S. core series of S&P Dividend Aristocrats Indices. With this addition, market participants can now measure consistent dividend growers across the large-, mid- and small-cap segments of the U.S. equity market.
The launch extends the S&P Dividend Aristocrats methodology to a segment in which consistent, long-term dividend growth is particularly rare—and potentially meaningful. This blog introduces the index and examines its methodology, performance and key characteristics.
Methodology
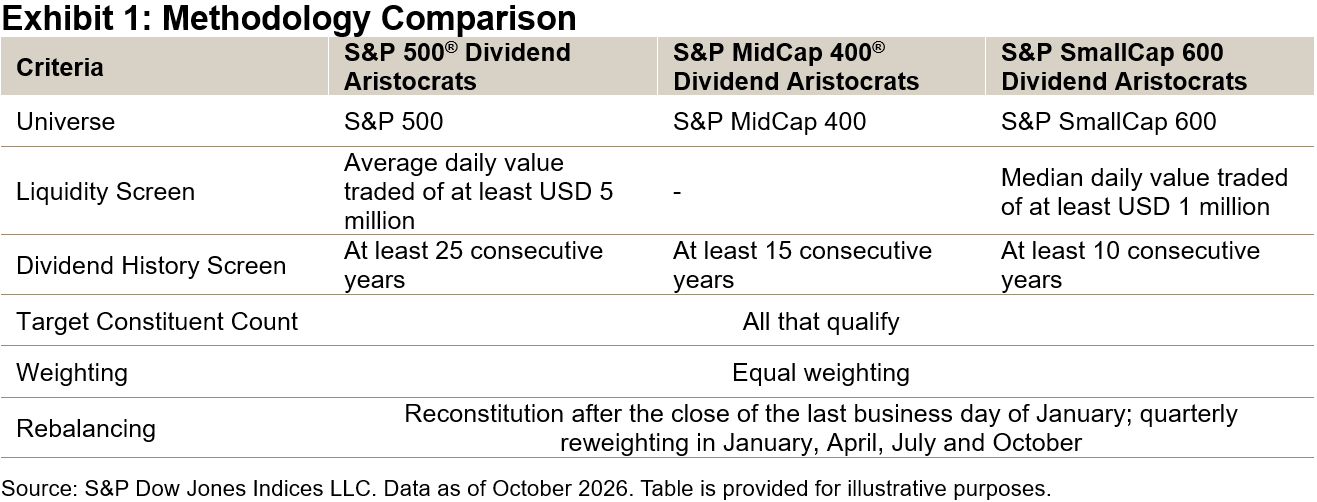
The S&P SmallCap 600 Dividend Aristocrats stands out within the small-cap space through its dual layers of quality focus. First, its eligible universe is the S&P SmallCap 600, which distinguishes itself from other benchmarks1 by requiring constituents to demonstrate profitability for inclusion. From this universe, companies must meet an additional stringent criterion: a track record of at least 10 consecutive years of dividend increases. All companies that satisfy the eligibility requirements are selected and equally weighted.2
Constituent Overview
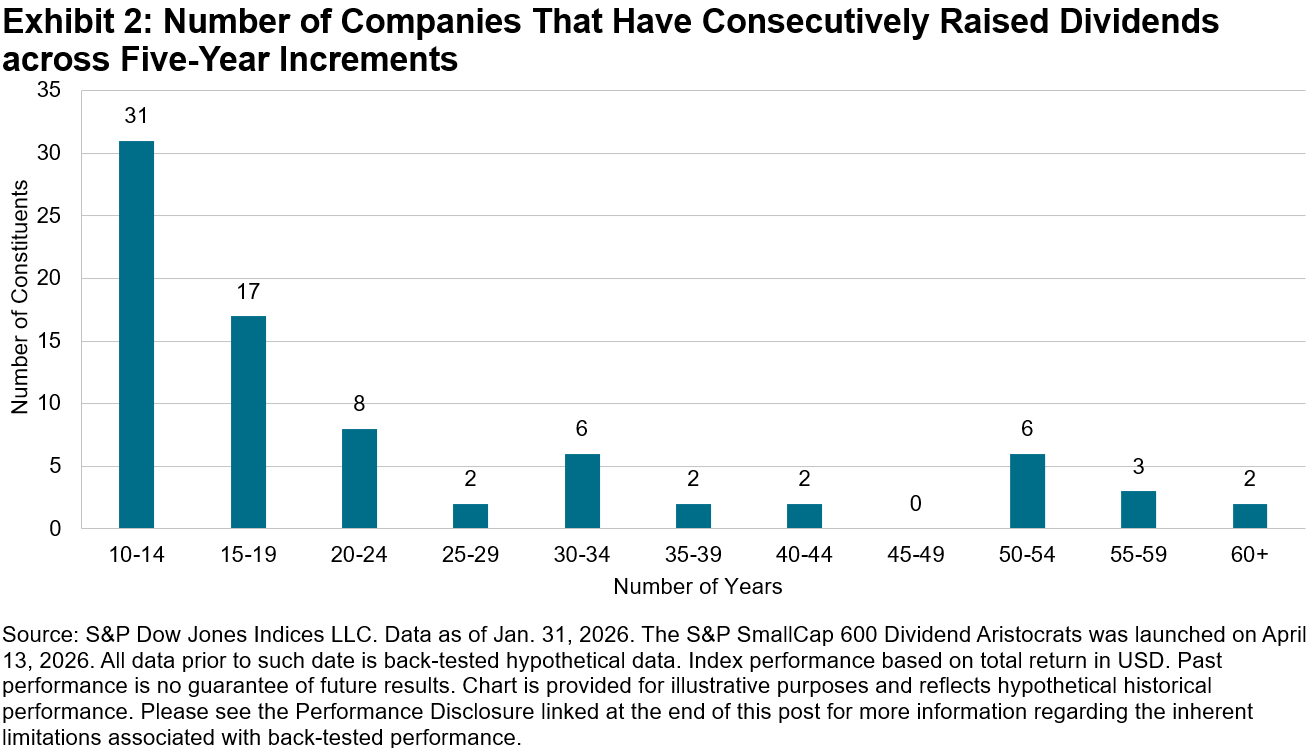
As of the most recent index reconstitution on Jan. 31, 2026, 79 companies qualified for inclusion in the S&P SmallCap 600 Dividend Aristocrats. Of note, because the index draws constituents from a distinct, market-capitalization-based universe, it has no constituent overlap with the S&P 500 Dividend Aristocrats or the S&P MidCap 400 Dividend Aristocrats.
Exhibit 2 summarizes the number of constituents by consecutive years of dividend increases, grouped into five-year increments. More than 60% of the 79 constituents have increased their dividends for at least 15 consecutive years, while approximately 39% have maintained dividend growth streaks of more than 20 years.
Long-Term Outperformance with Lower Volatility
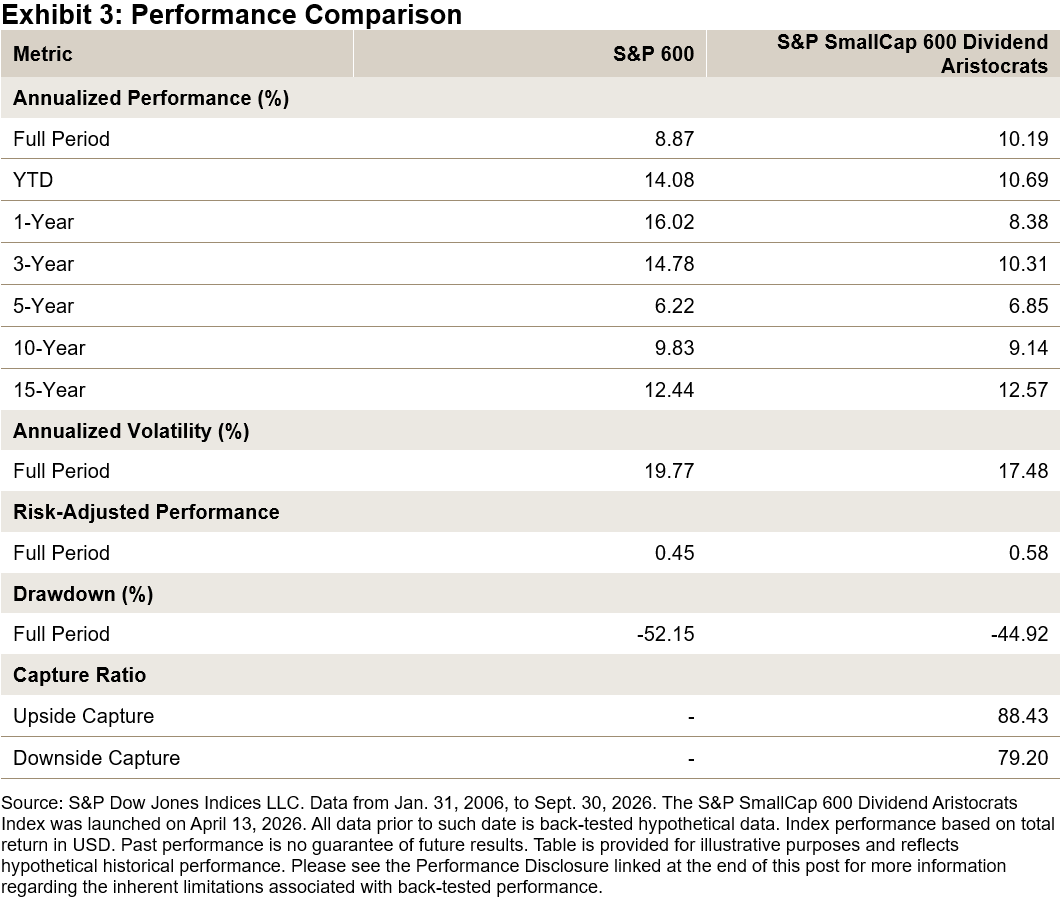
The S&P SmallCap 600 Dividend Aristocrats has shown long-term outperformance and defensive characteristics over the back-tested period observed. Over the full period, the index outperformed the S&P 600® by approximately 132 bps annualized, gaining 10.19% versus 8.87%, respectively (see Exhibit 3). It also exhibited defensive qualities consistent with the broader S&P Dividend Aristocrats Index Series, including lower volatility, a lower maximum drawdown and lower downside capture over the same period.
Higher Quality through Higher Profitability
The S&P Dividend Aristocrats Indices are often associated with quality because of their simple yet stringent dividend growth screens. A company’s ability to increase dividends consistently over the long term and across a range of market and macroeconomic environments may indicate financial strength, disciplined capital allocation and resilient business models.
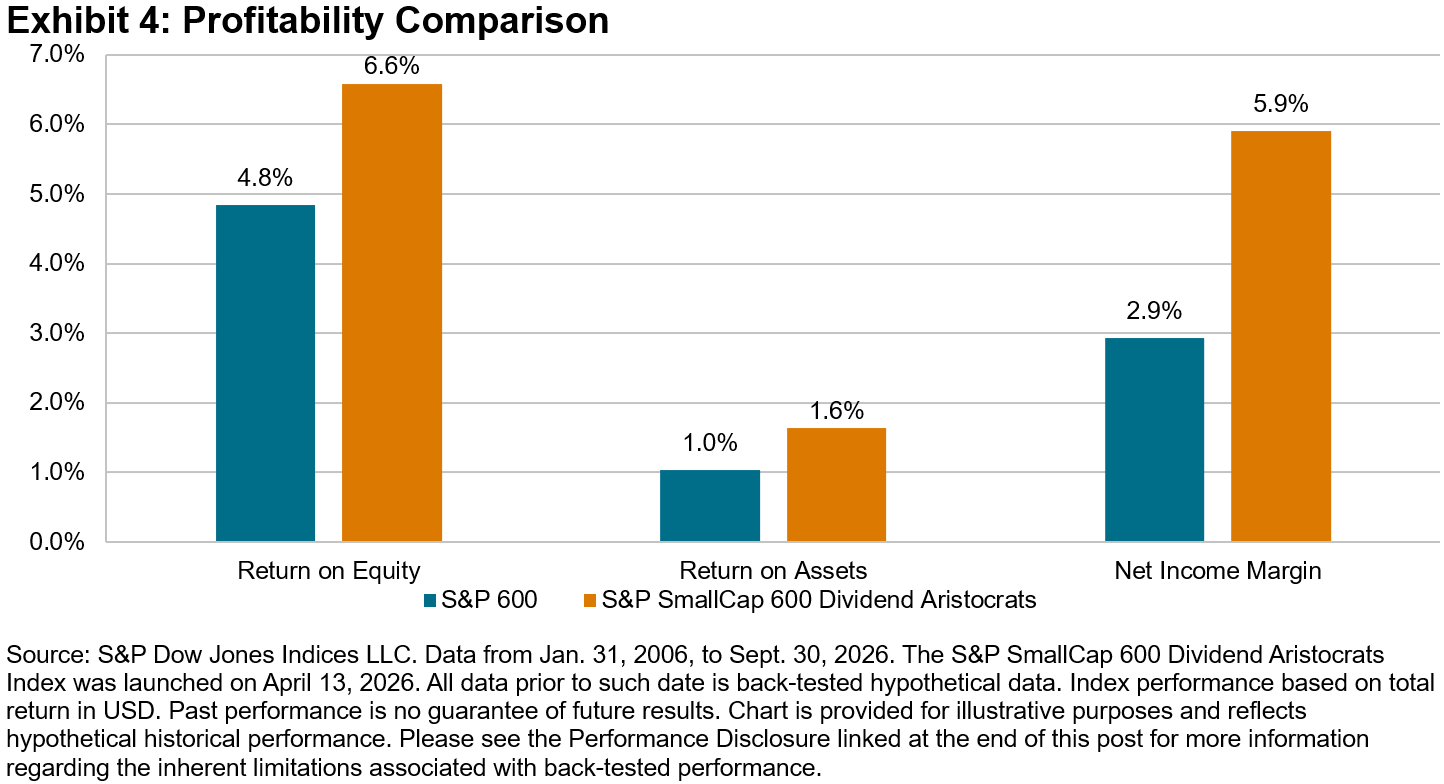
Constituents of the S&P SmallCap 600 Dividend Aristocrats exhibited a similar quality tilt, as reflected in their higher profitability. Exhibit 4 shows that the index generated materially higher returns on equity and assets than the S&P SmallCap 600, as well as a net income margin more than twice as high.
Consistently Higher Dividend Yield
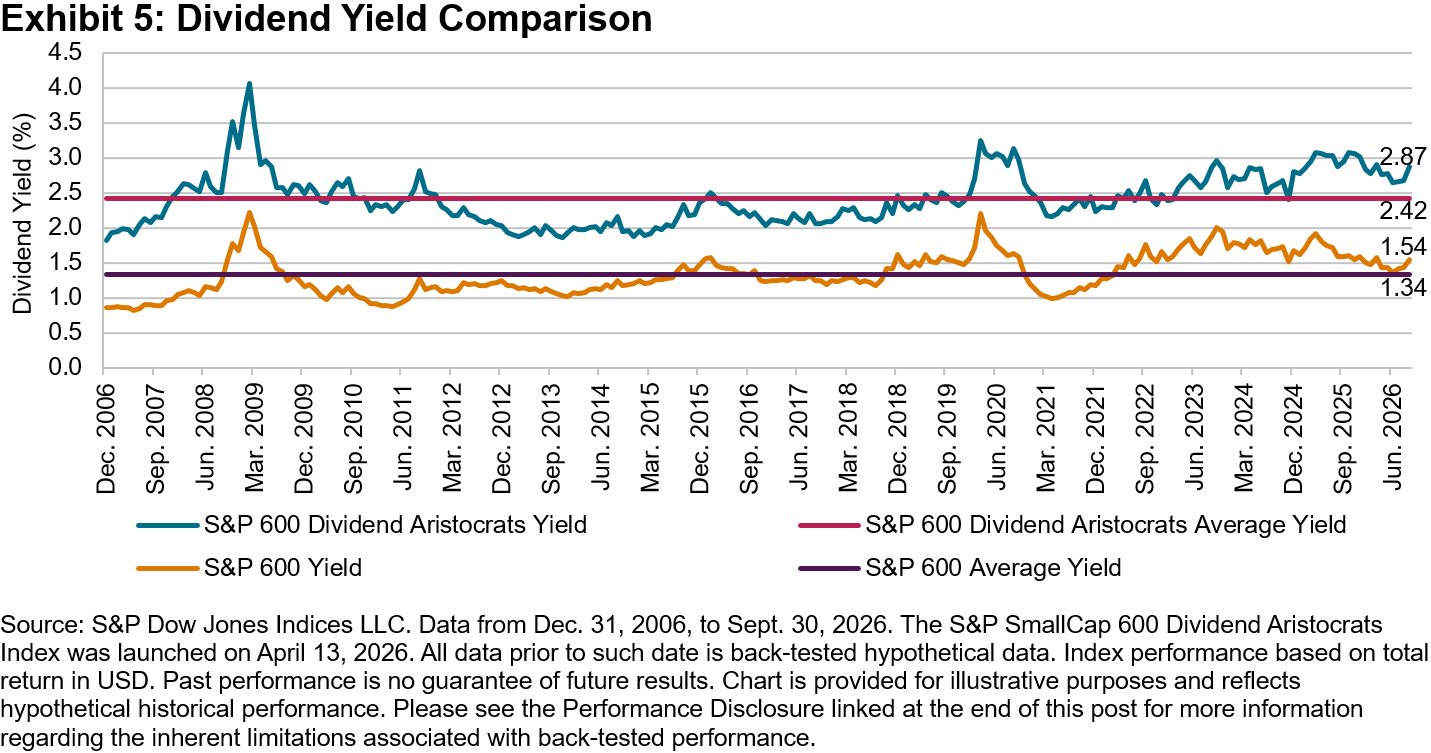
Over the full back-tested period, the average dividend yield of the S&P SmallCap 600 Dividend Aristocrats was 108 bps higher versus the S&P SmallCap 600, with an average yield of 2.42% versus 1.34%, respectively. As of Sept. 30, 2026, that difference has widened to 133 bps, with the index yielding 2.87% compared to 1.54% for its benchmark universe.
Sector Overview
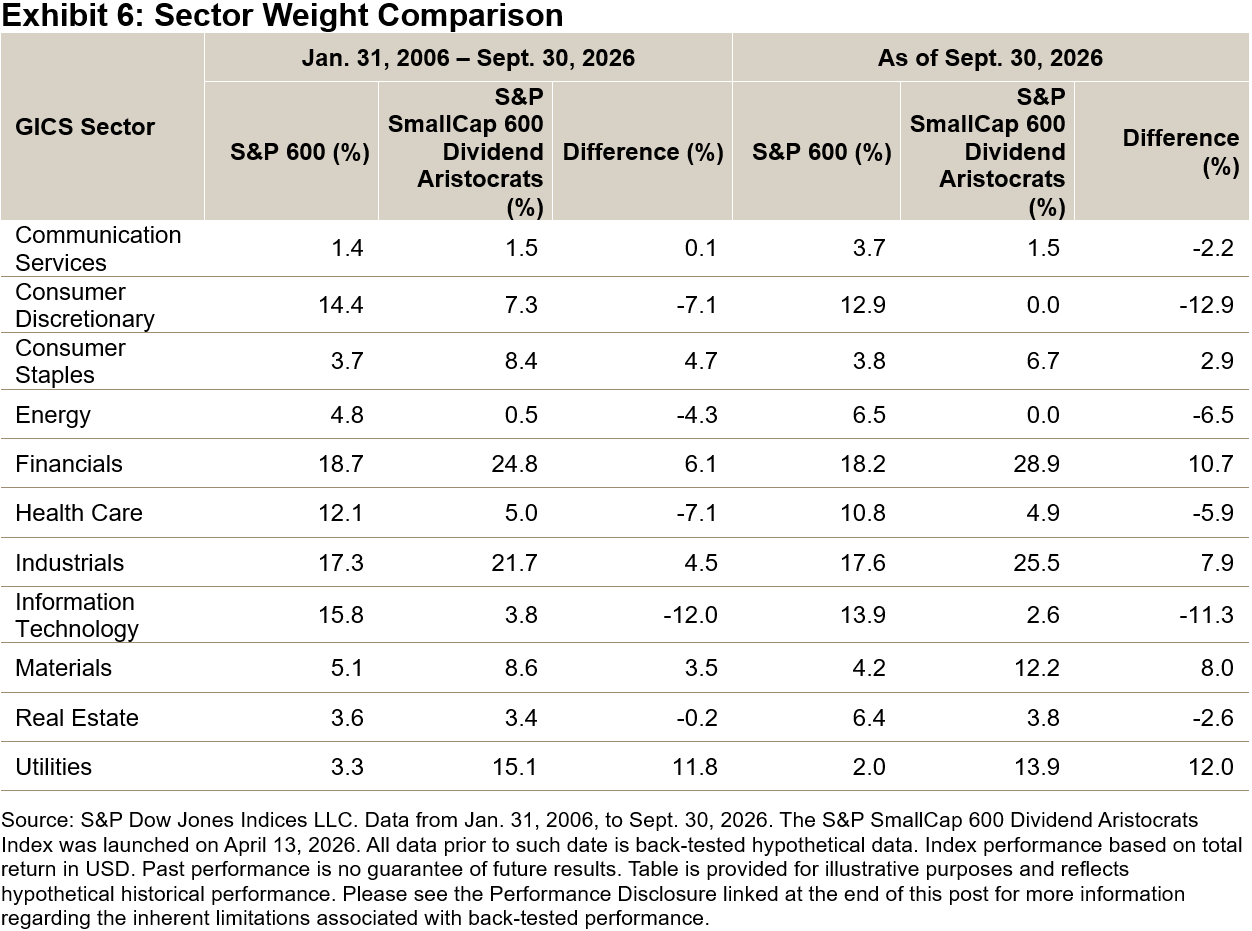
From a sector standpoint, the S&P SmallCap 600 Dividend Aristocrats tended to be underweight sectors such as Consumer Discretionary, Energy and Information Technology, while being overweight sectors such as Utilities, Financials and Consumer Staples (see Exhibit 6).
Conclusion
The launch of the S&P SmallCap 600 Dividend Aristocrats completes the S&P Dividend Aristocrats Index Series across the U.S. equity market, complementing the S&P 500 and S&P MidCap 400 versions. The index applies a dual-quality lens, combining a profitability screen within the S&P SmallCap 600 with a specific dividend growth requirement.
This focus on profitability may be particularly meaningful in the small-cap segment, which has historically lagged its mid- and large-cap counterparts on these measures. Over the long term, the index has exhibited characteristics consistent with the broader S&P Dividend Aristocrats Index Series, including higher risk-adjusted performance and defensive qualities.
1See Preston, Hamish, Fei Wang and Sherifa Issifu, “Celebrating 30 Years of the S&P SmallCap 600,” S&P Dow Jones Indices, Oct. 31, 2024.
2For mor information on index construction, see the S&P Dividend Aristocrats Indices Methodology.
The posts on this blog are opinions, not advice. Please read our Disclaimers.