For more than two decades, the SPIVA® Scorecards have contributed to the active versus passive debate by measuring the performance of active funds against market benchmarks. Since the publication of the first SPIVA U.S. Scorecard in 2002, the methodology has been applied consistently across regions, asset classes and market cycles.1
Performance measurement can be approached from different perspectives. Before interpreting the results, it is therefore important to understand the question an analysis is designed to answer. SPIVA is designed to answer a specific question.
Of the actively managed funds available to an investor at the beginning of a period, what proportion survived and outperformed an appropriate market benchmark by the end of that period?
The methodology is designed around this objective and is applied consistently across markets and through time.
Different Questions Require Different Metrics
Not all investment strategies seek the same outcome. Active funds seek to outperform a benchmark, while passive funds seek to track a benchmark as closely as possible. The appropriate evaluation metrics therefore differ.
For active funds, a key question is whether the fund outperformed a relevant benchmark. For passive funds, the focus is typically on tracking difference and tracking error, which measure how closely a fund follows its benchmark. A passive fund that follows benchmark performance, less fees, would generally be considered to have fulfilled its objective. Applying an analytical framework designed for active funds to passive funds would therefore not address the objective that passive funds are designed to achieve.
Different approaches to evaluating active management can produce different perspectives. For example, one could focus on the average fund, the average invested dollar, surviving funds only or performance relative to a collection of investment products. Each approach may be informative, but each addresses a different question.
SPIVA focuses on active funds’ ability to outperform relative to benchmarks and applies that framework consistently across time periods and fund categories.
Benchmarks Matter
Benchmark selection is a critical part of performance measurement. A useful benchmark should represent the market opportunity set that a fund category intends to access and provide a consistent reference point for comparison across funds.
SPIVA begins with independently defined fund categories supplied by external fund-data vendors and then selects representative market benchmarks based on the characteristics of the category, the historical performance characteristics of its funds as a group and relevant market practices.
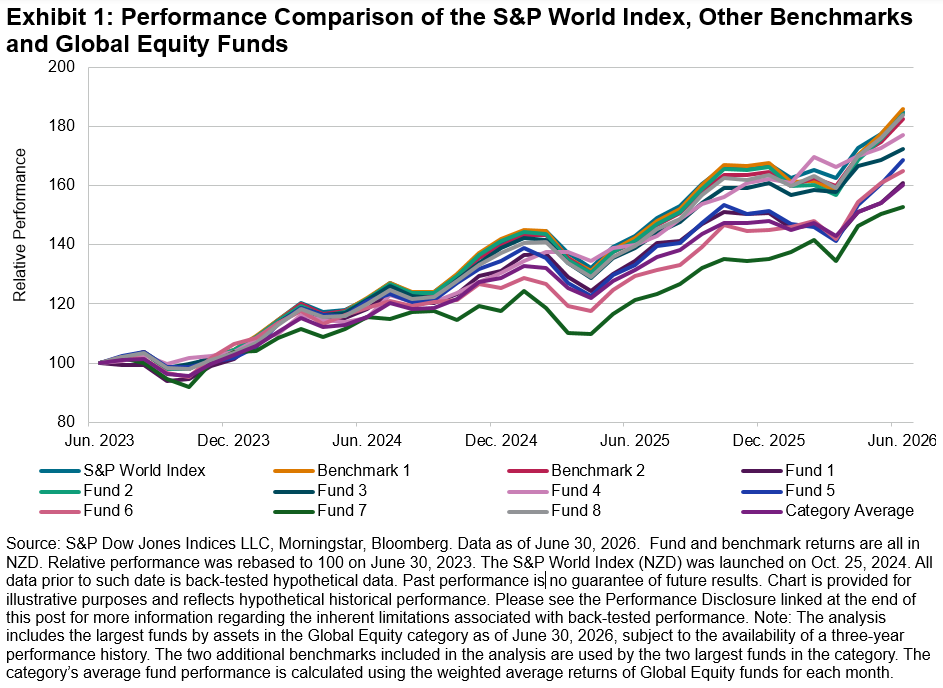
For example, the SPIVA New Zealand Scorecard uses the S&P World Index in NZD total return terms2 as the benchmark for Global Equity funds. As shown in Exhibit 1, the S&P World Index exhibited correlations of 0.99 to 1.00 with two widely used benchmarks in the category and a correlation of 0.97 with the category’s asset-weighted average return over the three years ending June 30, 2026. Longer-term correlations are in a similar range. These results support its use as a closely aligned and consistently applicable category benchmark.
Why SPIVA Starts with the Original Opportunity Set
Survivorship is an important consideration in long-term fund performance analysis. When investors select funds, they cannot know which will survive, merge or liquidate over the intended investment horizon. All funds available at the outset therefore form part of the investor’s opportunity set.
SPIVA evaluates performance using the original fund universe rather than limiting the analysis to funds that survive until the end of the period. This helps address survivorship bias and prevents the analysis from benefiting from hindsight. Excluding non-surviving funds would remove part of the opportunity set investors actually began with and could present an incomplete picture of their eventual outcomes.
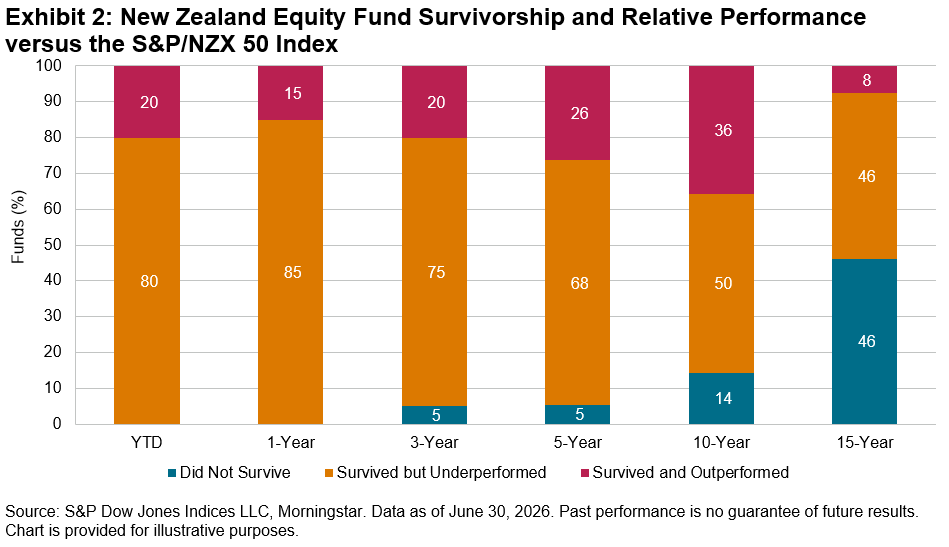
Exhibit 2 illustrates this effect using New Zealand Equity funds. Over the 15-year period ending June 30, 2026, 46% of the original fund universe did not survive, and only 8% both survived and outperformed. Among surviving funds alone, approximately 86% underperformed, compared with an overall underperformance rate of 92% when the original opportunity set was retained.
More than One Headline Number
SPIVA’s underperformance rate is often its most cited statistic, but it is only one part of the scorecard. SPIVA also reports equal-weighted and asset-weighted performance, survivorship statistics and quartile performance.
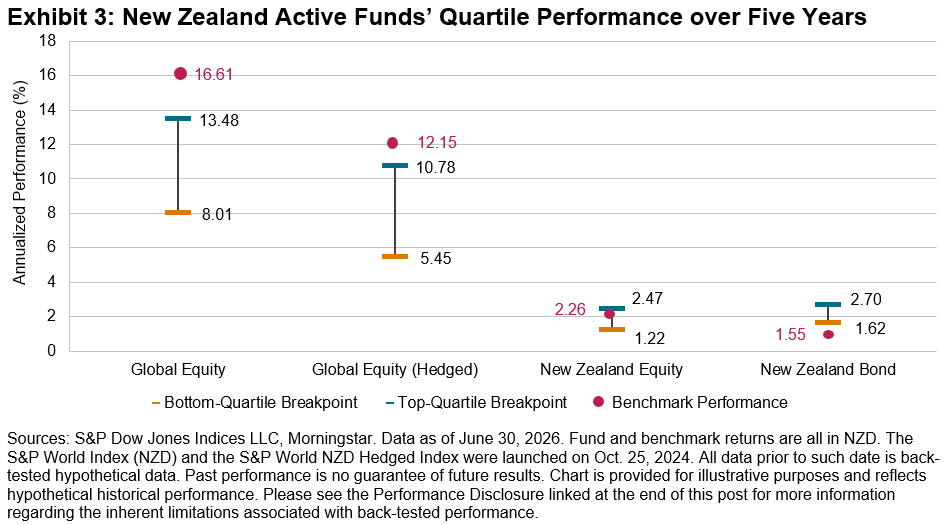
Exhibit 3 shows the range of outcomes among surviving funds over the five-year period ending June 30, 2026. In the Global Equity fund category, top- and bottom-quartile breakpoints were 13.5% and 8.0%, respectively, compared to 16.6% for the S&P World Index. For Global Equity (Hedged) funds, the corresponding breakpoints were 10.8% and 5.4%, compared with 12.2% for the S&P World NZD Hedged Index. The comparison illustrates both the dispersion of active fund outcomes and the potential influence of currency treatment on performance.
Conclusion
Different methodologies may arrive at different conclusions because they are designed to answer different questions. SPIVA provides a transparent and consistent framework for examining how frequently active funds have survived and outperformed an appropriate market benchmark. Understanding the question being asked is the first step in interpreting the answer.
1 For more information and background on the SPIVA Scorecards, please see SPIVA By the Numbers: A Global Perspective and What is SPIVA?
2 The S&P World Index was launched on Feb. 13, 2009, while its NZD-denominated versions were launched on Oct. 25, 2024.
This content may be AI-assisted and is composed, reviewed, edited, and approved by S&P Global.
The posts on this blog are opinions, not advice. Please read our Disclaimers.