Get Indexology® Blog updates via email.

In This List

Private Credit Is Evolving, How Are Benchmarks Keeping Pace?

Using Benchmarks to Understand and Measure Digital Assets

The Next Phase of Volatility Control in Indexed Insurance

Digging Deeper: 20 Years of the S&P Metals & Mining Select Industry Index

Measuring USD Leveraged Loans for the Brazilian Market

Private Credit Is Evolving, How Are Benchmarks Keeping Pace?

Contributor Image
Ari Rajendra

Head of Private Markets Indices

S&P Dow Jones Indices

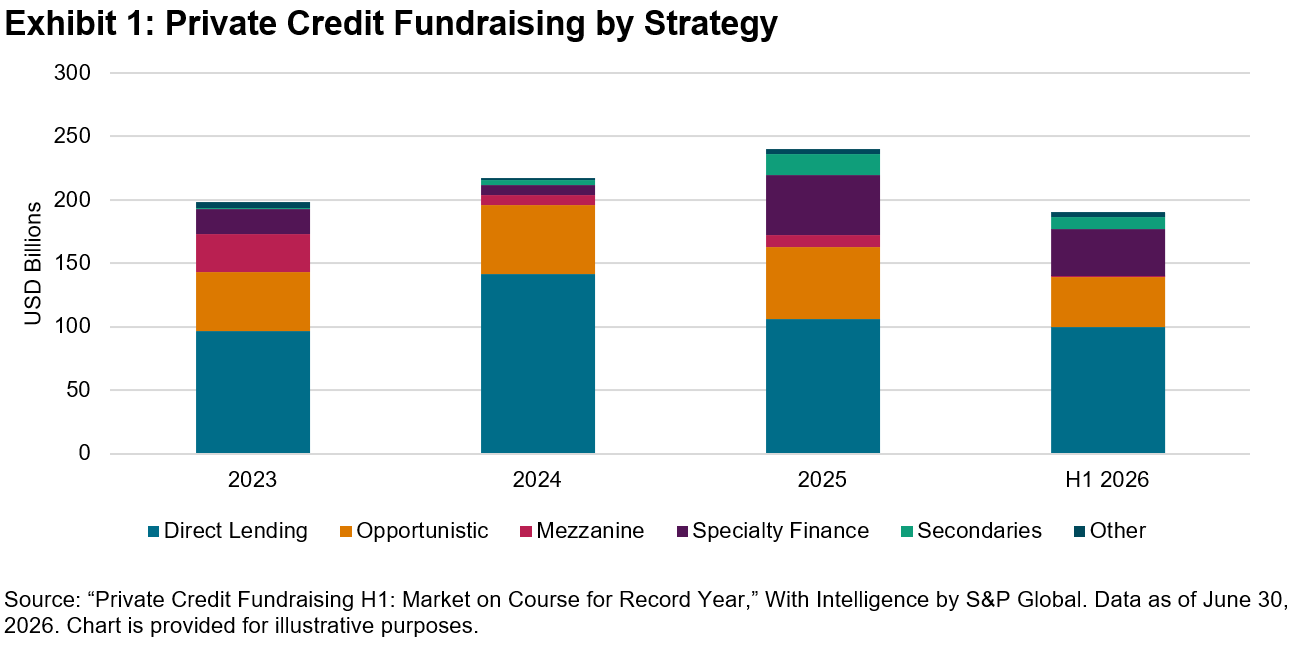
Private credit has become one of the fastest-growing asset classes within global capital markets. In the first half of 2026 alone, private credit fundraising reached USD 190 billion, which is on pace to surpass the 2025 full-year total of USD 240 billion (see Exhibit 1).1 Direct lending has driven much of private credit’s growth, having multiplied roughly sixfold between 2016 and 2024.2 It is now the largest segment within private credit and an increasingly important source of financing for middle-market companies in the U.S. and Europe.
However, the rapid growth of private credit has prompted increased scrutiny, reflecting concerns about the asset class’s inherent opacity, volatility and valuation uncertainty. These concerns have been reinforced by recent headlines focusing on valuation practices, liquidity risk, redemption pressures and credit quality. As private credit continues to grow in scale and significance, market participants looking to understand and measure these changing dynamics need transparent and trusted benchmarks, but are often limited by lagged, manager-reported fund-level data. So, how can benchmarks keep pace and offer market participants the insights needed to effectively monitor this fast-evolving space?

Going Beyond Headline Performance

Private credit benchmarks have existed for years, but many are built on fund-level performance rather than on the underlying loans. This has created an incomplete picture of risk and volatility. Unlike public credit benchmarks that are supported by more timely and readily available data sources, reporting practices, data availability and calculation standards vary across private credit managers. The result is often a fragmented view of the market that makes constituents harder to compare and private credit more difficult to assess alongside public markets.

Closing this benchmarking gap requires richer fund- and asset-level data, along with a common framework for translating that information into standardized market measures comparable to those used in public markets. Frequent valuations and deeper data are also key for ensuring market participants have access to timelier information, which is particularly important during periods of market uncertainty when visibility becomes even more critical.

Loan-level data provides transparency into credit quality, yield, maturity profiles and portfolio concentrations across industries, seniority bands and borrower EBITDA segments. This information enables investors to better understand the underlying drivers of performance and identify evolving risks that top-line performance measures cannot.

Credible loan-level data, however, is only one part of the solution. The next generation of private credit benchmarks should combine asset-level information with consistent methodologies, trusted calculations and robust index governance. That combination creates a common reference point for evaluating performance and risk across managers, constituents and markets over time.

Building the Foundation for Better Measurement

Developing an enhanced benchmarking infrastructure increasingly requires collaboration across the private credit ecosystem. Many leading industry specialists have access to data that has historically been difficult to aggregate, while index providers contribute the methodology and governance needed to make it comparable. Together, these capabilities can help transform fragmented observations into reliable market benchmarks.

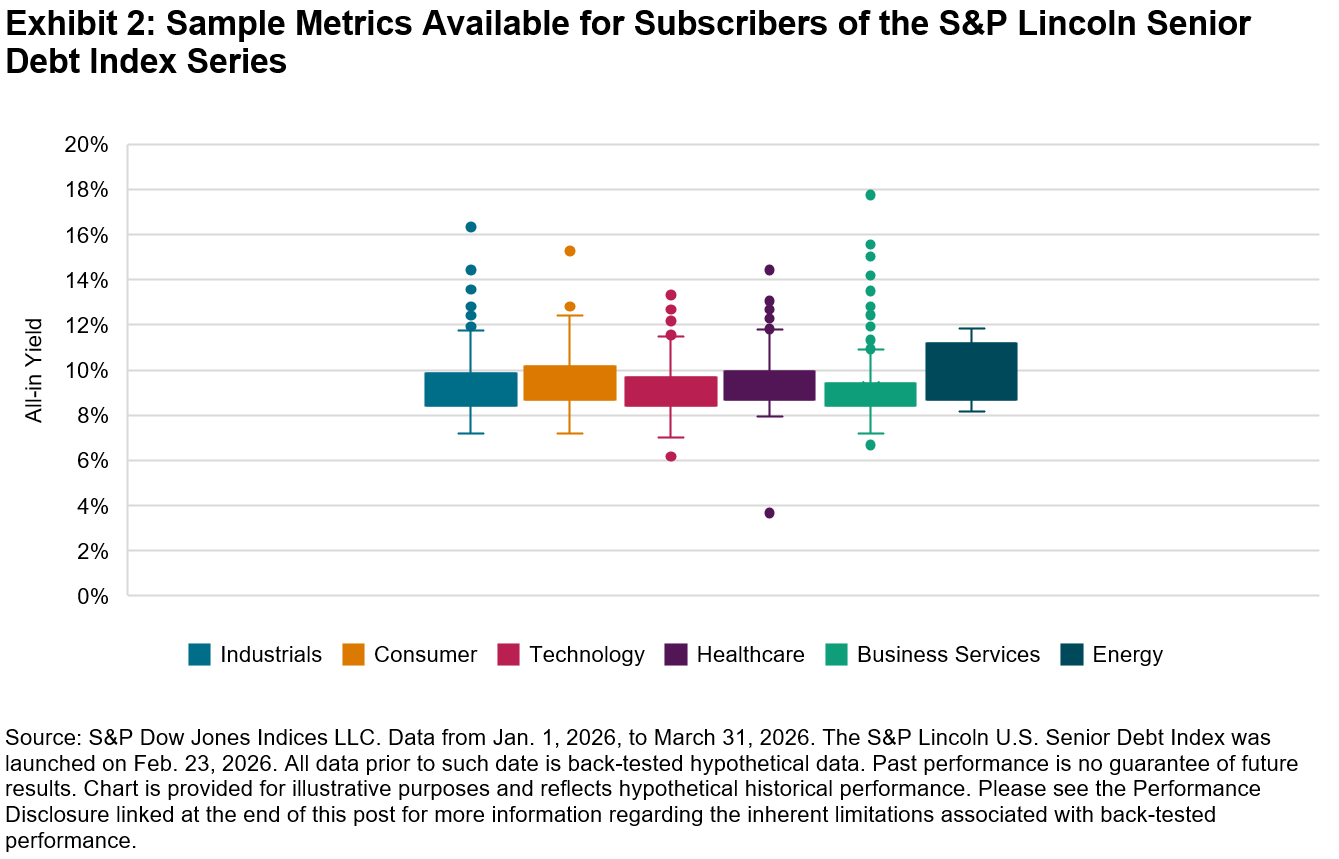
The S&P Lincoln Senior Debt Index Series, developed by S&P Dow Jones Indices (S&P DJI) in collaboration with Lincoln International, a global investment banking advisory firm, combines Lincoln’s private loan valuation data with S&P DJI’s transparent rules-based index methodology and governance framework. It measures illiquid senior debt facilities issued primarily to private-equity-sponsored companies in the U.S. and Europe, using granular loan-level insights to provide a systematic view of direct lending. This index series offers subscribers a rich set of credit metrics—including returns, fair value movements, yields, coupon spreads, leverage and borrower characteristics by firm size, sector and time period—that enable users to analyze how yields and spreads change over time, how risk differs between borrowers and how credit conditions vary across sectors (see Exhibit 2).
Better measurement will not erase the structural differences between private credit and public markets. It can, however, provide a clearer lens into performance, risk and market dynamics. As private credit continues to evolve, benchmarking infrastructure needs to evolve alongside it, helping the market move toward a new generation of benchmarks that offer greater transparency, comparability and possibility.

Learn more about the S&P Lincoln Senior Debt Index Series to see how we’re helping market participants assess performance and risk with greater transparency.


1Private Credit Fundraising H1: Market on Course for Record Year,” With Intelligence by S&P Global, Aug. 12, 2026.

2 Source: S&P Global, CapIQ. Data from Dec. 31, 2016, to Dec. 31, 2024, as presented in Exhibit 1 of S&P DJI’s “Measuring Direct Lending: Building Transparency in Private Credit Markets,” April 1, 2026.

The posts on this blog are opinions, not advice. Please read our Disclaimers.

Using Benchmarks to Understand and Measure Digital Assets

As digital assets become more institutional, the need for a clear way to define, measure and compare them is becoming more pressing. Without relevant, and credible, benchmarks, fund managers can struggle to explain performance, and allocators their risk, when comparing strategies against the wrong reference point.

This is not just a theoretical challenge. It is already shaping how strategies can be evaluated and how capital is allocated among digital assets. Segmented benchmarks that provide clear definition and comparability can serve as effective tools for understanding and measuring the ecosystem.

Understanding the Investable Universe

As the first and largest digital asset, Bitcoin has been used by many fund managers and allocators as a rough proxy for market beta. While it can be useful as a first-pass comparison point, it is often not representative of the entire crypto market. There are now thousands of digital assets, and even among the top percentile and investable universe there are important nuances to consider.

Bitcoin, as a cryptocurrency, is widely considered a store-of-value asset. Therefore, its performance is largely tied to supply and demand. Bitcoin’s performance profile differs from other digital assets—such as ecosystem layers like Ethereum and Solana.

This highlights an opportunity for segmented benchmarks that provide a suitable, comparable reference point for the digital asset strategy being analyzed.

The Fund Manager Dilemma

In traditional asset classes, the relationship between a strategy and its benchmark is generally well understood. In digital assets, that relationship is still developing. Fund managers often struggle to find benchmarks that match what they invest in. A strategy focused on smaller, emerging, sector-specific or a diversified set of assets is very different from one centered on large-cap assets such as Bitcoin or Ethereum. This can present challenges for fund managers who are assessing and promoting their strategies.

For example, using a Bitcoin benchmark to measure the performance of an actively managed strategy containing multiple mid-cap cryptocurrencies and digital assets may lead to inaccurate conclusions. If Bitcoin does well in a particular market cycle, but the underlying strategy contains assets that did not, it may appear the fund is not providing alpha relative to the benchmark. However, the underlying risk characteristics and performance drivers are not similar and, therefore, the comparison may not be suitable.

A multi-asset benchmark can solve this dilemma. In the prior scenario, a benchmark that contains a mix of mid-cap digital assets can establish a clear definition of what is being measured and serve as an unbiased, comparable reference point. Fund managers can use this to right size how their strategy has performed through market cycles and promote accordingly.

Allocators Want More Clarity

Allocators face a similar challenge as fund managers when using Bitcoin as a standalone benchmark. When they compare active managers to it, investors are looking for whether outperformance is due to security selection, asset allocation or market timing. If they mistake broad market exposure for manager skill and stay invested, that may be a missed opportunity for investors to find true alpha-generating opportunities. In those cases, allocators could leverage a range of indices to meet their exposure needs.

This has real implications for institutional allocators who are deploying sizeable asset bases and managing tight fee budgets.

Designing Benchmarks to Meet Institutional Needs

To help solve both sides of the fund manager and allocator challenge, benchmark providers are creating methodologies that segment the digital asset market. Benchmarks can be designed for different use cases to include constituents by market cap, excluding large-cap assets, or to diversify through equal-weight approaches and a range of weighting scheme.

For those with a focus on income-oriented opportunities, using derivatives or combining cryptocurrencies with other asset classes like equities can be another approach to diversification. Each approach offers a different lens and can help align definition and measurement more closely with investment intent.

As the market continues to mature, having the right benchmark in place becomes increasingly important. It allows both managers and allocators to better understand performance and make more informed decisions about where to invest capital.

Explore how different benchmark approaches can be used to track the evolving digital asset market with S&P DJI’s digital asset benchmarking capabilities.

The posts on this blog are opinions, not advice. Please read our Disclaimers.
The Next Phase of Volatility Control in Indexed Insurance

Contributor Image
Yuan Tian

Executive Director, Multi-Asset Indices

S&P Dow Jones Indices

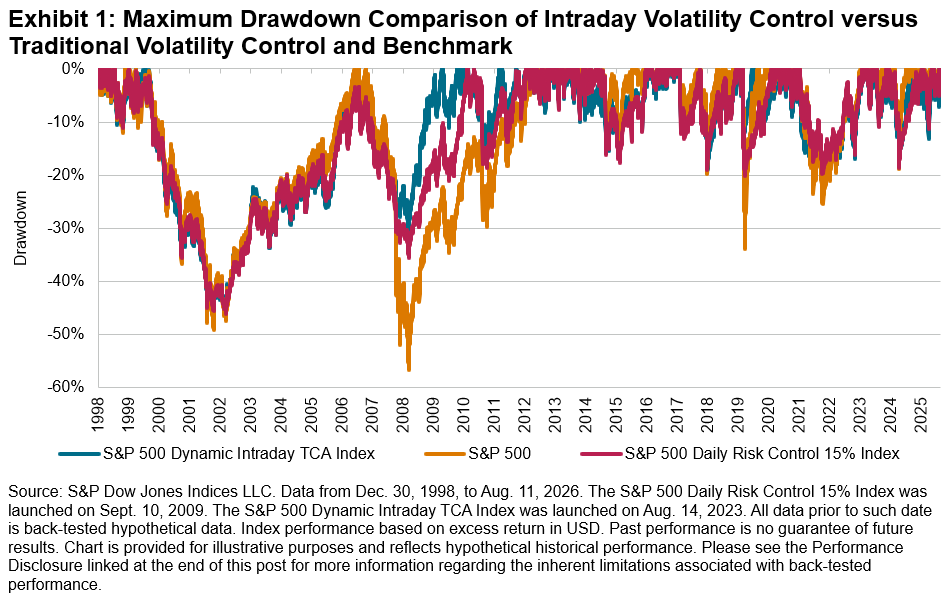
Volatility-controlled indices (VCIs) have become a cornerstone of indexed insurance product design, helping insurers navigate volatility while maintaining exposure to growth assets. S&P Dow Jones Indices recently published the paper Indexed Insurance: Embracing Volatility-Controlled Indices in Next-Generation Products, in which we explore the growth in popularity of VCIs, their performance across market environments and their evolution. The paper also examines how volatility-control strategies have adapted to support the growing indexed insurance market and the changing needs of modern market participants. Recent market performance demonstrates how quickly risks can emerge and evolve in today’s environment—highlighting the important role that VCIs may play in turbulent markets, as well as the inherent tradeoffs such strategies represent.

2025 and 2026 saw markets characterized by periods of heightened uncertainty, sharp market selloffs and rapid rebounds—all of which created a challenging backdrop for VCIs. Compared with broad equity benchmarks, VCIs generally helped mitigate drawdowns during periods of market stress, although their volatility-management frameworks also resulted in more muted participation during subsequent recoveries.

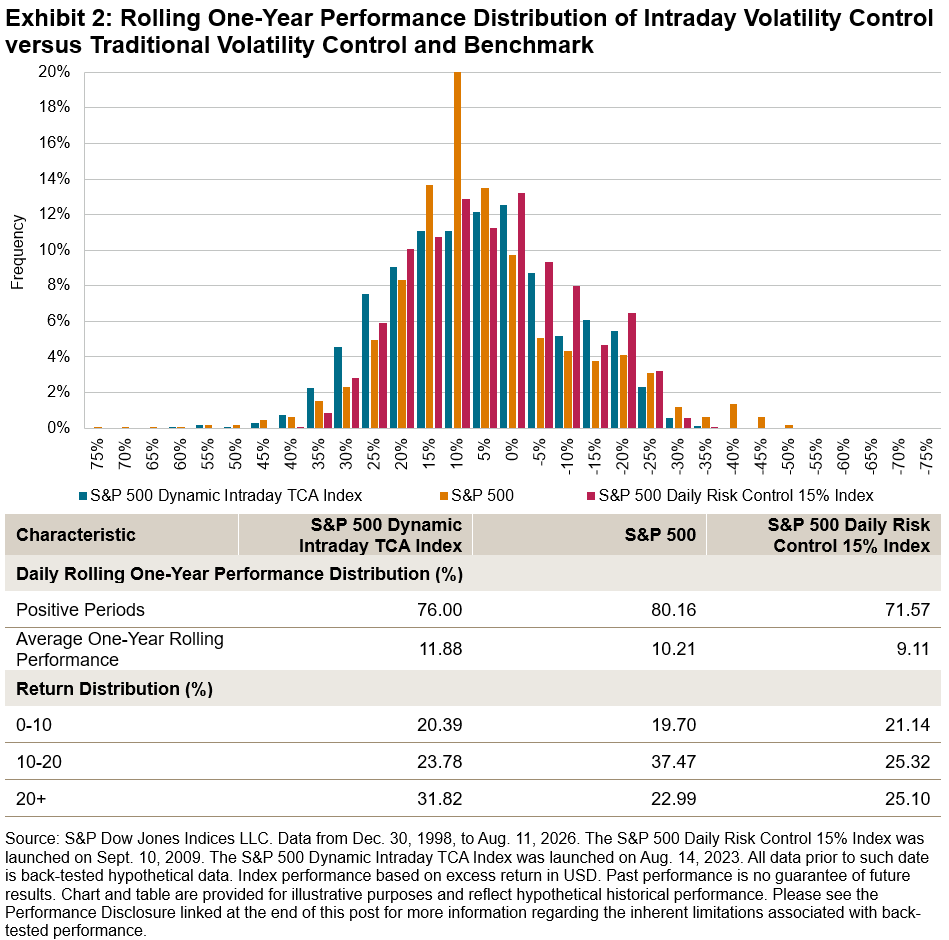
However, evaluating VCIs solely through the lens of short-term relative performance may not capture their broader role within indexed insurance products. Due to the nature of indexed insurance products, characteristics like rolling returns and rolling volatility may better reflect the potential value of VCIs as complements to benchmark indices in these products. As seen in Exhibit 2, both the S&P 500® Daily Risk Control 15% Index and S&P 500 Dynamic Intraday TCA Index exhibited a narrower range of rolling one-year performance than the S&P 500, illustrating how a volatility-control mechanism may smooth the experience across different market environments.

A narrower distribution of rolling one-year performance suggests that the risk-control mechanisms may help reduce extreme outcomes and mitigate fat-tail risk, resulting in a more balanced performance distribution while preserving exposure to long-term equity growth. In particular, the S&P 500 Dynamic Intraday TCA Index was able to achieve higher rolling one-year performance than the S&P 500 and the traditional volatility control index.

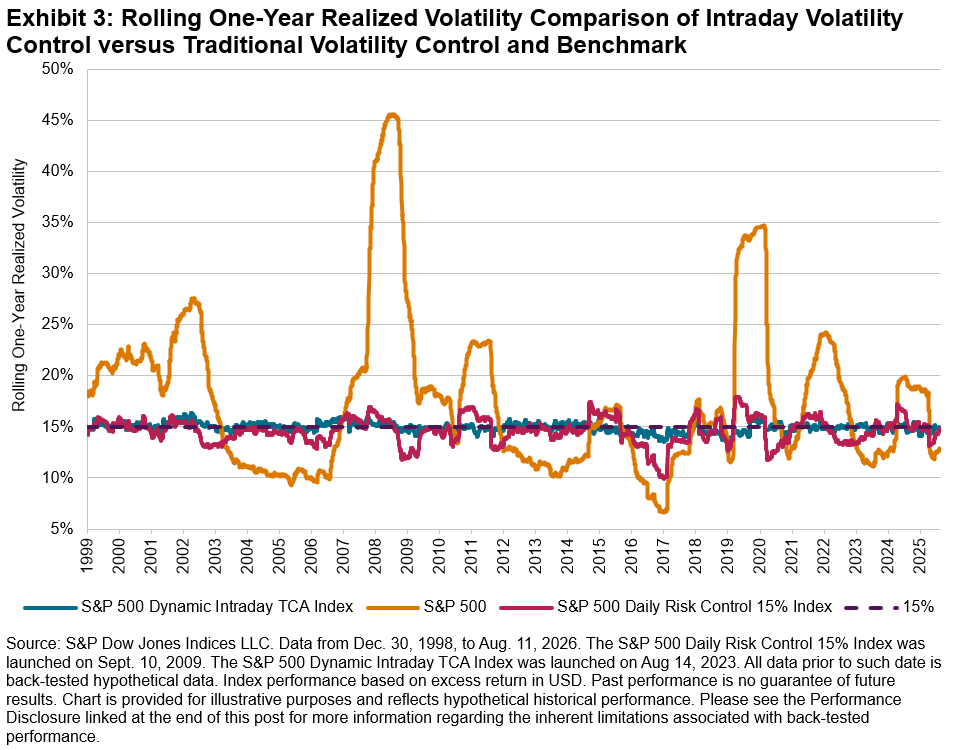
While rolling performance highlights outcome consistency, realized volatility provides a direct measure of risk management effectiveness. As shown in Exhibit 3, both volatility-controlled indices generally maintained lower realized volatility than the S&P 500. The dynamic intraday approach further reduced realized volatility than traditional daily risk-control methods, highlighting the evolution of volatility-control technology.

VCIs can reflect the trade-off between downside protection and upside participation, but their characteristics extend beyond raw index performance. Recent market conditions have reinforced that VCIs are generally not designed to outperform in every environment. Rather, they seek to provide a more stable risk profile.

The posts on this blog are opinions, not advice. Please read our Disclaimers.
Digging Deeper: 20 Years of the S&P Metals & Mining Select Industry Index

Contributor Image
Amit Pathak

Head of U.S. Equity Product Management Asia-Pacific

S&P Dow Jones Indices

From artificial intelligence and electrification to infrastructure spending and geopolitical competition for critical minerals, metals and mining companies sit at the center of some of the most important themes of this decade. The S&P Metals & Mining Select Industry Index tracks the performance of the companies that discover, extract and process the materials powering the global economy.

The S&P Metals & Mining Select Industry Index offers a focused view of the U.S. metals and mining sector. The index selects eligible companies from across various GICS® sub-industries, including Aluminum, Copper, Gold, Silver, Steel, Coal & Consumable Fuels and Diversified Metals & Mining. Constituents must be members of the S&P Total Market Index and meet minimum liquidity and market capitalization requirements.1

The index rebalances quarterly, with eligible constituents being initially equally weighted, with modifications made to ensure that for a given theoretical portfolio value, each constituent’s index weight cannot exceed 4.5% of the float market capitalization and the value that can be traded in three days.

Evolution of the Index

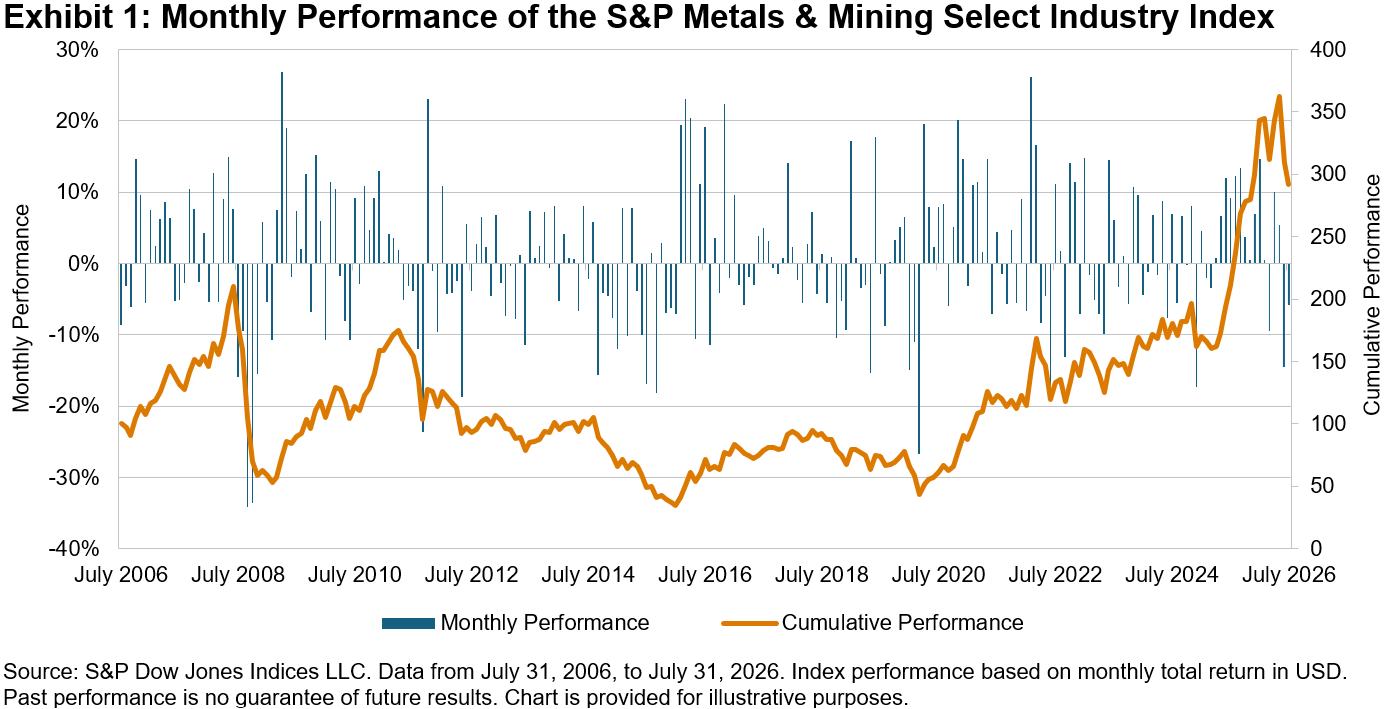
Launched on June 19, 2006, the S&P Metals & Mining Select Industry Index recently marked its 20th anniversary. Exhibit 1 shows the index’s monthly and cumulative performance over the past two decades. During this period, the index delivered an average monthly gain of 0.95%, with a positive monthly performance in 52.9% of observations.

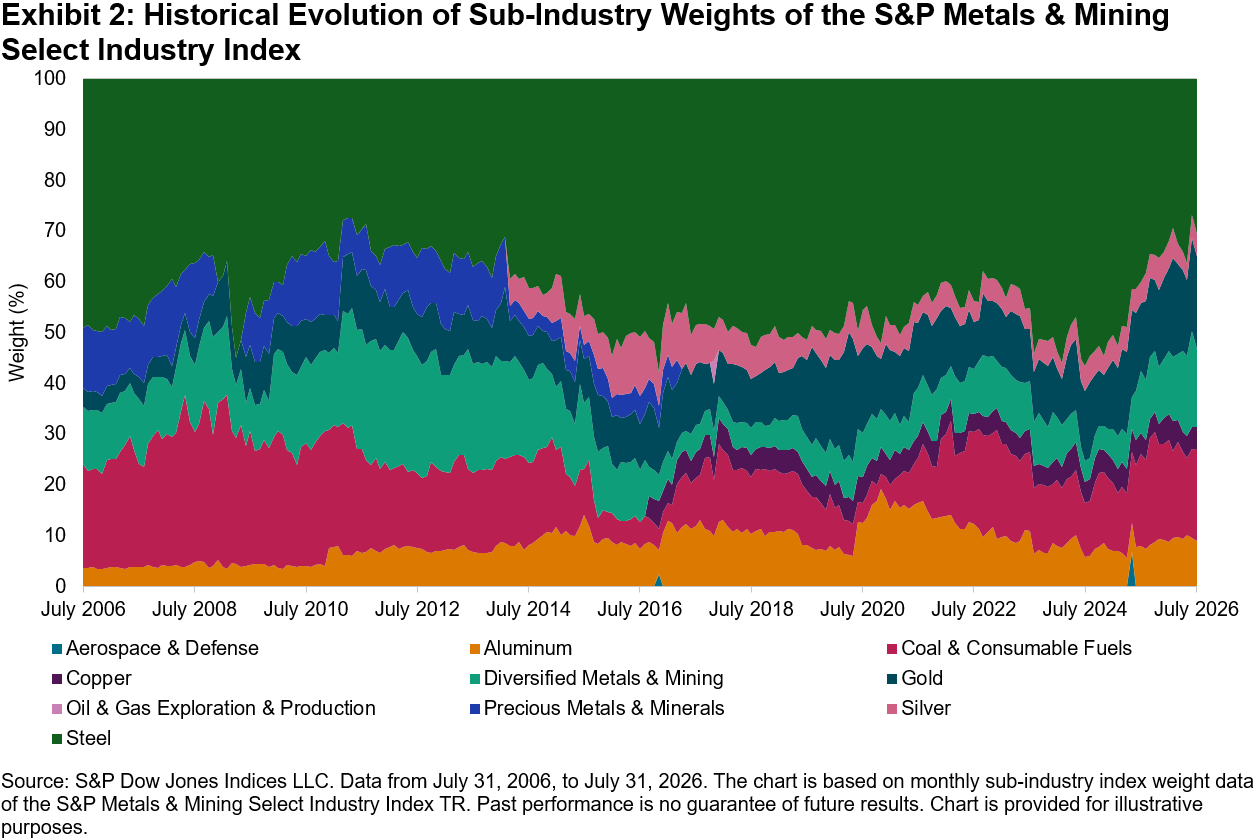
The S&P Metals & Mining Select Industry Index’s composition has changed considerably over time, reflecting both market trends and methodology updates.2

As seen in Exhibit 2, since its launch in July 2006, the index has evolved away from being a steel-heavy benchmark—Steel accounted for 49% of the index at launch, followed by Coal & Consumable Fuels at 20% and Diversified Metals & Mining and Precious Metals & Minerals at about 11%-12% each. The weight of Coal & Consumable Fuels grew significantly during the late 2000s, exceeding 30% at its peak, while the creation of the Copper sub-industry under the Metals & Mining industry resulted in the addition of Copper in 2016,3 further broadening the index’s industry representation. By July 2026, the index was more balanced, with Steel (31%), Coal & Consumable Fuels (18%), Precious Metals & Minerals (18%), Diversified Metals & Mining (15%), Aluminum (9%) and Copper (5%) all representing meaningful weights, reflecting a much broader cross-section of the U.S. metals and mining industry than at launch.

Effect of Participation across Sub-Industries and Capping on Performance

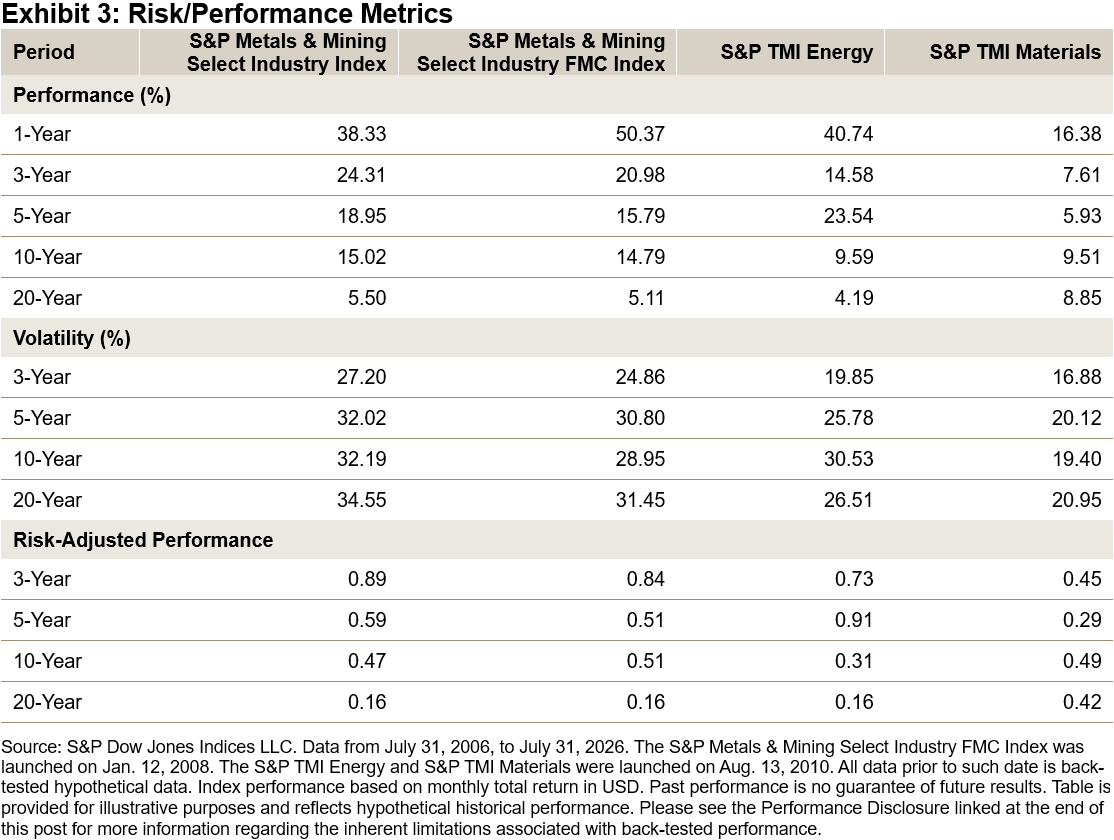
Exhibit 3 shows the effects of having a more targeted focus on U.S. Metals & Mining companies: the S&P Metals & Mining Select Industry Index typically posted higher risk-adjusted performance than the broader S&P Total Market Index (TMI) Energy and S&P TMI Materials sector indices. Additionally, the S&P Metals & Mining Select Industry Index typically posted higher risk-adjusted performance than its float market cap (FMC) weighted counterpart, highlighting the potential benefit of the index’s modified equal weight approach.

Conclusion

The S&P Metals & Mining Select Industry Index has evolved alongside the U.S. metals and mining industry, broadening from a structure once dominated by steel and coal producers to a more diversified mix that includes copper, aluminum, precious metals and diversified mining companies. The index’s historical (risk-adjusted) performance demonstrates the effects of a more targeted focus on U.S. metals and mining companies and incorporating a modified equal weight approach.

1 For more information, please see the S&P Select Industry Indices Methodology.

2 Essential Metal Awakening – Indexology® Blog | S&P Dow Jones Indices

Beyond the Bullion: Market Trends in Global Gold Production – Indexology Blog | S&P Dow Jones Indices

The Race for Critical Materials and the Shift to Security – Indexology Blog | S&P Dow Jones Indices

3 S&P Dow Jones Indices And MSCI Announce Further Revisions To The Global Industry Classification Standard (GICS) Structure In 2016 – Nov. 2, 2015


The posts on this blog are opinions, not advice. Please read our Disclaimers.
Measuring USD Leveraged Loans for the Brazilian Market

Contributor Image
Adrian Roseth

Analyst, Fixed Income Product Management

S&P Dow Jones Indices

The author would like to thank Sofia Lozada for her contributions to this blog.

Introduction: The Challenge

Brazilian institutional investors are increasingly looking beyond domestic markets in search of income. With local yields subject to monetary policy cycles and a concentrated domestic credit universe, global fixed income could offer diversification. Instruments with different risk drivers, such as USD-denominated senior secured loans, could complement a BRL-based fixed income view.

Yet investing abroad introduces a structural challenge: currency risk. For Brazilian market participants, USD-BRL movements can have as much influence on performance as the underlying asset itself. The question is how to reflect the yield characteristics of USD leveraged loans while managing that currency risk.

Why U.S. Leveraged Loans?

U.S. leveraged loans offer floating-rate coupons that reset with short-term U.S. rates, providing income and buffering against duration risk in a way that fixed-rate bonds do not.

Leveraged loans are senior secured instruments, sitting at the top of the borrower’s capital structure and backed by collateral. This gives lenders a priority claim in a restructuring or default scenario—a structurally defensive way to access credit spreads.

The U.S. leveraged loan market is large, liquid and well-established, and it is not replicated in Brazil’s domestic credit universe. Compared with the Brazilian fixed income market, this asset class provides diversification characteristics through different borrowers, different rate dynamics and a source of USD-denominated yield. The S&P USD Select Leveraged Loan BRL Hedge Carry Index measures the performance of the U.S. leveraged loan market through a currency-hedged framework, combining loan weighting with a built-in BRL hedge and BRL cash carry.

Why Currency Matters for Brazilian Investors

For a Brazilian strategy focused on USD-denominated leveraged loans, three forces drive performance: credit performance, coupon income and the USD-BRL exchange rate. Even when underlying loans perform well, currency moves can reshape the outcome once performance is converted back to BRL, making a systematic hedge a more targeted way to reflect the performance of the asset class.

Understanding the Index Construction

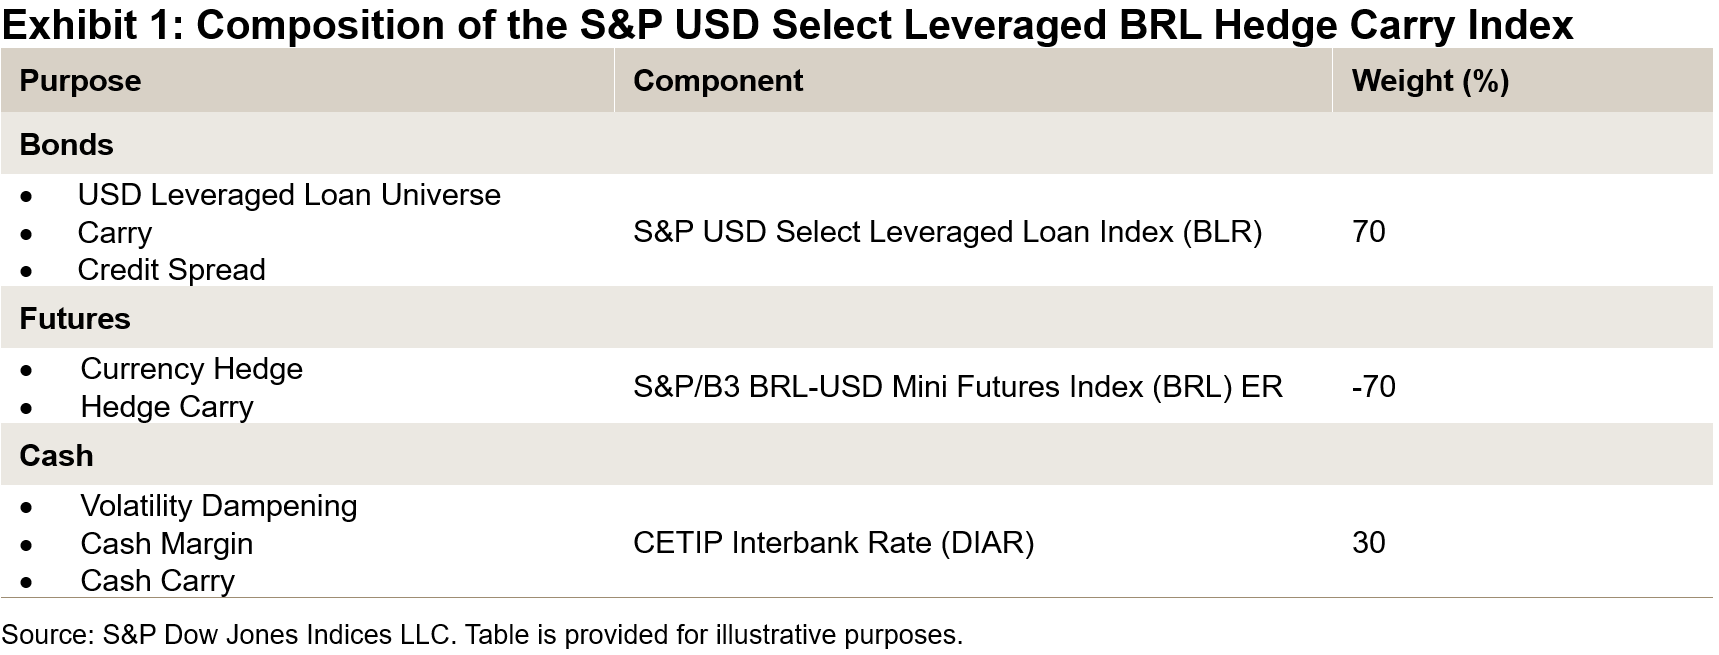
The S&P USD Select Leveraged Loan BRL Hedge Carry Index is built from three components. First, a 70% weight to the S&P USD Select Leveraged Loan Index (BRL) as the underlying benchmark for the U.S. leveraged loan market. Second, a 30% weight in the CETIP Interbank Rate (DIAR) provides a measure of BRL cash carry and serves as collateral support for the futures position. Third, a -70% short position in the S&P/B3 BRL-USD Mini Futures Index (BRL) ER forms the systematic currency hedge.

The hedge is intended to offset the USD-BRL currency risk embedded in the loan weighting. Rather than leaving performance subject to U.S. dollar movements, the short futures position seeks to reduce that unintended risk—with performance in Brazilian real terms reflecting the credit performance and yield of the underlying loans.

The index also incorporates a cash buffer mechanism to cover potential margin calls from the B3 exchange. A rebalance is triggered whenever the cash weight falls below 10% of the index weight, aiming to maintain sufficient liquidity for the futures position at all times. For more information, see the S&P Multi-Asset Indices Methodology.

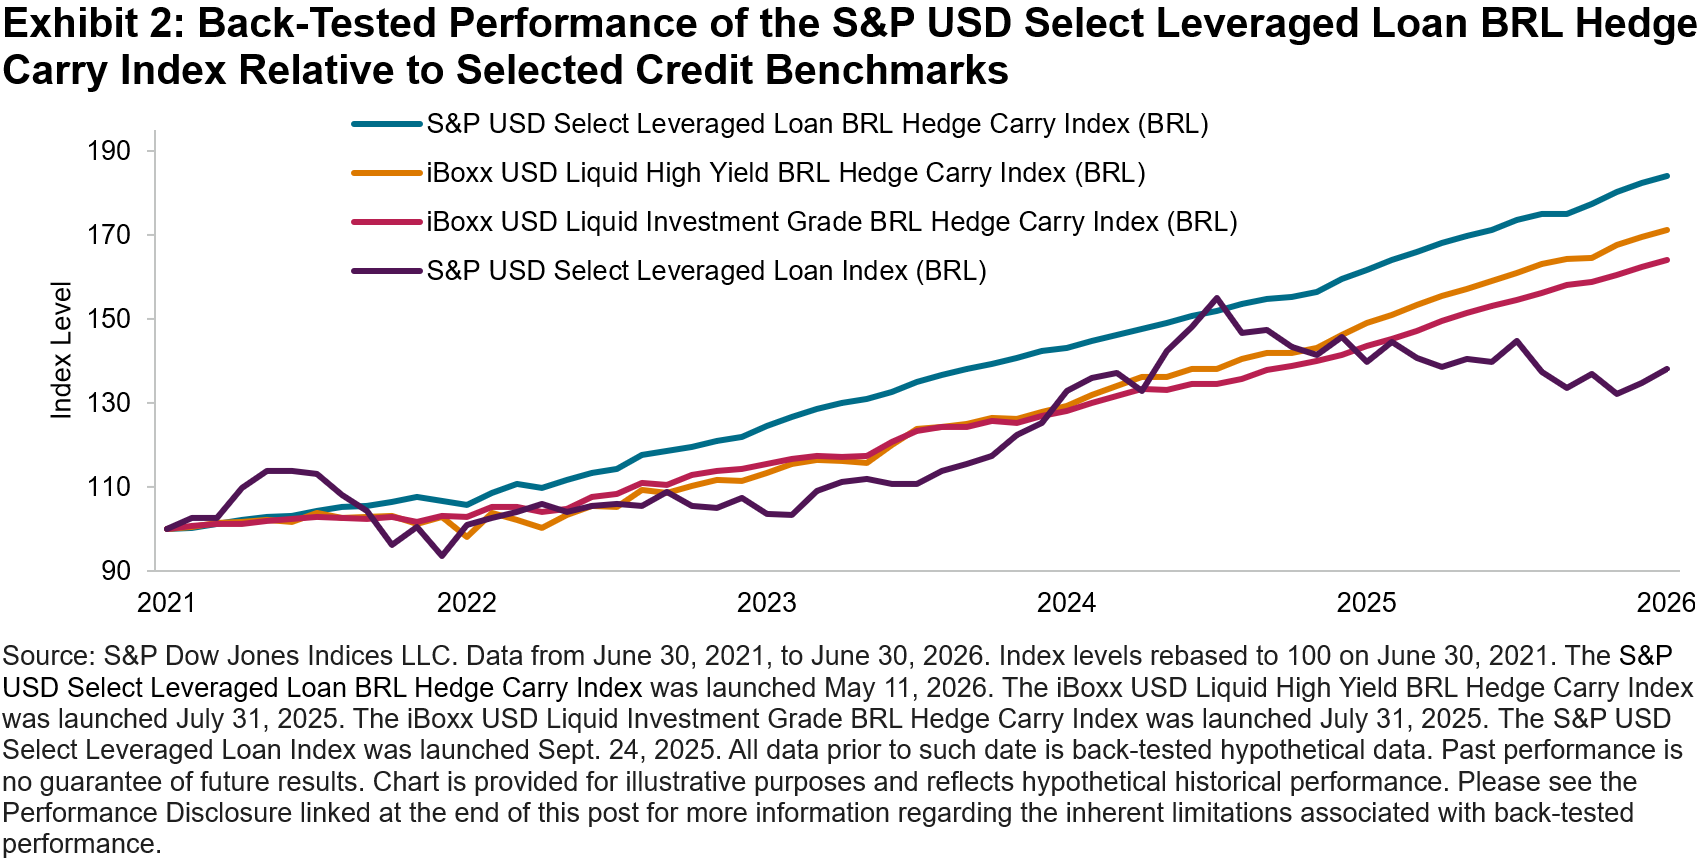
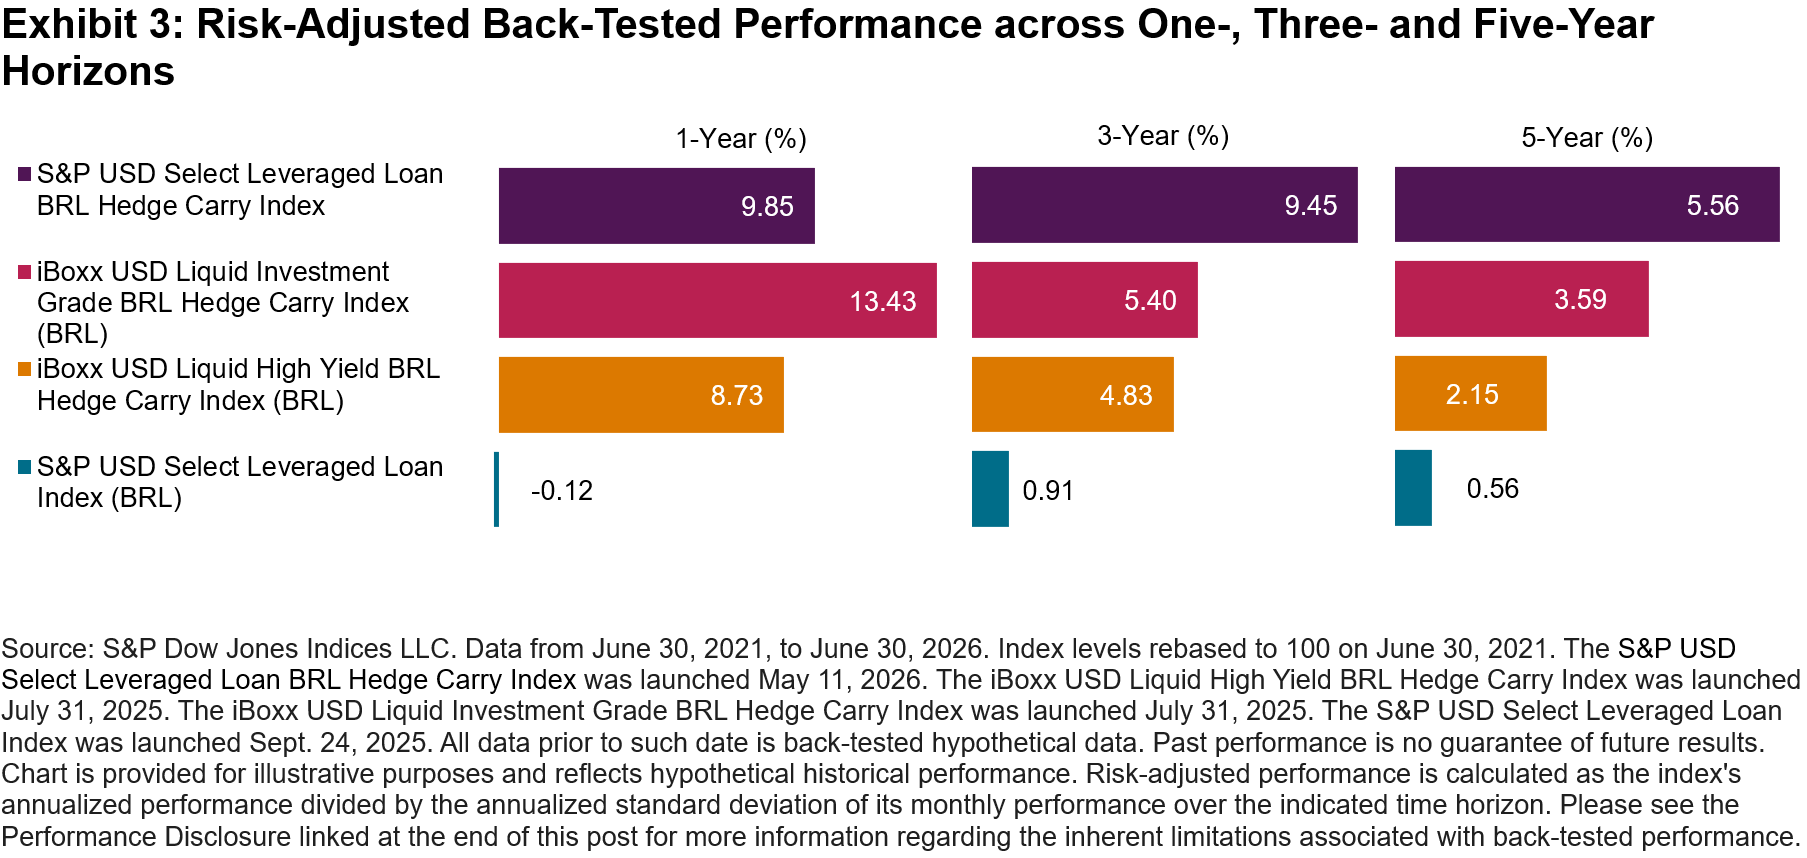
Comparing the S&P USD Select Leveraged Loan BRL Hedge Carry Index with its investment grade and high yield counterparts (the iBoxx USD Liquid Investment Grade BRL Hedge Carry Index and the iBoxx USD Liquid High Yield BRL Hedge Carry Index, respectively), illustrates how different U.S. credit segments have performed within a BRL-hedged framework. As shown in Exhibits 2 and 3, the back-tested analysis indicates that the leveraged loan strategy reported higher cumulative performance than the investment grade and high yield indices over the past five years, as well as higher risk-adjusted performance across the three- and five-year horizons. Over five years, the S&P USD Select Leveraged Loan BRL Hedge Carry Index gained 12.98% on an annualized basis with 2.34% annualized volatility, compared with 11.36% and 5.28% for the high yield index, and 10.43% and 2.90% for the investment grade index, respectively.

The comparison with the unhedged S&P USD Select Leveraged Loan Index (BRL) is equally notable: over five years, the S&P USD Select Leveraged Loan Index (BRL) gained an annualized 6.67% with 11.89% annualized volatility. The one-year comparison further illustrates this observation—the S&P USD Select Leveraged Loan BRL Hedge Carry Index gained 13.80%, while the S&P USD Select Leveraged Loan Index (BRL) posted -1.24%, as appreciation of the Brazilian real weighed on U.S. dollar-denominated performance.

S&P Dow Jones Indices brings extensive experience in index design, transparency and rules-based methodologies to this fixed income space. The S&P USD Select Leveraged Loan BRL Hedge Carry Index reflects S&P DJI’s ability to combine established market benchmarks—the S&P USD Select Leveraged Loan Index and the S&P/B3 BRL-USD Mini Futures Index—into a single index solution. This cross-market index innovation provides a transparent and replicable framework that may be used for benchmarking purposes or as the basis for index-linked products.

The posts on this blog are opinions, not advice. Please read our Disclaimers.