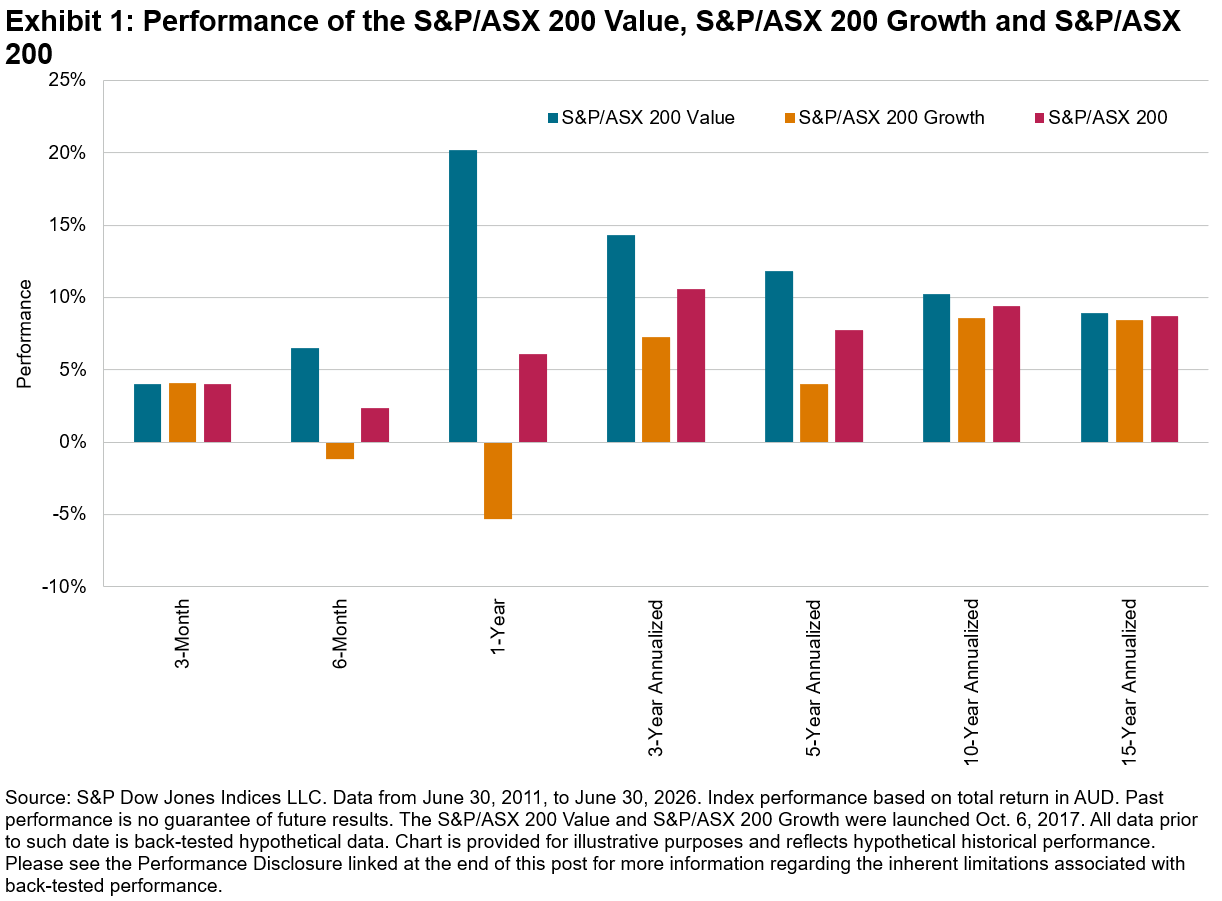
The S&P/ASX 200 Value gained 20.20% over the financial year ending June 30, 2026, outperforming the S&P/ASX 200 by more than 14% and its counterpart, the S&P/ASX 200 Growth, by more than 25%. This represents the index’s strongest one-year relative outperformance in over 16 years.
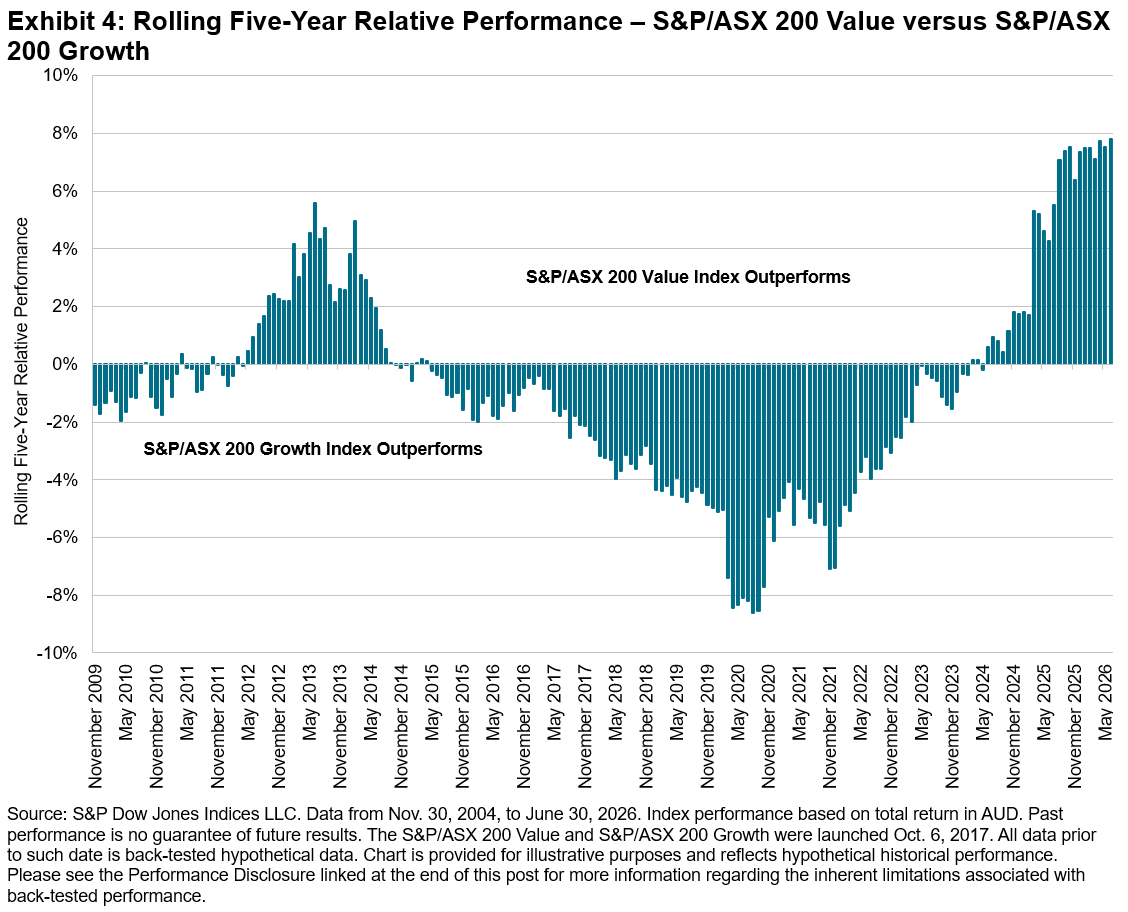
Following a long period in which Australian companies with growth characteristics outperformed in the 2010s, the rotation toward value started during the COVID-19 pandemic and has continued into the current environment of high interest rates, with the S&P ASX 200 Value outperforming the S&P/ASX 200 Growth over all time periods up to 15 years as of June 30, 2026 (see Exhibit 1).
It has been over 90 years since Columbia Business School professors Benjamin Graham and David Dodd published Security Analysis, a work that established the foundational principles of value investing. Both Graham and Dodd, along with numerous other academics and investment practitioners, have since evolved and developed the tenets of value investing. Today, the value versus growth dynamic persists in financial markets and often serves as a lens through which both active and passive investors determine investment allocations.
S&P Dow Jones Indices calculates value and growth barometers across global, regional and single-country indices, including the S&P/ASX 200, as previously referenced. Based on price multiples, earnings and sales growth, companies are ranked by style scores and classified as pure value, pure growth or blend. Please refer to the S&P/ASX Style Indices Methodology for more information.
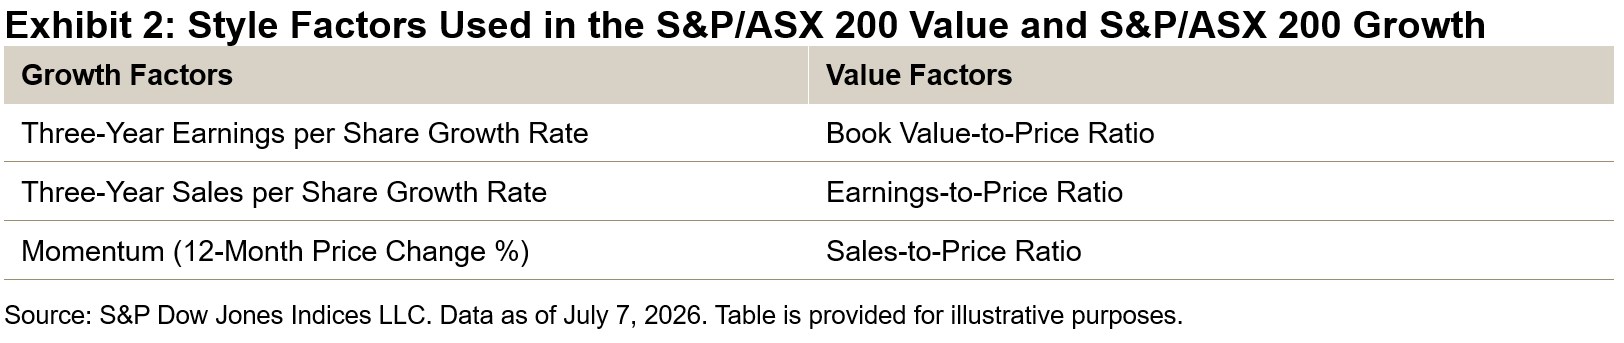
Companies classified as “blend” (those ranked in the median cohort) can have their float-adjusted market capitalization proportionality split across both the value and growth indices. The style bias approach results in two distinctive indices within a given universe—for Australia, these are the S&P/ASX 200 Value and S&P/ASX 200 Growth.
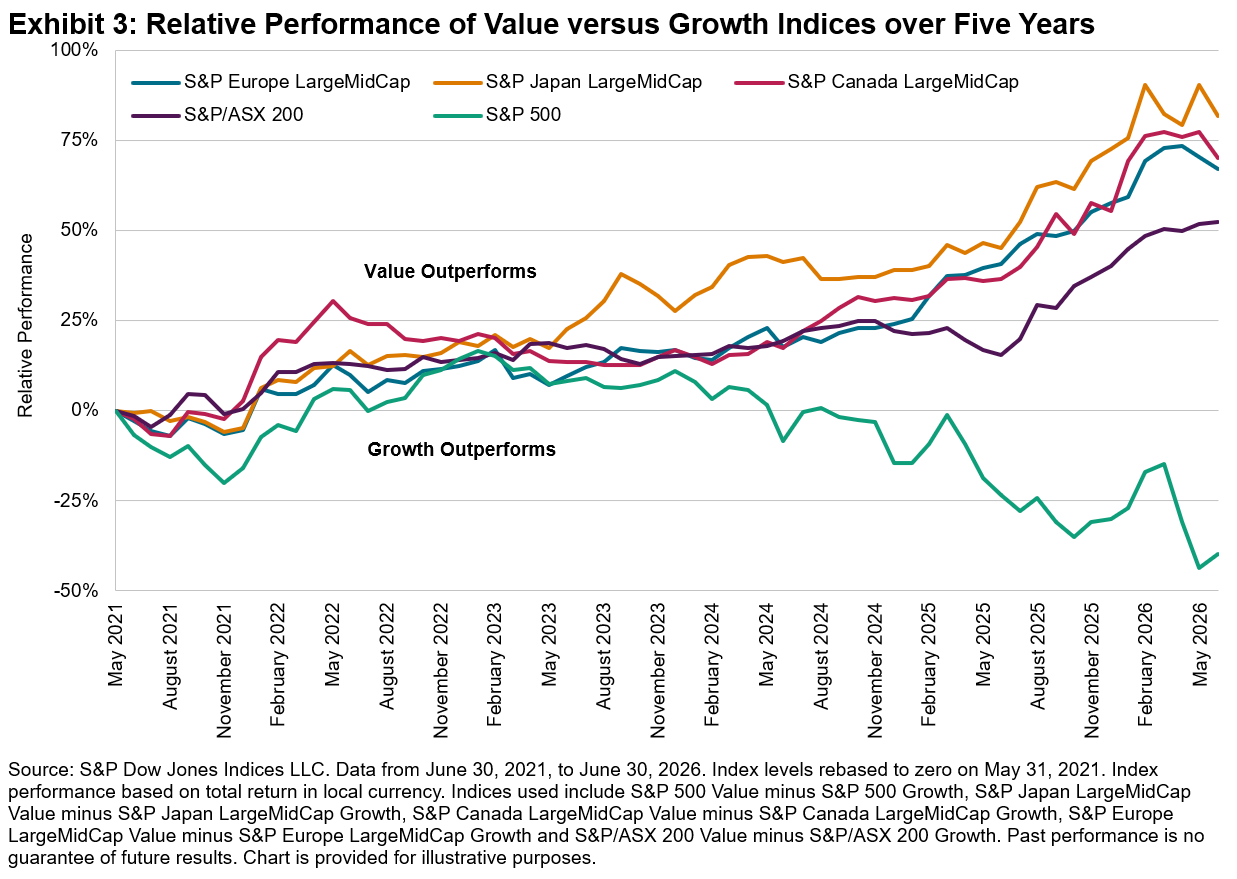
Outside the U.S. market—where performance has been largely driven by growth stocks such as the “Magnificent Seven”—value stocks have outperformed in many other developed markets. Over the past five years, value has meaningfully outpaced growth in Canada, Japan and Europe.
Australia has followed suit, with the S&P/ASX 200 Value outperforming the S&P/ASX 200 Growth by more than 53% on a cumulative basis over the five years ending June 30, 2026. Furthermore, the S&P/ASX 200 Value has consistently outperformed the S&P/ASX 200 Growth by more than 7% per year across rolling five-year periods throughout the 2026 financial year.
Changing Sector Composition of S&P/ASX 200 Style Indices
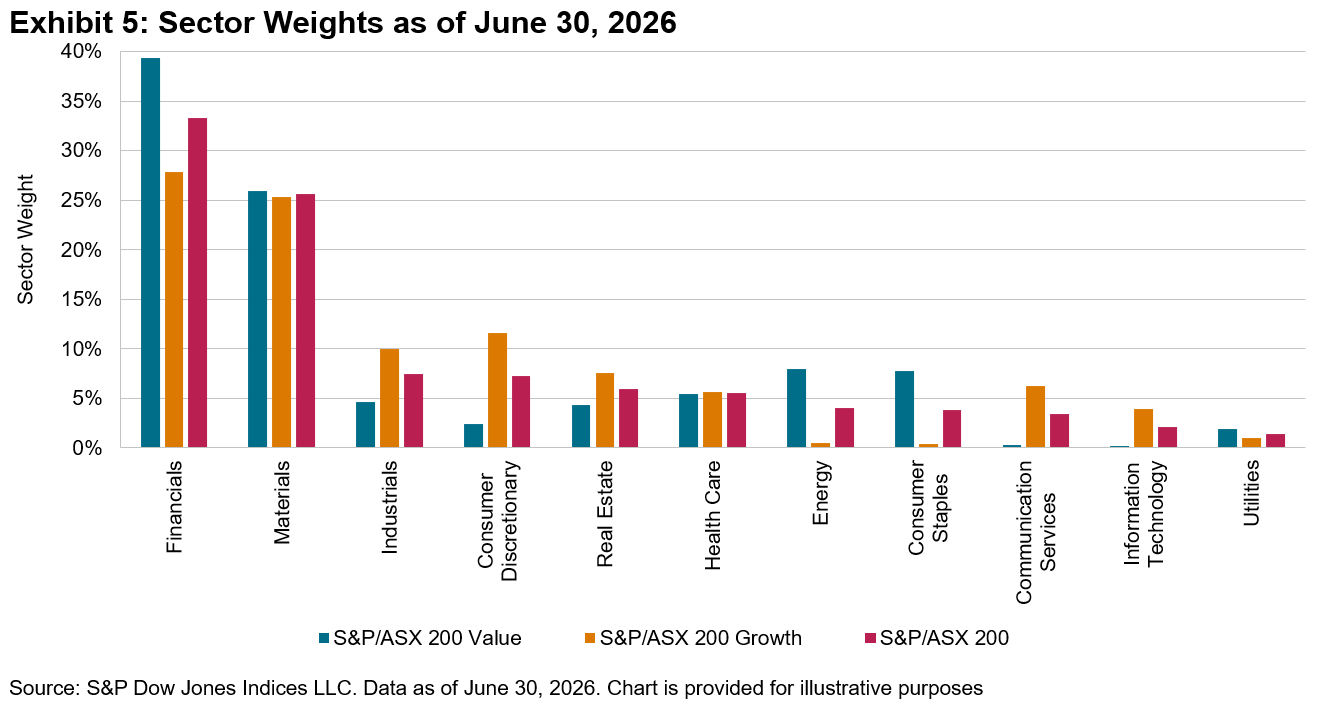
The performance drivers of the S&P/ASX 200 Style Indices extend beyond a simple Financials versus Materials sector dynamic. Value factors such as book-to-price, cash-flow-to-price and sales-to-price ratios are affected by share price movements, which can influence style scores and, in turn, the classification of companies as pure value, pure growth or blend.
As a result, the sector composition of the S&P/ASX 200 Style Indices can shift over time, reflecting changes in share prices as well as the sales and earnings growth of underlying companies.
The rising valuations among the large banks have increased Financials’ representation in the S&P/ASX 200 Growth, which now includes the Commonwealth Bank of Australia.
By contrast, the S&P/ASX 200 Value is currently below its long-term average weight in Financials and above its long-term average weight in Materials, as of June 30, 2026. The weight of Materials has increased by approximately 20% over the five years leading up to June 30, 2026, while Financials’ weight has declined.
Conclusion
Australian market participants have historically been less style-aware in their domestic equity allocations than institutional and international investors. Given their distinct performance characteristics, the S&P/ASX 200 Growth and S&P/ASX 200 Value offer a recognized framework for market participants and academics to assess market dynamics relative to the broad S&P/ASX 200.
This content may be AI-assisted and is composed, reviewed, edited, and approved by S&P Global.
The posts on this blog are opinions, not advice. Please read our Disclaimers.