During recent years, Latin American flagship indices have exhibited strong performance, surpassing the gains of the broader emerging markets segment: in local currency terms, the S&P Latin America BMI has posted 10.0% annualized performance over the past five years, while the S&P Emerging BMI has trailed with 7.7% annualized performance. During this period, all local flagship benchmarks of the region have also outperformed the emerging markets benchmark, including the S&P/BMV IRT for Mexico (up 10.9%), S&P Colombia Select Index for Colombia (up 19.3%), S&P IPSA for Chile (up 19.5%) and S&P Peru Select 20% Capped Index for Peru (up 24.3%). Performance such as this would be expected to be translated into increased liquidity in the local markets. In this blog post we are going to explore how liquidity has behaved in the same period.
Measuring market liquidity can be challenging, as the liquidity of constituents is highly correlated with market capitalization, and some measures such as the average can be influenced by extreme values; an increase in liquidity among the largest constituents can raise the index average and suggest improved liquidity conditions, even as a majority of constituents experience tighter conditions.
To analyze this subject, we use the 12-month median daily value traded (MDVT)1—a measure that is more robust than the average with regard to the presence of extreme values—and analyze its evolution in the previously mentioned flagship indices (see Exhibit 1). For each market, we include both the median and average 12-month MDVT alongside the component with the highest liquidity (represented by the blue dotted line), while the gray shaded area signals the liquidity measure for 80% of the constituents between the 10th and 90th percentiles.
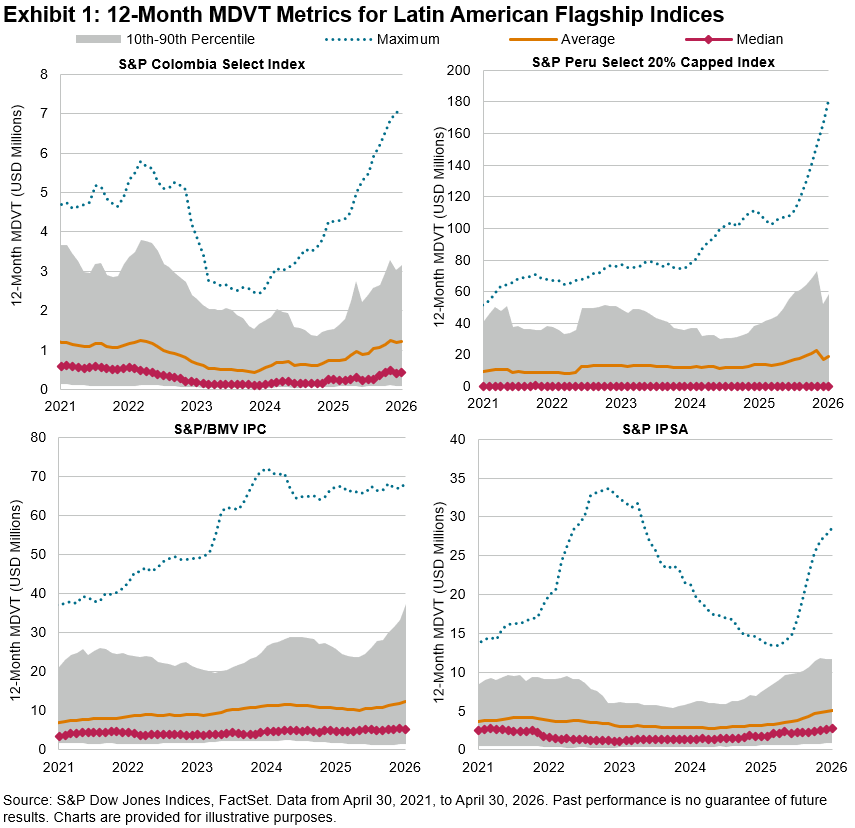
While the average liquidity has risen in Mexico, Peru and Chile, suggesting improved liquidity in these markets, median liquidity has declined in all markets except for Chile. This difference can be explained at least partially by the fact that the most liquid constituent in each index, (shown in blue) is far more liquid than all other constituents—even compared to the second-most liquid name—and this gap has widened over time. This difference is most pronounced in Peru, where Southern Copper Corporation (listed outside of the region) had a 12-month MDVT that is two orders of magnitude above the median.
Liquidity conditions also differ considerably across countries: Mexico showed the highest median liquidity, while Peru lagged the rest of the region, even with the presence of the most liquid constituent in the region.
Conditions in the region remain challenging, with liquidity improvements concentrated in a small number of large-cap companies, while the rest of the market experiences tightening conditions even as regional performance surpasses other emerging markets. Depreciation of exchange rates could influence the measured liquidity, but overall, a differentiated trend toward concentration of liquidity in large names remains visible.
112-Month MDVT is defined as the median of the daily value traded for a company over the past 12 months. The value traded is calculated by multiplying the number of shares traded by each stock’s price.
The posts on this blog are opinions, not advice. Please read our Disclaimers.

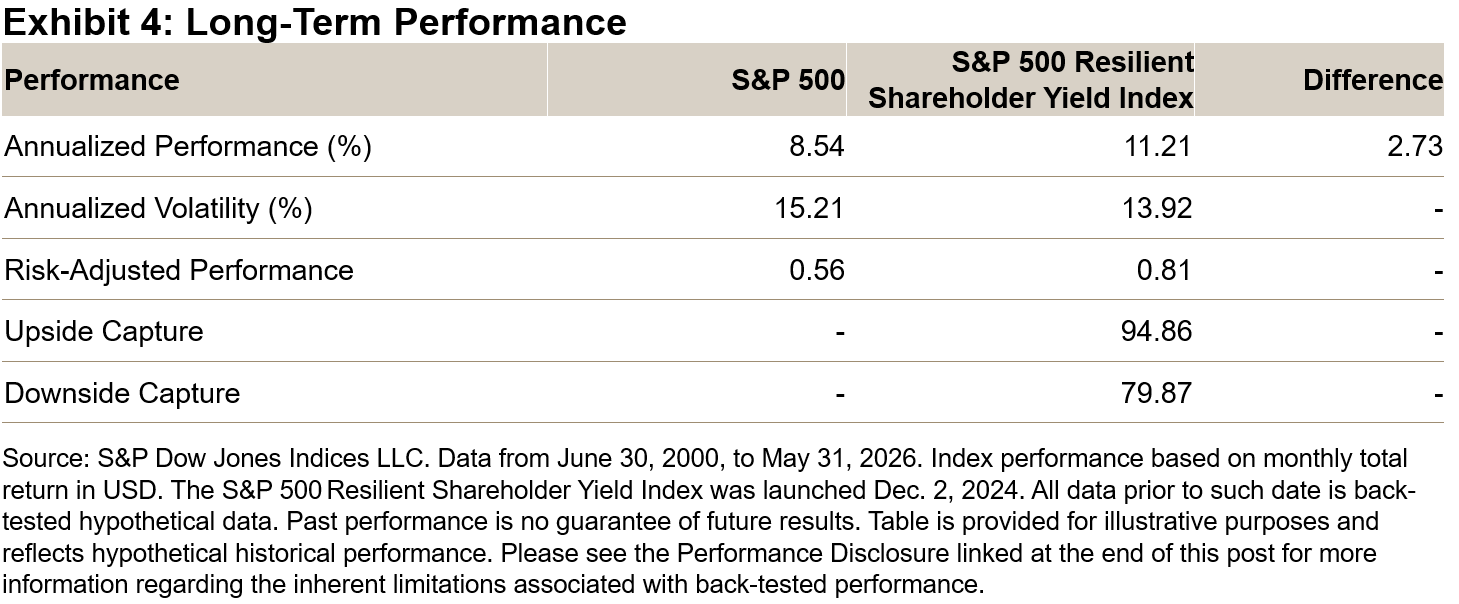
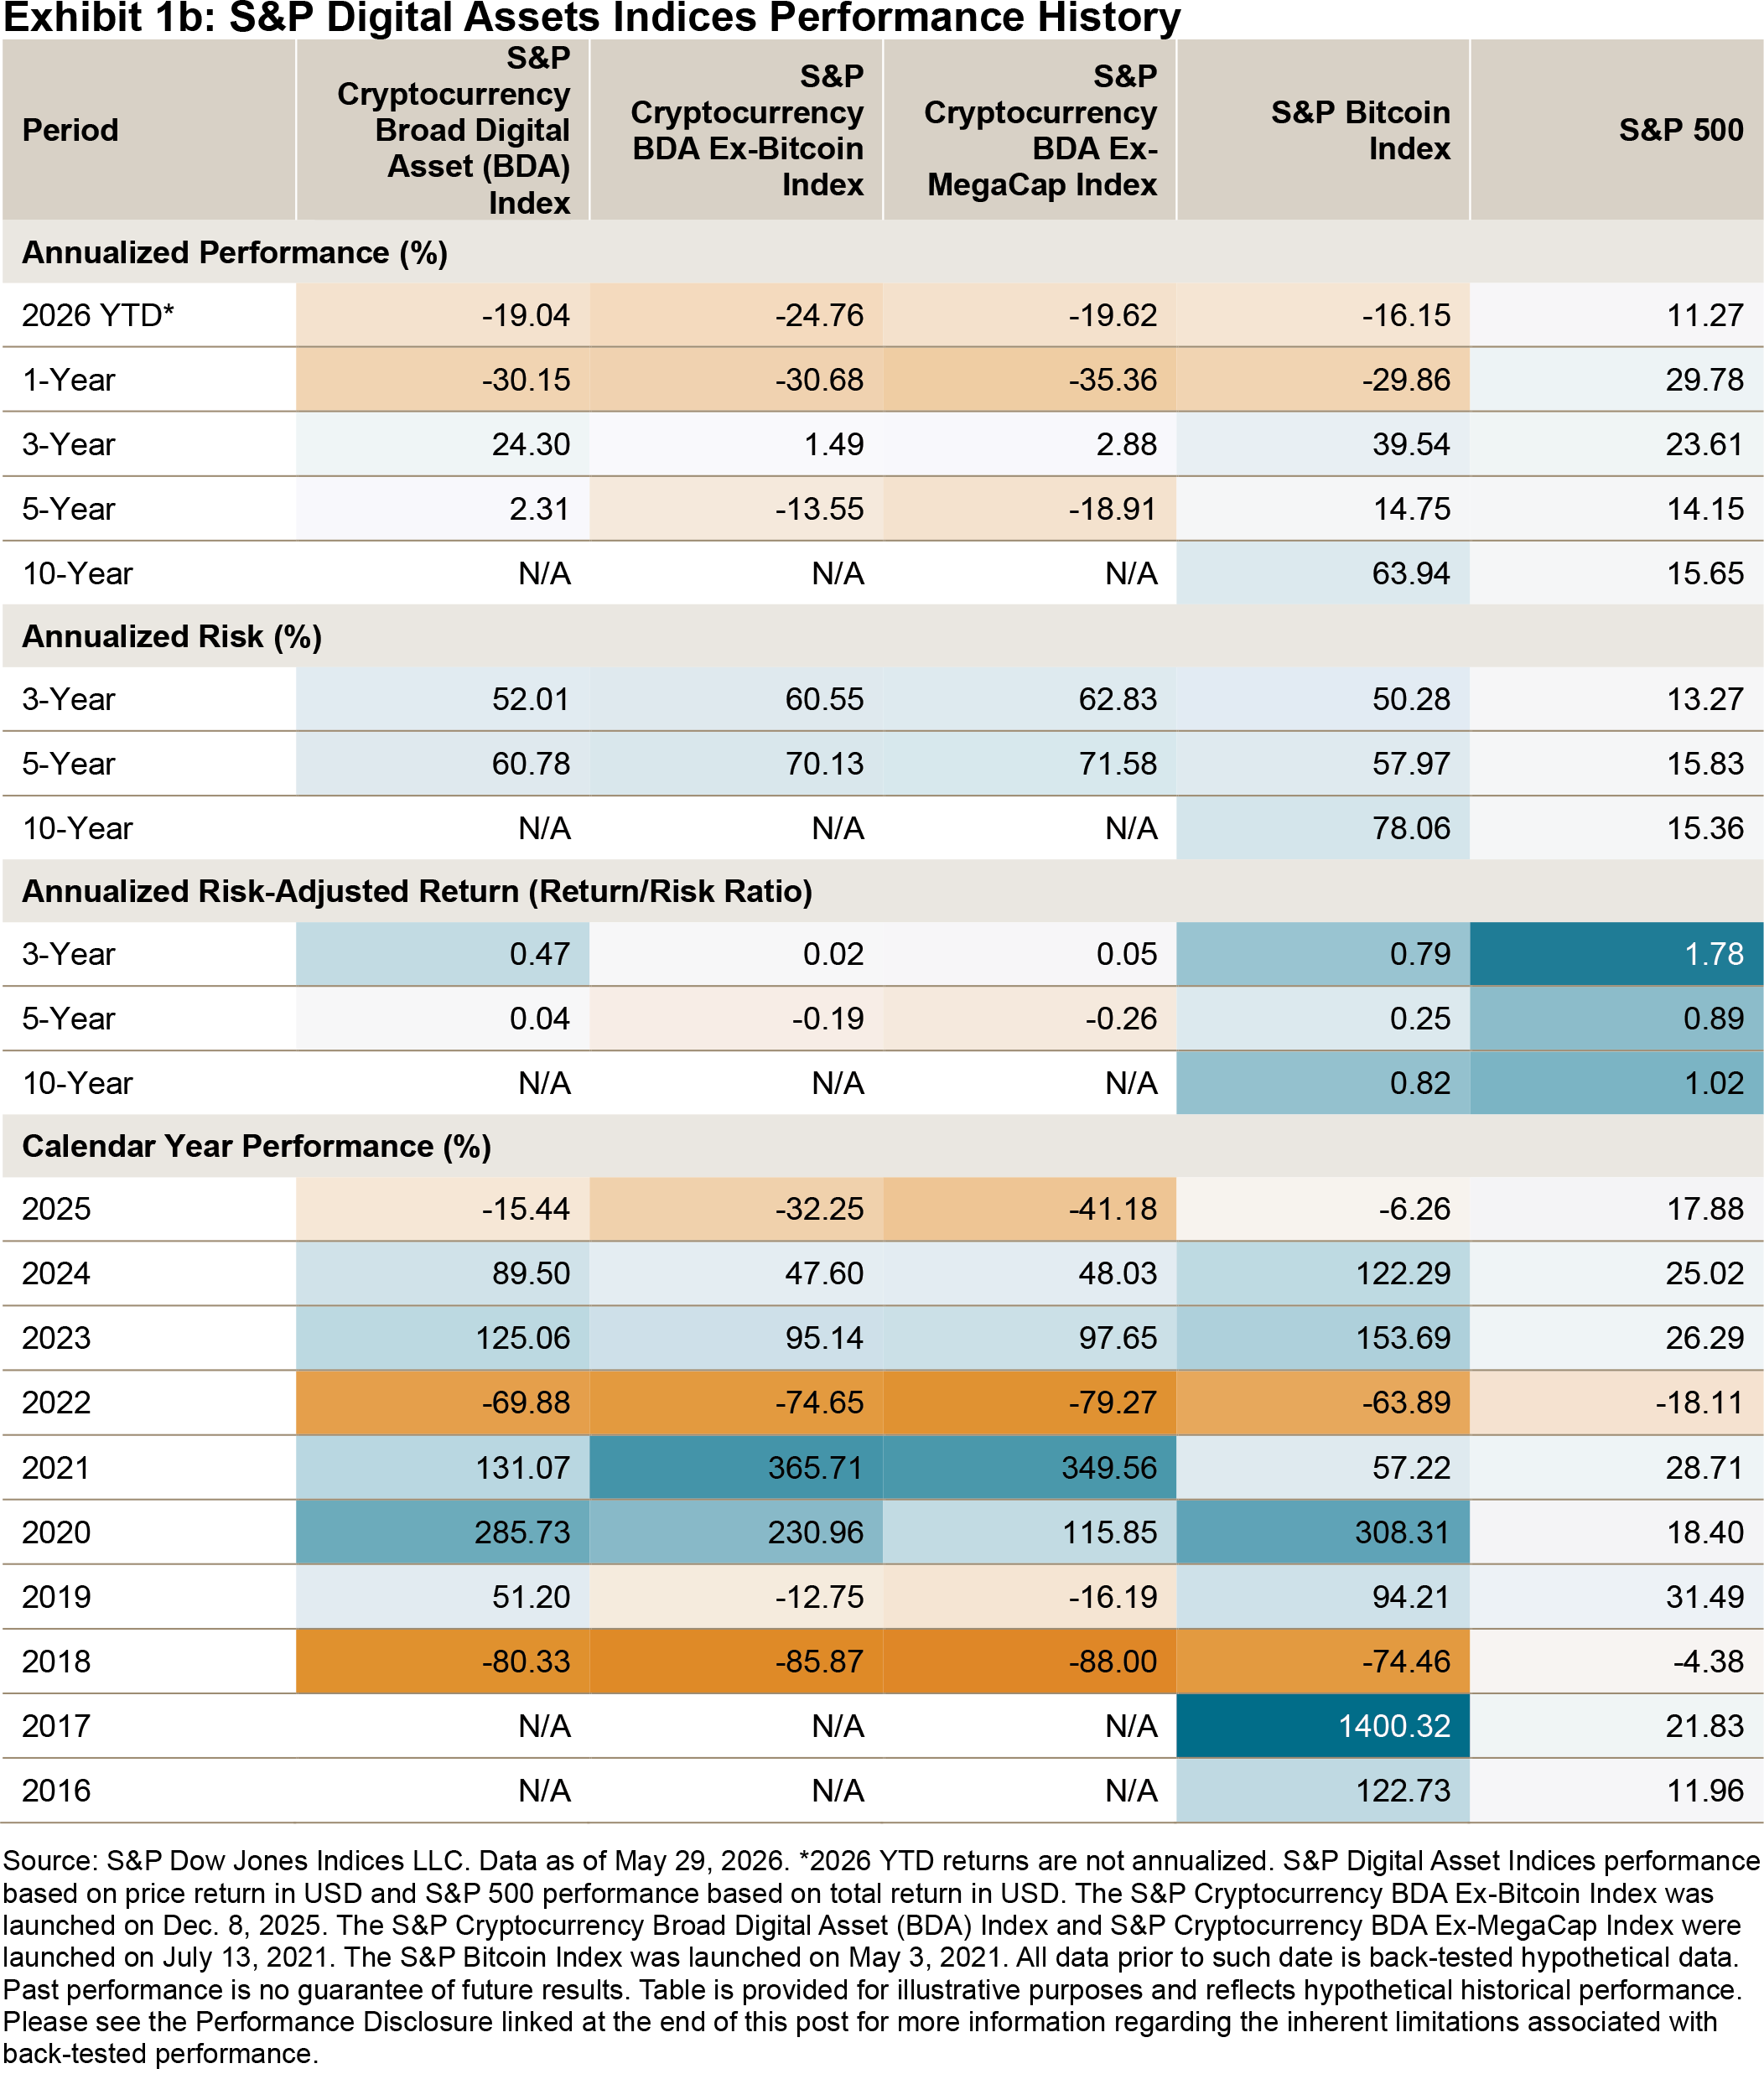
 Long-Term Performance Characteristics