Get Indexology® Blog updates via email.

In This List

The Kingdom's Edge: Finding Asymmetry and Growth in Saudi Equities

The S&P 500 Catholic Values Index: 10 Years and Counting - Part 2

The Significance of Select Sectors to APAC

Using Select Sectors to Evaluate Opportunities and Risks

Indexing Modern Income: Covered Calls Uncovered

The Kingdom's Edge: Finding Asymmetry and Growth in Saudi Equities

Contributor Image
Carlos Mendizabal

Senior Analyst, Global and Thematic Equity Indices Product Management

S&P Dow Jones Indices

In early 2026, equity markets were shaken by the outbreak of war in the Middle East, triggering sharp energy price spikes and renewed inflation concerns. This blog explores how despite the challenging backdrop, Saudi Arabian equities have shown notable resilience, demonstrating their diversification characteristics during periods of heightened downside risk in global markets.

Gauging Saudi Arabian Equities with Caps

The S&P Saudi Arabia BMI 5/10/40 Capped Index tracks the performance of the S&P Saudi Arabia BMI while complying with UCITS 5/10/40 diversification requirements. Under this framework, no single constituent may exceed a 10% weight, and constituents with weights above 5% may not collectively exceed 40%.

Constituent eligibility is determined in accordance with the S&P Global BMI methodology and reflects applicable foreign ownership limits. Float adjustment incorporates both theoretical and practical foreign ownership constraints set by the Saudi Capital Market Authority, which permits Qualified Foreign Investors to own up to 49% of a company’s shares.1

The index is float-adjusted-market-capitalization weighted and rebalanced quarterly, with daily monitoring to trigger contingent intra-quarter rebalancing if concentration thresholds are breached.

Measuring Saudi Equities beyond the Barrel

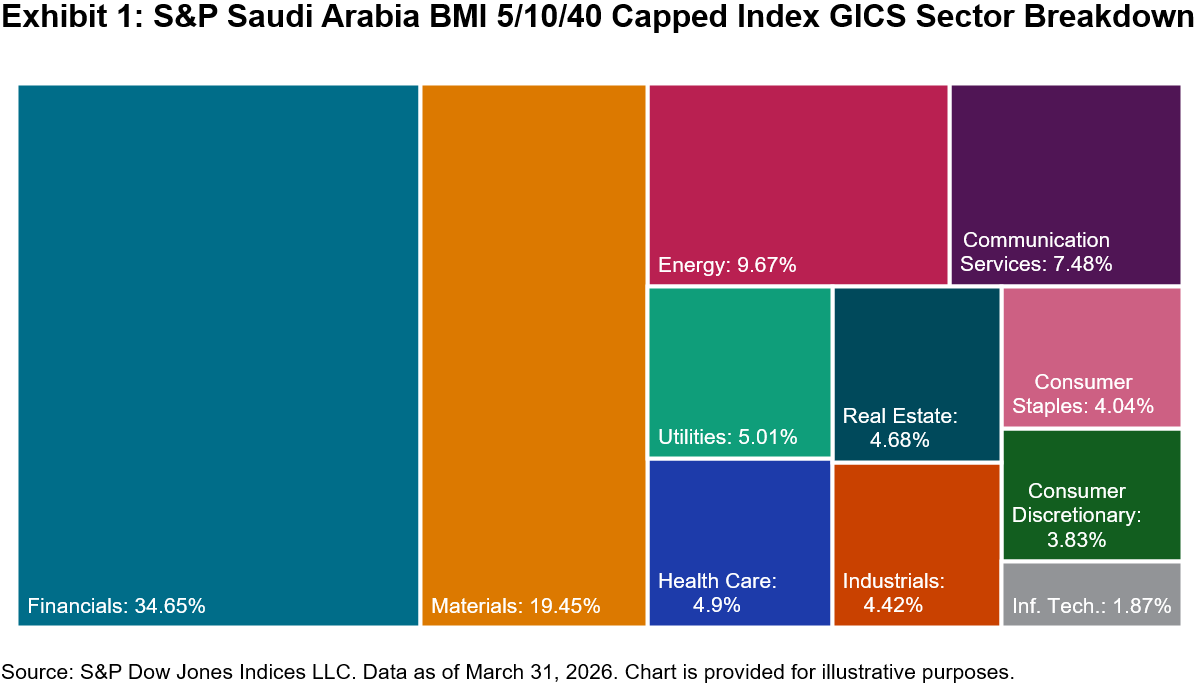
The S&P Saudi Arabia BMI 5/10/40 Capped Index offers a unique sector composition. The index shows that the country’s market is dominated by Financials (35%), reflecting the scale and profitability of domestic banks that benefit from strong balance sheets, rising credit penetration and sustained public- and private-sector investment activity. Materials (19%) and Energy (10%) form the next largest weights, highlighting the importance of petrochemicals and the energy-related value chain.

In contrast to many global and emerging market benchmarks that are heavily skewed toward growth and technology, the S&P Saudi Arabia BMI 5/10/40 Capped Index has minimal weight in Information Technology (2%), as well as comparatively lower weights in Consumer Discretionary, Consumer Staples (4% each) and Industrials (4%). This sector mix has resulted in a market that is less sensitive to global growth cycles, valuations and technology-led sentiment shifts.

Underpinning this equity makeup is the country’s Vision 20302 initiative, which is a highly ambitious strategic framework designed to diversify the economy away from oil. Key objectives include expanding tourism and entertainment, advancing high-tech industries and promoting sustainability through large-scale investments. Together, these initiatives are reshaping economic activity and broadening the sources of long-term growth.

A Shelter in the Time of Storm

As shown in Exhibit 2, the S&P Saudi Arabia BMI 5/10/40 Capped Index has maintained a low correlation to global and regional benchmarks over time, making it a source of diversification.

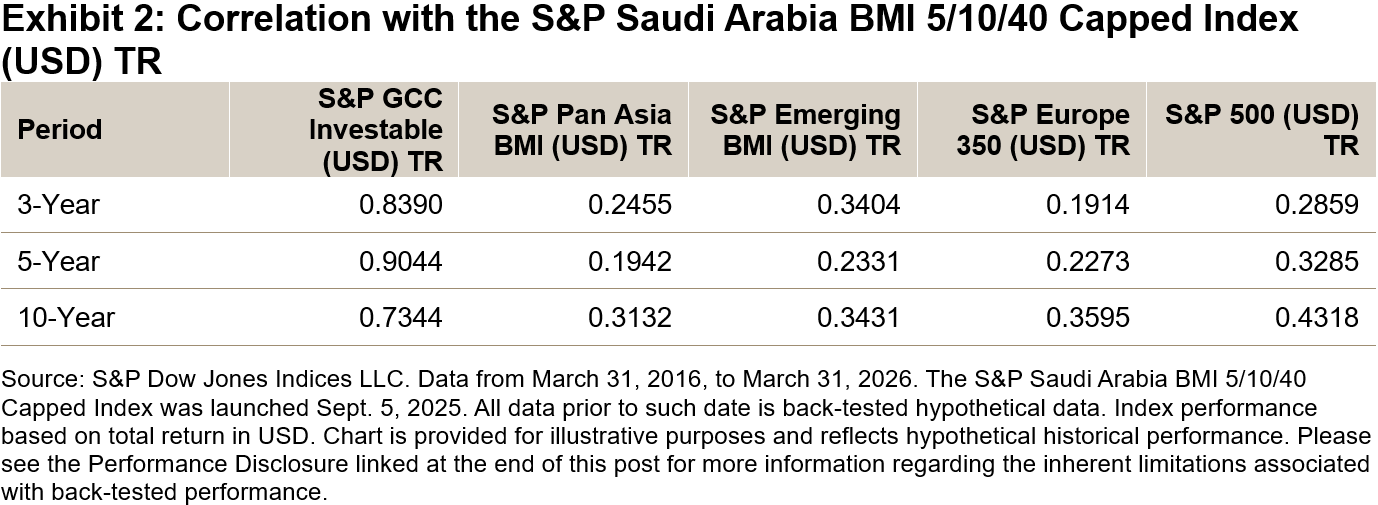
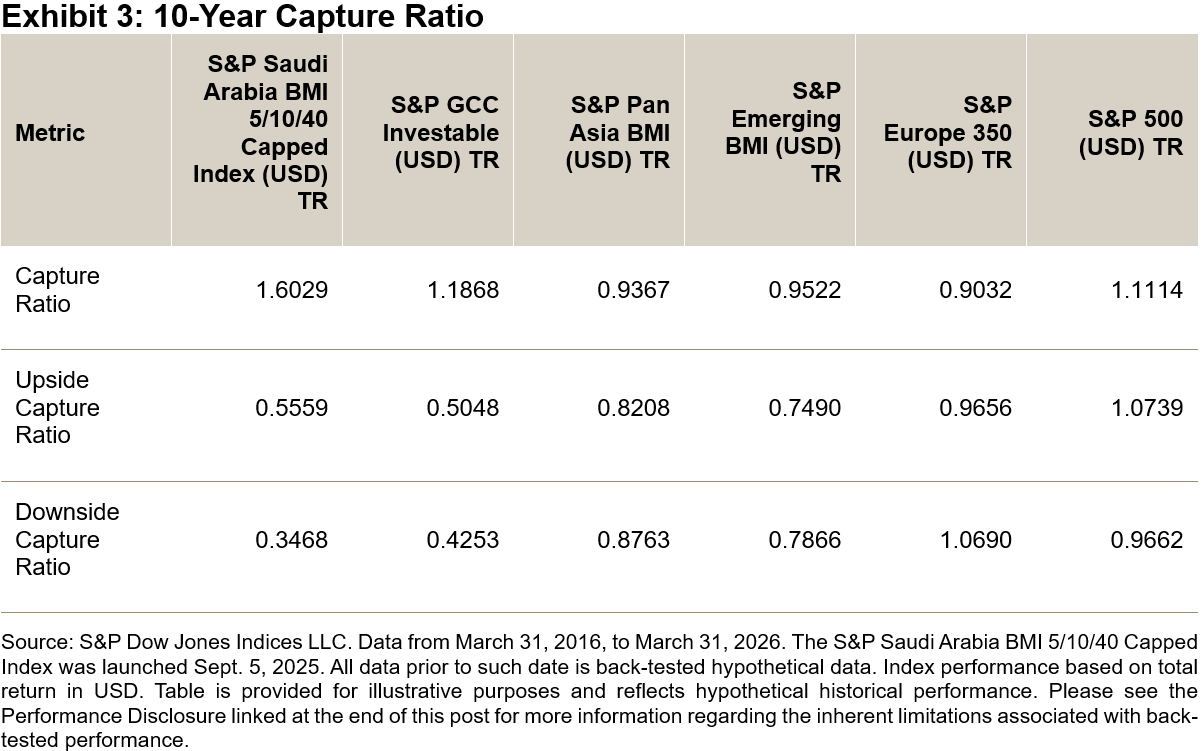
This diversification is driven by the market’s weight in real assets and domestic demand, which reduces its sensitivity to global economic growth and technology cycles. Importantly, Saudi equities have also demonstrated an asymmetric performance profile. Historically, the index participated in around 56% of global equity upside while limiting downside participation to just 35% versus the S&P Global BMI.

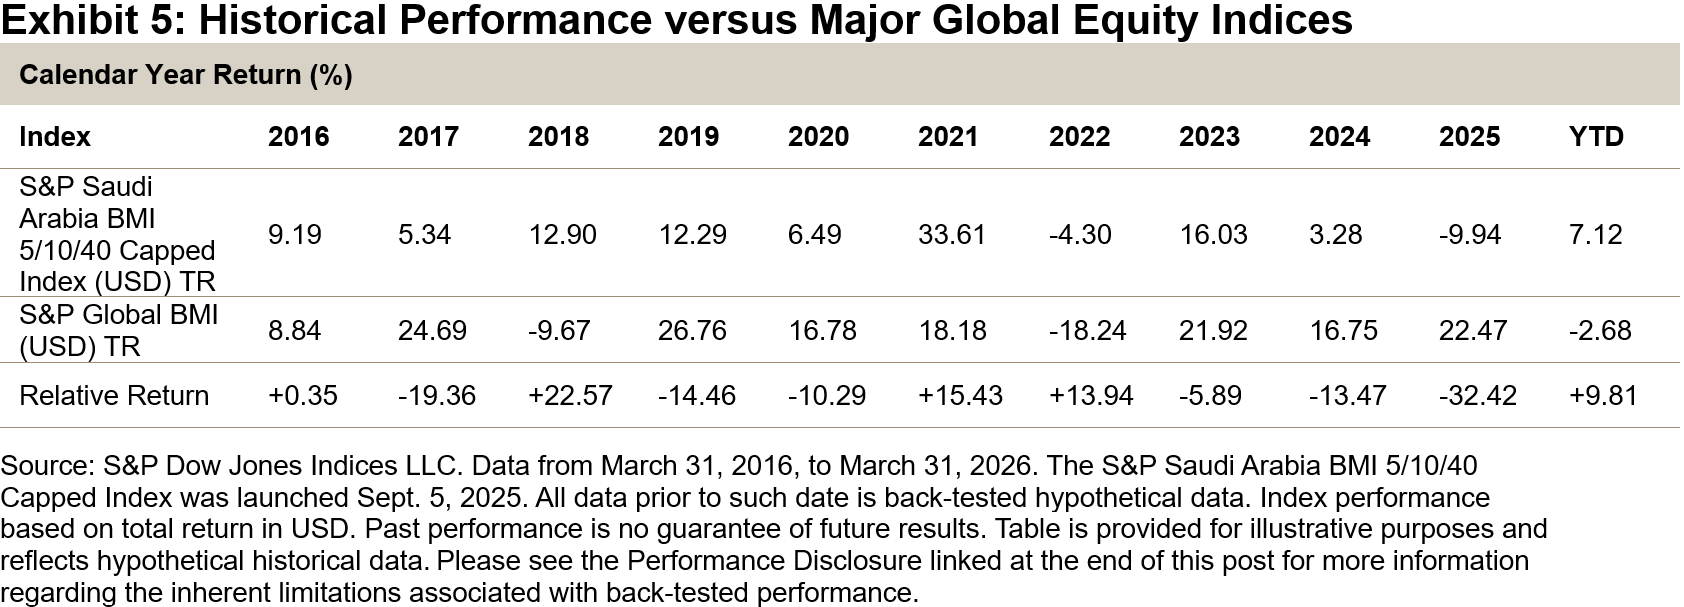
These attributes were evident in recent performance. In the first quarter of 2026, the S&P Saudi Arabia BMI 5/10/40 Capped Index had a 7.1% total return in USD, outperforming most major developed and emerging market benchmarks, which were negative.

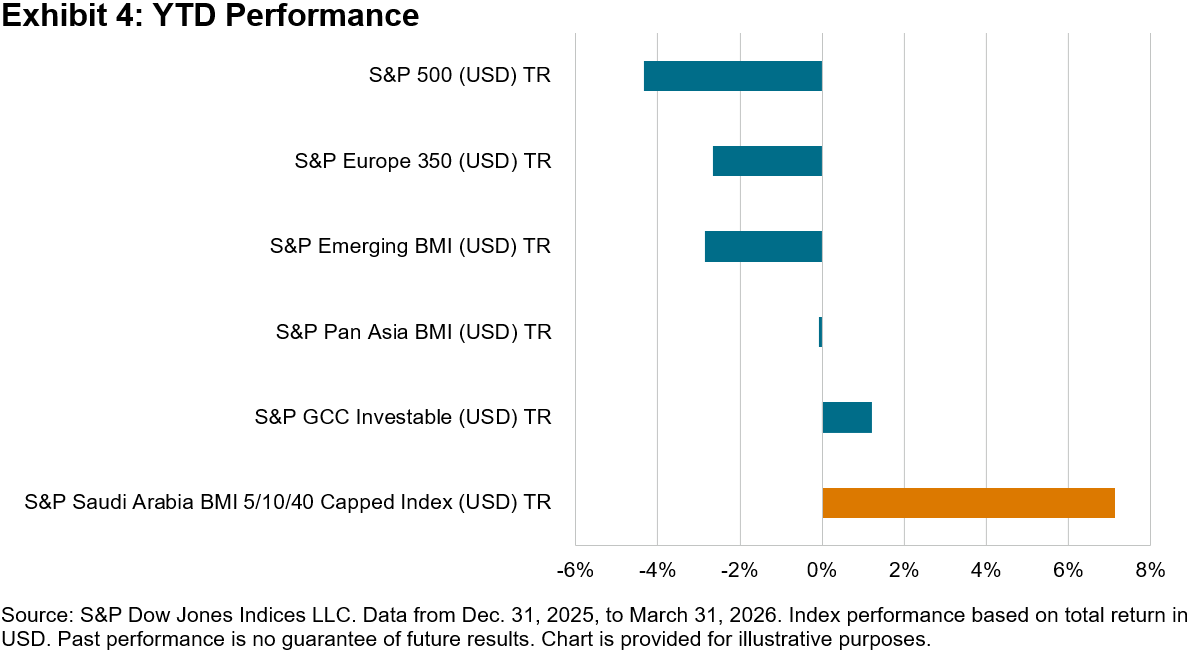
The index’s outperformance was supported by rising energy prices, resilient fiscal conditions and limited sensitivity to lagging technology stocks. Similar resilience was observed during periods of global equity stress in 2018 and 2022.

Rounding Up

The S&P Saudi Arabia BMI 5/10/40 Capped Index tracks a market with distinctive attributes. With the backdrop of the ambitious Vision 2030 framework underpinning the long-term market landscape, the index’s unique sector profile provides diversification potential and has historically offered downside mitigation.

1 For a detailed description of the index construction framework, please refer to the S&P Pan Arab Index Methodology. In addition, S&P Dow Jones Indices maintains multiple Saudi Arabia index variants designed to meet the needs of different investor segments, including domestic, Gulf Cooperation Council‑regional and international investors.

2 vision2030.gov.sa

The posts on this blog are opinions, not advice. Please read our Disclaimers.

The S&P 500 Catholic Values Index: 10 Years and Counting - Part 2

Contributor Image
Maria Sanchez

Director, Sustainability Index Product Management, U.S. Equity Indices

S&P Dow Jones Indices

The S&P 500® Catholic Values Index has a decade-long track record that highlights the historical effectiveness of its sector-neutral approach to values-based indexing.

An important feature of the S&P Catholic Values Indices Methodology is its sector weight redistribution approach. Rather than allowing exclusions to create potential sector tilts, the weights of excluded companies are proportionally distributed within their respective GICS® sectors, helping the index maintain its broad market representation. This approach leads to sector neutrality, which is evident in Exhibit 1.

This sector approach has helped the index maintain low tracking error versus the S&P 500 historically, which may be a relevant consideration when evaluating values-based mandates. Over the past decade, the S&P 500 Catholic Values Index has maintained a tracking error within 1.4% of the S&P 500 while excluding an average of 52 companies. During the latest rebalance, effective after the close of March 20, 2026, 55 companies were excluded, representing 12.70% of the S&P 500 as of the reference date. This represents approximately 87% market-cap coverage of the S&P 500.

The S&P 500 Catholic Values Index has demonstrated risk-adjusted performance comparable to that of the S&P 500 since the index was launched, with annualized performance of 0.86% versus 0.82% for the S&P 500. The historical comparison of the index’s characteristics demonstrates its consistency compared with the benchmark.

The S&P 500 Catholic Values Index’s decade of performance history demonstrates that values-based indices may not mean compromised performance relative to the benchmark. As a result, the S&P 500 Catholic Values Index may serve as a relevant benchmark for those seeking to align religious values with passive investing strategies.

The posts on this blog are opinions, not advice. Please read our Disclaimers.

The Significance of Select Sectors to APAC

Contributor Image
Liam Flaherty

Senior Analyst, Index Investment Strategy

S&P Dow Jones Indices

As investors across the globe have wrestled with the impact of AI on the U.S. tech sector, valuation concerns, inflation jitters and more, U.S. markets have underperformed their Pan Asian peers. The S&P 500® has trailed the S&P Pan Asia BMI by 8% YTD,1 however the tide may be turning. Thanks to optimism surrounding easing geopolitical concerns, The 500® notched three consecutive record highs on April 15-17, 2026.

Notwithstanding recent market gyrations, U.S. equities have outperformed their Pan Asian counterparts over the long term,2 with the S&P 500 outperforming the S&P Pan Asia BMI by a cumulative 360% since 2000.

Considering that U.S.-domiciled stocks accounted for a majority of the market cap in 10 of the 11 sectors in the S&P Global BMI as of year-end 2024,3 adopting a sectoral perspective4 can be helpful to understand the sources of U.S. equity outperformance compared with equities in Pan Asia. Exhibit 2 shows that much of this outperformance can be attributed to within-sector stock selection, particularly in the Consumer Discretionary and Communication Services sectors, which house many of the Big Tech names that have dramatically outperformed in recent years.

On a more granular level, Exhibit 3 compares the performance of S&P Pan Asia BMI sectors versus the Select Sector Indices, which track the performance of S&P 500 sectors while capping the weight of individual stocks. The exhibit shows that 9 of the 11 Select Sector Indices outperformed S&P Pan Asia BMI sectors and 8 of the 11 Select Sector Indices outperformed the S&P Pan Asia BMI overall. Outperformance was led by the Communication Services and Consumer Discretionary sectors, consistent with the results observed in Exhibit 2.

In addition to outperformance from stock selection within sectors, the attribution in Exhibit 2 shows that the U.S. also benefited from selection across sectors, particularly in Information Technology, which contributed more than one-fifth of U.S. outperformance relative to Pan Asia. Exhibit 4 compares the sector weights of the S&P 500 and the S&P Pan Asia BMI. The U.S. had a greater weight in the Information Technology sector, while S&P Pan Asia had greater weights in Industrials and Financials.

The Select Sector Indices can provide APAC investors with a framework for analyzing U.S. sector-level performance, and provide insights into sectors that include some of the largest companies in the world.

1 As of April 15, 2026.

2 Pathak, Amit. “Why Does The S&P 500 Matter to APAC?” S&P Dow Jones Indices LLC. April 25, 2025.

3 Weng, Fei. “U.S. Sector Relevance to China.” S&P Dow Jones Indices LLC. March 6, 2024.

4 Flaherty, Liam. “Stocks, Sectors and Success?” S&P Dow Jones Indices LLC. Feb. 3, 2026.


The posts on this blog are opinions, not advice. Please read our Disclaimers.

Using Select Sectors to Evaluate Opportunities and Risks

What’s the relevance of U.S. sectors globally in the current landscape? Join S&P DJI’s Hamish Preston and State Street Investment Management’s Matt Bartolini as they explore the Select Sector Indices and how they are helping market participants evaluate and express sector views across evolving market conditions. 

The posts on this blog are opinions, not advice. Please read our Disclaimers.

Indexing Modern Income: Covered Calls Uncovered

Contributor Image
Sue Lee

APAC Head of Index Investment Strategy

S&P Dow Jones Indices

Capital markets offer several primary sources of income to investors, including money market interest, bond coupons and stock dividends. Alternative sources of income abound and, most recently, innovation within the exchange-traded fund (ETF) industry has introduced options-based income strategies to a wider range of market participants.

In the U.S., investors both large and small have long used options markets to generate income, either by trading options directly or indirectly through structured products.1 In more recent years, options-based ETFs have also found popularity, as a range of strategies collectively known as “covered call” (or “buy-write”) strategies are increasingly used to generate income, dampen volatility and enhance risk-adjusted performance in certain market regimes. So, how do they work, and what is their role in generating income?

What Does a Covered Call Really Do?

A covered call strategy combines:

  • An investment in an asset (e.g., a portfolio tracking the S&P 500®); and
  • The sale (writing) of a call option on the same (or correlated) asset.

By selling call options, the investor receives an upfront premium, and any amounts owed on the call option (occurring if the underlying asset rises above the strike price) are “covered” by the profits of the first investment. The regular repeat of such sales can provide a relatively steady income stream, with the natural trade-off that the investor will not simultaneously benefit fully from price gains in the asset, since all or a portion of those gains are offset by losses on the sold options.

Simply put, covered call strategies exchange some upside potential for option premium income, narrowing the range of outcomes. This trade-off is illustrated through the monthly performance comparison of the S&P 500 at-the-money monthly covered call strategyas measured by the Cboe S&P 500 BuyWrite Index (BXM)versus the S&P 500 over a 20-year period (see Exhibit 1).2 For example, over the recent six monthly rolls between Sept. 19, 2025, and March 20, 2026, the BXM’s monthly performance ranged between -3.8% to 3.1% compared to the S&P 500’s range between -5.0% and 2.5%, with the former outperforming in five out of six months.

Why Covered Calls?

The appeal of covered calls extends beyond simple income generation and volatility reduction. Option premiums can provide a distinct income stream that is less correlated with traditional sources such as bonds and dividends. Bond income is sensitive to interest rate policy, and dividend income can be reduced during economic downturns (while dividend yields tend to be driven more by price effects).

Option premiums, by contrast, are primarily driven by market volatility.3 When markets sell off, volatility typically rises, leading to higher option premiums. This was evident during the 2008 Global Financial Crisis and the 2020 COVID-19 pandemic (periods shaded in blue in Exhibit 2), when interest rates fell toward zero but increased volatility boosted option income. Notably, option premiums have also remained relatively elevated in recent years, even as dividend yields declined to decade lows (the period shaded in red in Exhibit 2).

Covered calls have historically helped support portfolio income when other sources were under pressure, making them a valuable tool for building resilient income.

Design Matters: Variations and Implementation

There are many possible variations of covered call strategies across different maturities and strike prices, and outcomes can vary materially depending on the design of the strategy. The S&P 500’s deep and robust derivatives ecosystem enables effective implementations of various strategies, catering to changing market environments and investor needs. It is important to carefully assess each component of the strategy, for both product issuers and investors, to find the optimal approach that can help achieve desired outcomes.

For a deeper dive into the index-based framework of covered call strategies, see “Defining Paths with Options-Based Index Strategies.”

1   According to SRP, the U.S. structured notes market reached USD 150 billion in 2024, up 46% from the previous year.

2   For details on the index construction, see the BXM index methodology.

3   Options market often exhibits a “volatility premium”—a tendency for implied volatility (the level of volatility reflected in option prices) to exceed the actual volatility that occurs. This phenomenon is largely driven by supply and demand imbalances in the options market (see Defining Paths with Options-Based Index Strategies for more details). Covered call strategies seek to harvest this volatility premium by regularly selling call options, aiming to profit from the persistent gap between market expectations and realized outcomes.

The posts on this blog are opinions, not advice. Please read our Disclaimers.