Get Indexology® Blog updates via email.

In This List

2025: A Market for Stock Pickers in France?

Leveraged Loan Market Snapshot

One to Forget: SPIVA Europe U.K. Equity Active Fund Performance in 2025

Measuring Direct Lending: Building Transparency in Private Credit Markets

Systematic S&P 500 Strategies Targeting Stability and Growth Potential

2025: A Market for Stock Pickers in France?

Contributor Image
Sara Pineros

Quantitative Analyst, Index Investment Strategy

S&P Dow Jones Indices

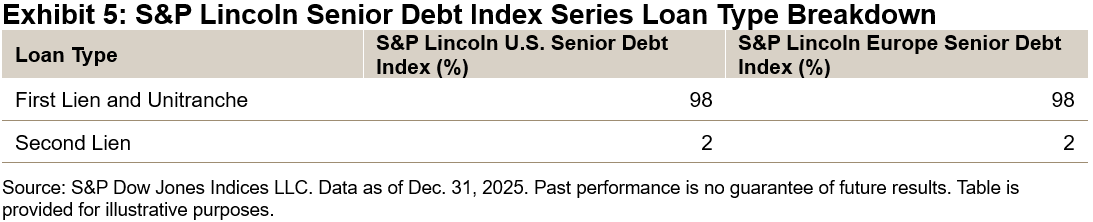
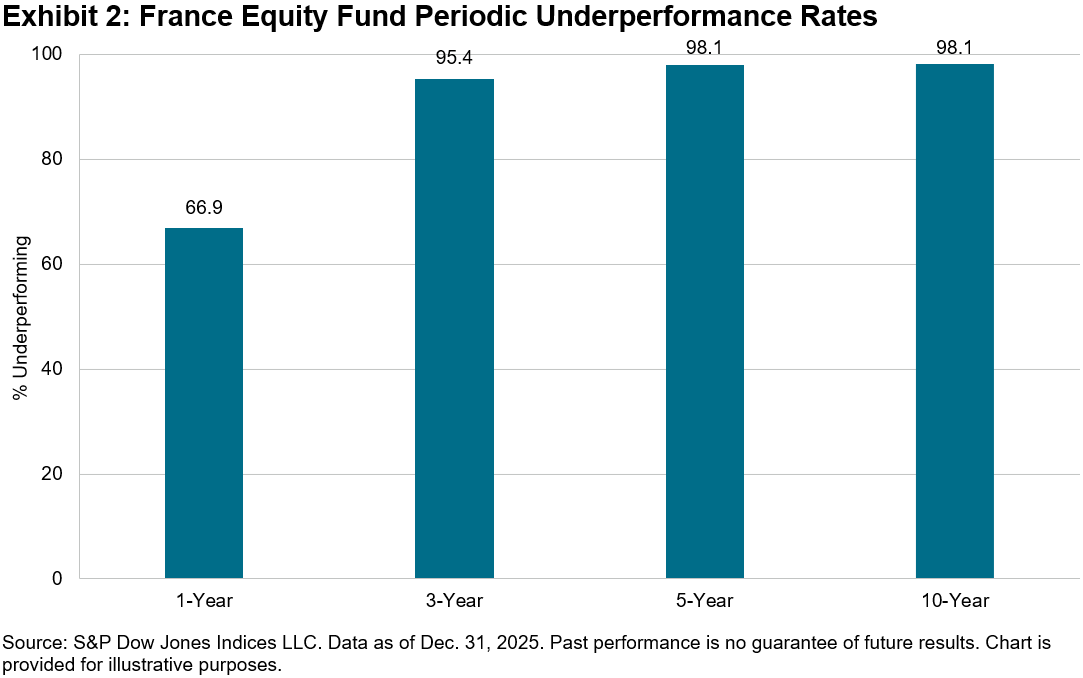
Despite a strong year for global equities in 2025, most active funds in Europe struggled to outperform their benchmarks. According to the latest SPIVA® Europe Year-End 2025 Scorecard, 81.8% of active equity funds lagged their benchmarks over the past year, rising to 97.0% over the 10-year period.1 The France Equity fund category offered a notable exception, with a lower one-year underperformance rate of only 66.9% (see Exhibit 1).

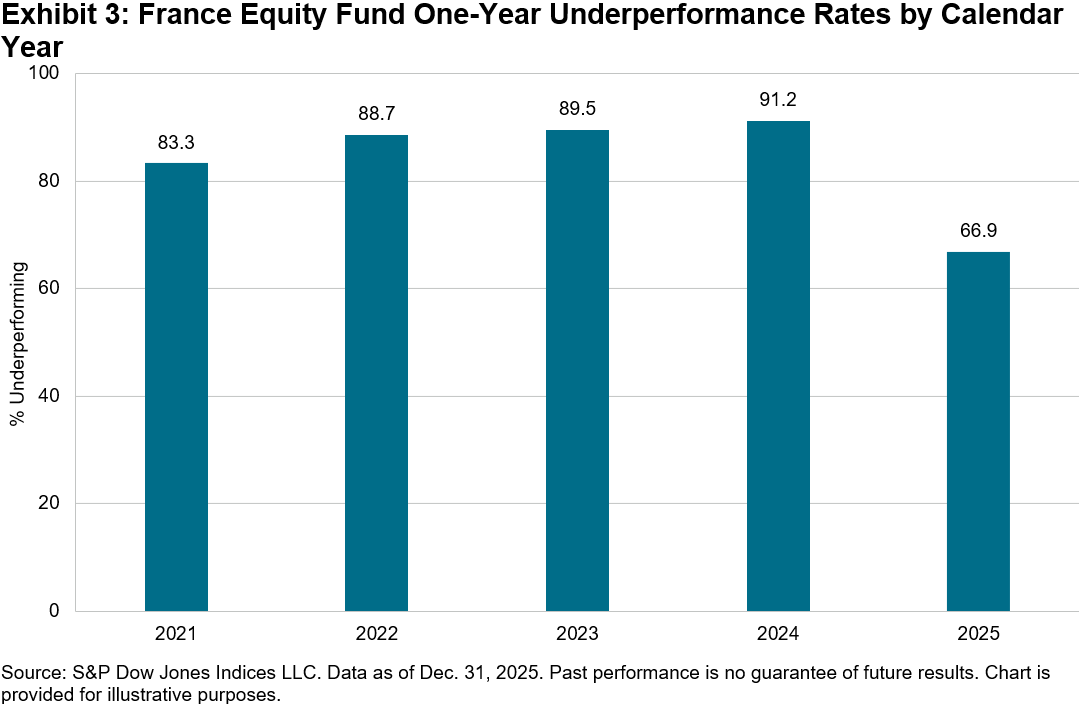
This lower one-year underperformance rate marked a significant improvement compared to recent years. Over the past four years, an average of 88.2% of France Equity funds underperformed on a one-year basis, with the rate declining by almost 20 percentage points in 2025. However, this short-term gain was not sustained; over the 3-, 5- and 10-year periods, the performance of France Equity funds aligned with European averages. Both the longer-term convergence and short-term advance are shown in Exhibits 2 and 3.

To understand why France’s equity market appeared relatively easier for active funds to navigate in 2025, it helps to start with what performance the benchmark delivered and what its underlying drivers were. In 2025, the flagship S&P France BMI increased by 14.4%. In comparison, the S&P 500® rose 3.9%, while the S&P Europe 350® posted its strongest performance in four years, with a 20.5% gain. The more geographically focused S&P Eurozone BMI outperformed them all, climbing 25.0%.

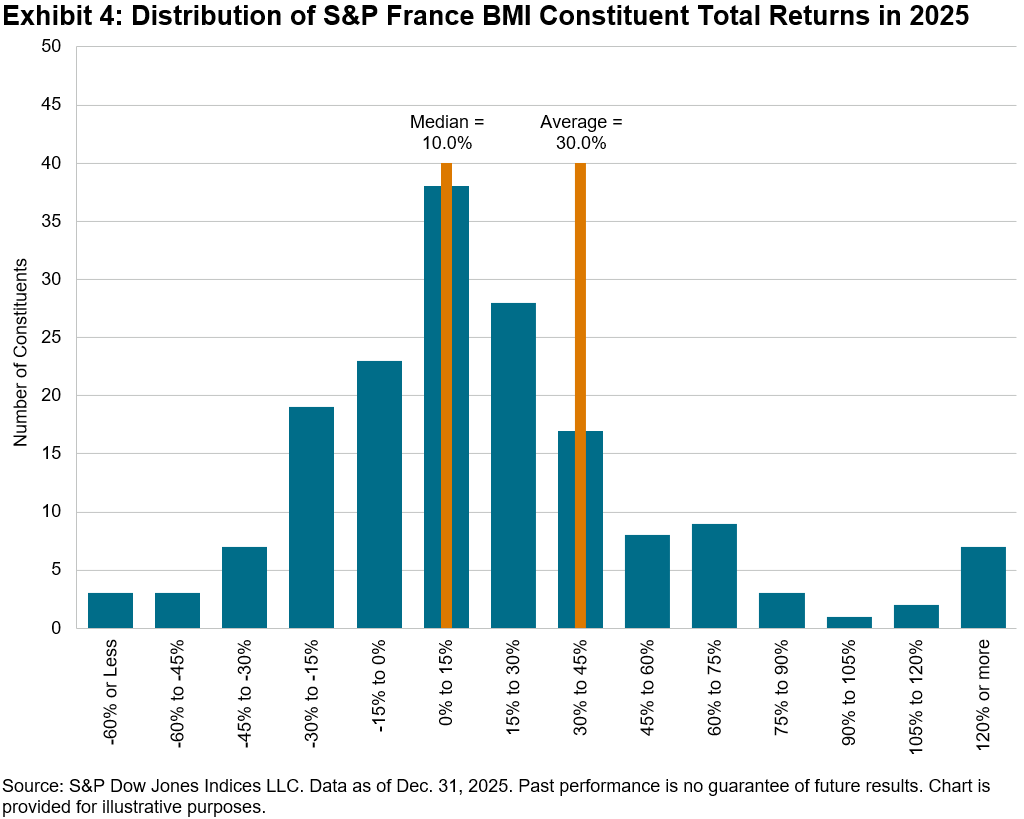
In 2025, leadership within the S&P France BMI extended beyond just its largest constituents. Skewness was quite elevated; while the average constituent gained 30.0%, the median increase was only 10.0%, and fewer than half (45.8%) of stocks outperformed the index (see Exhibit 4). This wide dispersion created more opportunities for stock selection, which may explain the lower rate of active underperformance. However, it also underscores the persistent challenges active managers face in beating the benchmark. Managers who identified strong performers outside the top holdings had a better chance of keeping pace.

So, are we finally catching a hint of the long-awaited “stock-pickers’ market,” or is it still just beyond reach for most?

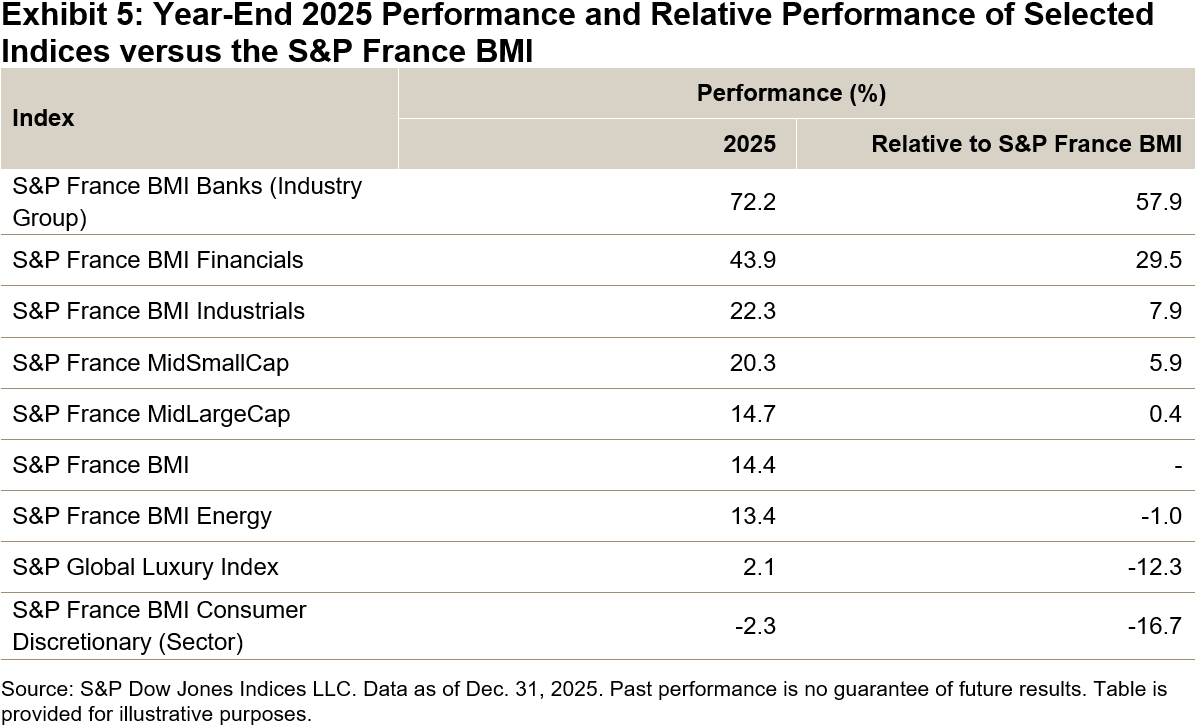
Sector effects appeared to play an important role in performance last year. Industrials and Financials accounted for around three-quarters of the S&P France BMI’s total gains in 2025. Financials showed strong results, with the S&P France BMI Financials sector rising 43.9%. Within Financials, the Banks industry group stood out, as the S&P France BMI Banks increased 72.2% in 2025, 57.9% above the broader S&P France BMI, as illustrated in Exhibit 5. The French bank Société Générale was among the year’s top-performing European banks. For active managers, being structurally underweight in either sector may have presented a meaningful headwind, even if stock selection was effective. The bigger risk may not have been picking the wrong banks but not enough banks.

When looking into some of the key stocks commonly held among active France Equity funds, another leg of France’s “luxury slump” may have negatively affected many managers. Large names like LVMH and Hermès, which historically have often led the pack, posted muted or even negative returns. Managers who stuck with these legacy luxury stocks probably felt the drag on performance.

The S&P France BMI Consumer Discretionary (Sector) fell 2.3%, finishing the year 16.7% behind the benchmark (see Exhibit 5). Within the S&P France BMI, the Apparel, Accessories & Luxury Goods sub-industry had the highest weight, at 12.8%, but only managed a 1.9% gain, contributing just 0.3% to the index’s total performance. That divergence—banks surging while luxury lagged—helped widen the gap between “right sector” and “wrong sector” positioning.

2025 marked a relatively bright spot for French active managers, with fewer underperforming their benchmark compared to the European average, though most still lagged behind. Whether this was truly The Year of Stock Picking in France remains to be seen; stay tuned for our SPIVA Europe Mid-Year 2026 Scorecard to find out if this momentum continued or proved to be a one-off.

1 SPIVA compares net-of-fees active fund returns with category-appropriate benchmarks and corrects for survivorship bias.


The posts on this blog are opinions, not advice. Please read our Disclaimers.

Leveraged Loan Market Snapshot

Contributor Image
Eric Pettinelli

Fixed Income Specialist, Index Investment Strategy

S&P Dow Jones Indices

Amid growing uncertainty, small market shifts can have large impacts on companies with lower credit ratings like those found in the S&P USD Select Leveraged Loan Index. This index measures the performance of a liquid and diversified universe of USD‑denominated leveraged loans by tracking all fully funded term loans with a minimum facility size of USD 500 million and credit ratings below investment grade, providing a broader view of the leveraged loan market.

The credit quality of the larger leveraged loans in the S&P USD Select Leveraged Loan Index has improved, and the index’s total notional value is also rising, as shown in Exhibit 1. This suggests that investors are assuming less risk on the larger loans while still pursuing the higher spreads offered further down the credit ladder.

This trend is reinforced by a lower proportion of the index with a credit rating of “default” in 2025, as shown in Exhibit 2. The year‑end 2025 default percentage was below the rates recorded in each of the three preceding years.

Index‑weighted spreads have been falling, reflecting improving credit quality. Spreads dropped from 3.53% to 3.27%, a 26 bps decline, and finished 2025 more than 40 bps below their 2024 peak (see Exhibit 3). As 2026 unfolds, this spread‑risk relationship could continue to be tested by market uncertainty, and the index will reveal loan market sensitivity to changing macro conditions.

Despite falling spreads, the index increased 4.5% in 2025, driven by the growing nominal value of the index. Higher credit quality also made this performance more resilient, suggesting the market may be seeking stability amid rising uncertainty.

By focusing on the largest leveraged loans, the S&P USD Select Leveraged Loan Index measures broader market shifts and remains a valuable tool for navigating an uncertain environment through an asset class with differentiated risk.

The posts on this blog are opinions, not advice. Please read our Disclaimers.

One to Forget: SPIVA Europe U.K. Equity Active Fund Performance in 2025

Contributor Image
Euan Smith

Quantitative Analyst, Index Investment Strategy

S&P Dow Jones Indices

2025 was full of memorable moments, from tariff tensions and continued AI advancement, to pop stars in space and billionaire weddings. For U.K. active equity funds, however, 2025 may well be a year to forget. Across the three relevant categories measured in the SPIVA Europe Year-End 2025 Scorecard (U.K. Equity, U.K. Large-/Mid-Cap Equity and U.K. Small-Cap Equity), 90% of funds failed to beat their category benchmark. Markets, perhaps more than usual, offered opportunities to positively deviate from market-cap-weighted indices, but return distributions made this a feat easier said than done.

In an absolute sense, 2025 was a fine year for U.K. equity active funds. Exhibit 1 shows that all three capitalization categories measured in the SPIVA Europe Year-End 2025 Scorecard produced positive returns in aggregate. This becomes far less impressive, however, when analyzing benchmark-relative performance. On both an equal- and asset-weighted basis, the active categories significantly lagged their benchmarks. The gap was especially wide for small-cap funds, which produced less than a quarter of the return of their benchmark, the S&P United Kingdom SmallCap.

The extent of this underperformance was historic. In 2025, 88% of broad U.K. Equity, 89% of U.K. Large-/Mid-Cap Equity and 97% of U.K. Small-Cap Equity funds failed to beat their benchmarks. As shown in Exhibit 2, it was a particularly bad year for the cohort, marking the second-worst, third-worst and second-worst years, respectively, across the three categories in the 14-year dataset.

As ever when debating the performance of active funds versus indices, there are likely to be two camps on this issue. Some may argue that 2025 was an exceptionally challenging year to navigate, full of macro headwinds, geopolitical turmoil and technologically driven paradigm shifts. From this perspective, active fund underperformance was driven by bad luck. Others may suggest that these are precisely the conditions where skilled active management should excel, and the fact that it generally did not is evidence of its rarity. Exhibits 3 and 4 may provide ammunition to both sides.

Exhibit 3 shows both the opportunity and perils of active management. In 2025, the performance of half of S&P U.K. BMI stocks differed from the index by more than 25%. There was, therefore, ample opportunity to generate outperformance by underweighting underperformers and overweighting outperformers. However, with significant underperformers more than doubling the number of outperformers, any deviation was likely to be negative.

Exhibit 4 further supports this, showing the distribution of U.K. Equity index constituent performances within the S&P United Kingdom LargeMidCap and S&P United Kingdom SmallCap. The distribution of performance in both indices was positively skewed, meaning that a small number of stocks were responsible for much of the increase. Consequently, for active funds, failure to own the few key outperformers at or above their index weight could have led to underperformance.

2025 proved to be a particularly difficult year for U.K. equity active funds. Concentrated stock returns made it difficult to match index performance. Such a return distribution is not unique to the U.K. in 2025, nor is the tendency for the majority of active funds to struggle to outperform their indices. The past may not be precedent, but the long-standing results from the SPIVA Scorecards continue to document similar patterns of underperformance year after year in markets across the globe.

The posts on this blog are opinions, not advice. Please read our Disclaimers.

Measuring Direct Lending: Building Transparency in Private Credit Markets

Contributor Image
Wanying Wu

Senior Analyst, Private Markets Indices

S&P Dow Jones Indices

Direct Lending Has Become a Core Segment of Private Credit

Private credit has expanded in recent years, with the market reaching an estimated USD 2.28 trillion at year-end 2025 and projected to grow to approximately USD 4.5 trillion by 2030.1 Within this expansion, direct lending has emerged as the dominant strategy, reshaping how companies access capital and how investors generate yield. Direct lending refers to loans provided directly to companies by private and public investment funds, including business development companies, rather than traditional banks, the broadly syndicated loan (BSL) market or public debt markets. These privately negotiated loans—typically extended to middle-market and sponsor-backed businesses—offer floating-rate income and structural protections for lenders. What was once a niche allocation has evolved into a mainstream source of corporate financing and institutional yield generation.

These privately negotiated loans are typically extended to sponsor-backed companies and are characterized by:

  • Floating-rate income profiles
  • Senior-secured positioning
  • Strong covenant and structural protections
  • Bilateral structuring flexibility

As the market has scaled, so too has its importance in institutional portfolios.

A Collaboration between S&P DJI and Lincoln International Enables a Systematic View of Direct Lending3

As direct lending has become a core pillar of corporate credit, the need for consistent, transparent and rules-based measurement has grown increasingly urgent. Historically, investors have faced significant data constraints:

  • Limited availability of standardized loan-level information
  • Absence of investable or benchmark-quality indices
  • Limited visibility into risk composition and structural characteristics

To address these challenges and enhance transparency, S&P Dow Jones Indices (S&P DJI) and Lincoln International formed a collaboration to launch the S&P Lincoln Senior Debt Index Series,3 comprising:

  • S&P Lincoln U.S. Senior Debt Index
  • S&P Lincoln Europe Senior Debt Index

By combining Lincoln International’s extensive private loan valuation database with S&P DJI’s expertise in index design, governance and calculation, the series delivers a systematic measure of the fair value performance of direct lending investments across the U.S. and Europe.

  1. Designed to Enhance Transparency and Institutional Confidence: The S&P Lincoln Senior Debt Index Series is structured to elevate transparency and analytical rigor within direct lending.
  2. Broad Market Coverage: Lincoln International’s valuation database represents approximately USD 220 billion of the direct lending loan market across the U.S. and Europe.
  3. Institutional-Grade Valuation Framework: Valuations are informed by Lincoln International and incorporate detailed portfolio company operating data provided by fund clients. All valuations conform to fair value standards under both U.S. GAAP and IFRS.
  4. Robust Governance: The index methodology is transparent, rules-based and administered independently by S&P DJI, with systematic rebalancing and oversight.
  5. Portfolio Characteristics and Composition: The indices reflect meaningful diversification across sectors, borrower size and loan structures.
  • Average Principal Balance (As of Dec. 31, 2025)
    • U.S.: USD 399 million
    • Europe: EUR 142 million
  • Average EBITDA Size (As of Dec. 31, 2025)
    • U.S.: USD 101 million
    • Europe: EUR 52 million

The S&P Lincoln Senior Debt Index Series outperformed leveraged loans over the last 10 years by 2.72% annually (U.S.) and over the last 7 years by 2.81% annually (Europe), as measured by the S&P Lincoln U.S. Senior Debt Index, S&P Lincoln Europe Senior Debt Index, S&P UBS Leveraged Loan Index and the S&P UBS Western Europe Leveraged Loan Index. This difference is driven by variations in company size, credit quality and liquidity.

The S&P Lincoln Senior Debt Index Series Complements BSL and BDC Benchmarks

As direct lending has grown in scale and institutional relevance, it increasingly sits alongside other leveraged lending segments, such as the BSL market, which represents approximately USD 1.4 trillion in the U.S.4

Both BSLs and direct lending provide senior-secured, floating-rate financing to leveraged borrowers and support similar corporate activities. However, their market structures differ. BSLs benefit from observable secondary market pricing, while direct lending loans are privately originated, negotiated bilaterally and typically held to maturity with limited trading activity. These structural distinctions mean that direct lending returns reflect not only credit fundamentals and seniority, but also an illiquidity premium and the value of structuring flexibility.

Conclusion

Private credit has evolved from a bespoke, opaque niche into a globally significant and institutionally scrutinized asset class. As the market expands in scale and systemic importance, the demand for transparency, governance and standardized measurement has intensified.

The S&P Lincoln Senior Debt Index Series represents an important milestone in the maturation of direct lending. By providing systematic, rules-based and independently administered measurement, the series enables:

  • Improved performance benchmarking
  • Enhanced risk transparency
  • More informed asset allocation decision
  • Strengthened reporting and governance frameworks

As demonstrated in Exhibits 1 and 2, private credit is now a major source of global capital formation. With this growth comes the responsibility to provide clarity and comparability. The S&P Lincoln Senior Debt Index Series helps establish the analytical infrastructure necessary for the next phase of the market’s evolution.


1 Guevarra, Joyce; Hiteshbhai Bharucha, Neel. “Private credit gains ground among top private equity managers.” S&P Global. Nov. 13, 2025.

2 U.S. leveraged loan and high yield bond yield and size: Presentation Title

U.S. & Europe Direct lending yield: S&P Lincoln Senior Debt Index Series.

U.S. & Europe Direct lending market size: CapIQ, S&P Global.

U.S. and Europe investment grade bonds market size: Barnes, Dan. IG issuance across US and Europe up 20% on five-year average. The Desk. Dec. 3,2025.

U.S. investment grade bonds yields: Leveraged Loan Market Review. Fidelity. Q4, 2025.

Europe leveraged loan and high yield bonds market size and yield: Valliere, Thierry, et al., 2025. Unlocking the potential of European Leveraged Loans. Amundi. March 20, 2025.

Europe investment grade bonds yield: Euro area yield curves. European Central Bank, Eurosystem.

Exchange rate data on Feb. 27, 2025, as sourced by XE.

3 S&P Dow Jones Indices and Lincoln International Unveil New Benchmarks for the Private Loan Market with Launch of S&P Lincoln Senior Debt Indices. S&P Dow Jones Indices. Feb. 23, 2026.

4 Wolfson, Kevin; Taylor, Joseph. Private Credit vs. Broadly Syndicated Loans: Not a Zero-Sum Game. PineBridge Investments. July 1, 2024.

The posts on this blog are opinions, not advice. Please read our Disclaimers.

Systematic S&P 500 Strategies Targeting Stability and Growth Potential

Meet the S&P 500 Futures Intraday Edge Indices, a dynamic index series built to react to changes in market conditions as they seek to capitalize on trends, optimize S&P 500 exposure, maintain stability and enhance growth potential. 

The posts on this blog are opinions, not advice. Please read our Disclaimers.