Get Indexology® Blog updates via email.

In This List

The Takaichi Trade: How Dispersion Shaped Japanese Active Funds’ Fortunes

Unicorns at the Gate: How Mega IPOs Could Reshape Global and Thematic Indices

Digging into the Divide in Global Financials

S&P/ASX Sustainability Screened Dividend Opportunities Index: 2025 Performance Review

The Drone Identity: Beyond Defense

The Takaichi Trade: How Dispersion Shaped Japanese Active Funds’ Fortunes

Contributor Image
Marco Zhang

Quantitative Analyst, Index Investment Strategy

S&P Dow Jones Indices

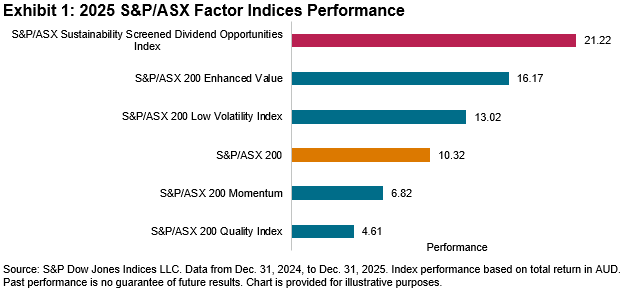
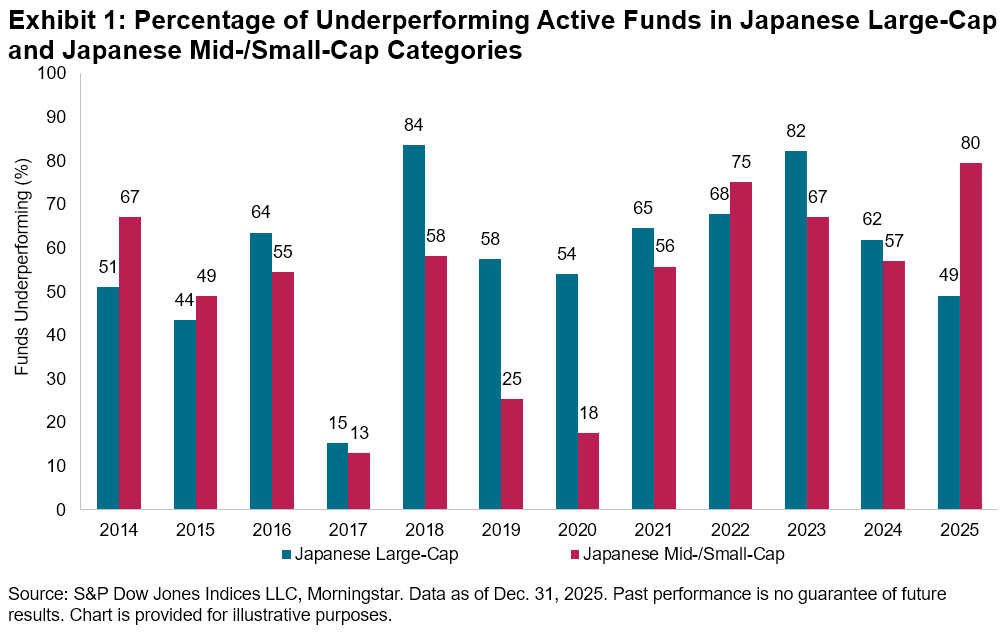
Amid a strong year for global equities in 2025, the latest SPIVA® Japan Scorecard showed that most active funds in Japan struggled to outperform their assigned benchmarks. An interesting finding in the report was the striking difference in relative performance between actively managed Japanese Large-Cap funds and Japanese Mid-/Small-Cap funds. Just 49% of Japanese Large-Cap funds underperformed their assigned benchmark, compared with 80% of Japanese Mid-/Small-Cap funds. This is quite unusual—Japanese Large-Cap funds have typically exhibited higher underperformance rates than Japanese Mid-/Small-Cap funds, as shown in Exhibit 1. The 2025 result represents the most pronounced reversal in the dataset since 2014.

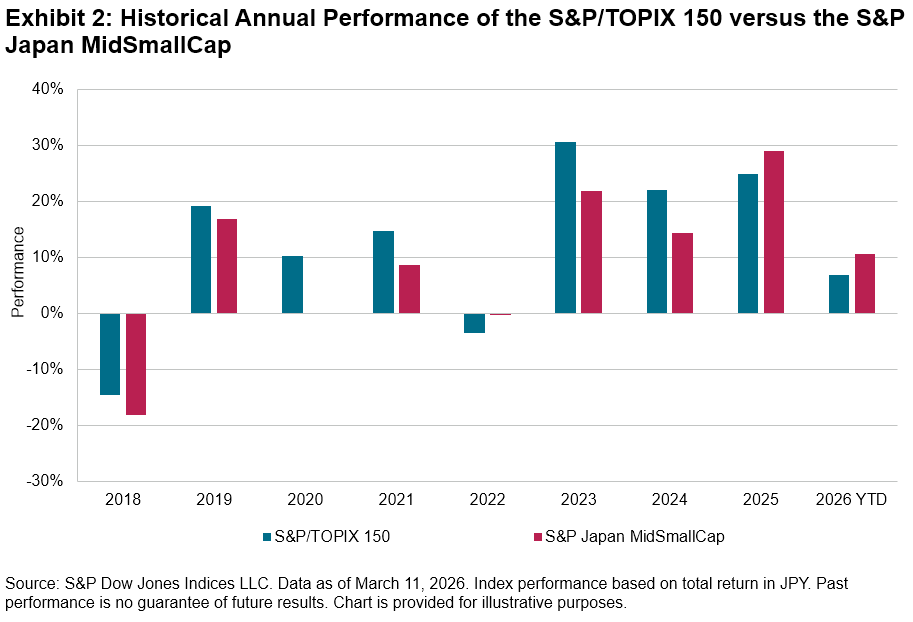
This unusual performance gap was likely driven by two key dynamics. First, the S&P Japan MidSmallCap outperformed the large-cap S&P/TOPIX 150 by 4.1% in 2025, marking a notable departure from the trend of large-cap dominance observed in previous years (see Exhibit 2). A broad-based rally in mid- and small-cap stocks raised the bar for fund managers in this segment, making it even more challenging for those with some large-cap exposure to keep up. Notably, mid- and small-cap stocks have continued to outpace their large-cap counterparts YTD as of March 11, 2026.

Second, stock dispersion1—the extent to which stocks move differently from one another—surged among Japanese large-cap stocks to a decade high in 2025, reaching levels typically seen in smaller stocks (see Exhibit 3). This surge in large-cap dispersion was likely driven by the unveiling of Prime Minister Sanae Takaichi’s fiscal stimulus package,2 which highlighted growth potential in sectors such as artificial intelligence, semiconductors and defense.3 The proposal triggered a repricing of large-cap stocks, depending on which companies were positioned to benefit from the policy priorities,4 thereby widening performance differentials within the S&P/TOPIX 150.

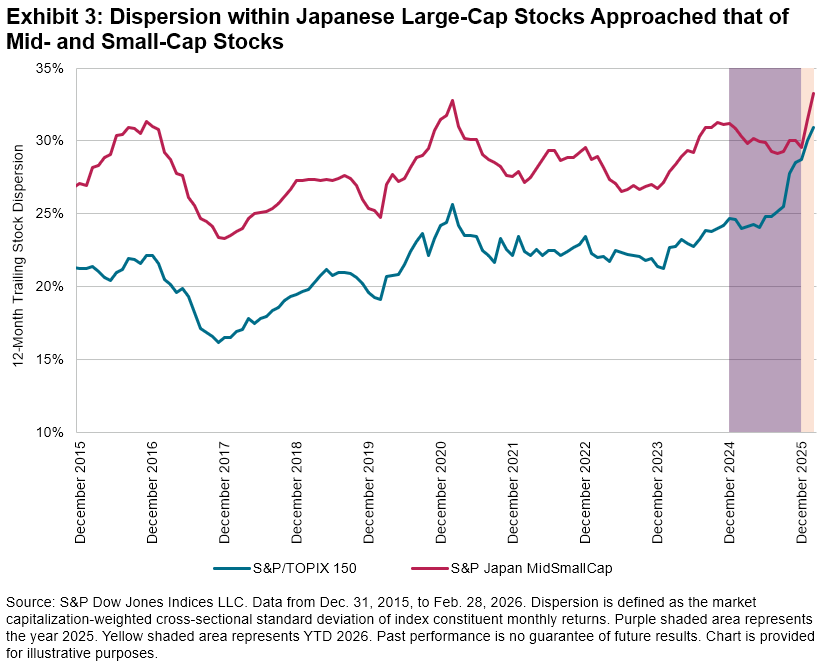
What does a high dispersion environment mean for active managers’ relative performance? Theoretically, higher dispersion creates greater opportunities for active fund managers to differentiate themselves through stock selection, offering a more favorable environment for skillful managers to deliver outperformance.5 The narrow majority outperformance of active large-cap managers in 2025 suggests that many were able to capitalize on the policy-driven repricing wave and rising dispersion among large-cap stocks. Interestingly, smaller companies also began to catch up in this trend of increasing dispersion during the first two months of 2026 (see Exhibit 3). This suggests that the “Takaichi Trade” repricing tide may be spreading among mid- and small-cap stocks, potentially providing a more supportive backdrop for skillful active managers in this segment.

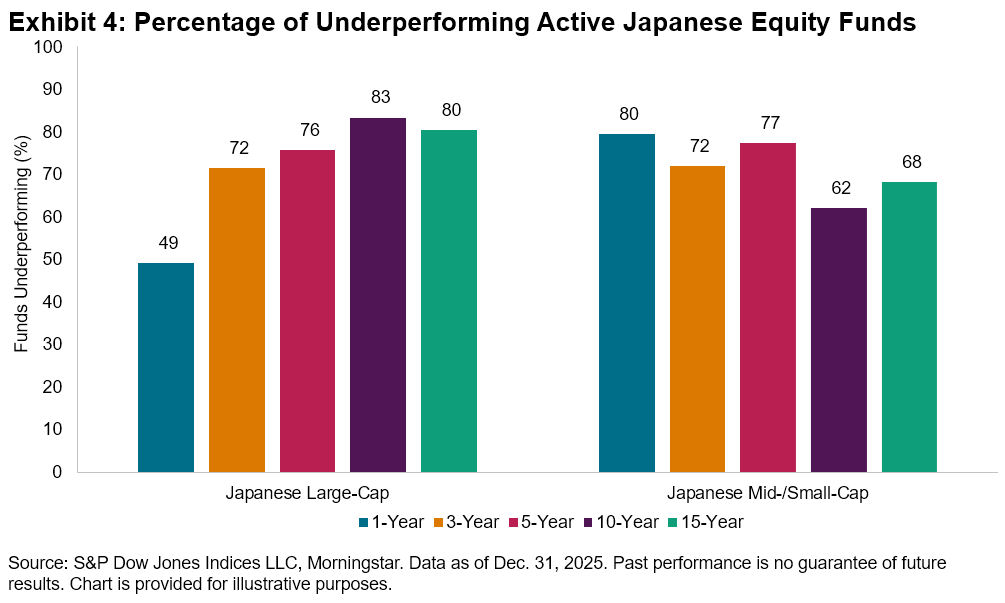
While active managers’ fortunes fluctuated in the short term, driven by changes in market conditions, the longer‑term picture remained challenging. Over the 10- and 15-year horizons, a majority of active funds underperformed in both domestic equity categories, including over 80% of large-cap funds (see Exhibit 4).

1 Dispersion is defined as the market capitalization-weighted cross-sectional standard deviation of index constituent monthly returns.

2 Sanae Takaichi won the Liberal Democratic Party (LDP) leadership election on Oct. 4, 2025, and became Japan’s prime minister on Oct. 21, 2025.

3 Reuters. “Japan to pledge bold spending increase in stimulus package, draft shows.” Nov. 12, 2025.

4 For instance, semiconductor companies like Advantest (+58%) and Tokyo Electron (+30%), as well as heavy-engineering firms such as Mitsubishi Heavy (+20%) and IHI (+16%), saw strong monthly gains.

5 Edwards, Tim and Craig J. Lazzara. “Dispersion: Measuring Market Opportunity.” S&P Dow Jones Indices LLC. 2014.

The posts on this blog are opinions, not advice. Please read our Disclaimers.

Unicorns at the Gate: How Mega IPOs Could Reshape Global and Thematic Indices

Contributor Image
Diego Zurita

Analyst, Global Equities & Thematics

S&P Dow Jones Indices

Big unicorns are outside the door waiting to join the public markets party. Recently, it has been reported that SpaceX,1 OpenAI2 and Anthropic3 are preparing for their initial public offering (IPO) in the near future. This has drawn attention not just for the size of these firms but for the impact they would have on financial markets. The timing and inclusion of private companies as large as these in indices could be more relevant than ever, especially for market participants who use benchmarks in their investing strategies.

As my colleague Hamish Preston highlighted on a recent blog, adding any of these stocks to the S&P 500® would take at least 12 months after the IPO. However, S&P DJI offers a number of rules-based indices that have specific criteria to decide whether, how and when to include stocks that recently went public.

The Fast-Track IPO Treatment for Broad Benchmarks

S&P Dow Jones Indices’ flagship global equity index, the S&P Global BMI, has the objective of tracking the entire investable global stock market using float-adjusted market cap (FMC). Similarly, the region, country and GICS® sector sub-indices that are part of this family aim to represent specific markets.

Based on constituent data from the S&P U.S. Private Stock Top 10 Index, as of the end of February 2025, SpaceX, OpenAI and Anthropic had a collective market cap of USD 1.4 trillion. If they all had a full IPO with all shares trading in the public market, they would represent together a weight of approximately 2.9% in the S&P World Index, a subindex of the S&P Global BMI. This is more than the entire weight of 19 regions in the index, including France, Germany, Australia and others (see Exhibit 1).

While the shares of such companies may not be fully issued to the public,4, 5 resulting in lower weights in broad-based benchmarks, the scenario above demonstrates that delaying additions until the next rebalance may distort the index’s representation of the broader opportunity set.

To ensure that benchmarks keep reflecting their target markets, if an IPO meets the criteria outlined in Exhibit 2, the methodology of the S&P Global BMI Series allows its inclusion within five business days; however, if circumstances warrant, the Index Committee may decide to postpone it until they consider it appropriate.6

The Variable Treatment of IPOs for Thematic Indices

Not all rules-based indices follow this treatment. Benchmarks that aim to provide a more targeted reflection of specific segments of the market generally don’t. Among those, we can find S&P DJI’s suite of thematic indices, which are designed to focus on emerging trends and structural shifts shaping the global economy and include the S&P Kensho Indices and the recently launched S&P Atlas Thematic Indices.7 These indices typically have fewer companies with tighter selection criteria. Adding stocks outside their rebalance could trigger unexpected turnover, causing elevated trading costs and risking a higher tracking error for investment products tracking these benchmarks.

When a mega-cap company goes public, indices with a more concentrated constituent base typically defer inclusion until the next scheduled rebalance, provided the IPO occurs before the reference date and the company satisfies all eligibility requirements. For example, if SpaceX were to go public in October, its position in the space economy could make it eligible to be added to the S&P Kensho Global Space Index.8 Assuming it meets all the requirements to be part of the index, the company would be added after the close on the third Friday of November, coinciding with the next rebalance. At that time, all constituents are equally weighted to mitigate concentration risk.

When those unicorns finally ring the bell to join the party, broad market indices may include them quickly to maintain market representation, while benchmarks with a targeted focus could wait until rebalance to prioritize stability. These different approaches are designed to balance market accuracy with practical replicability.


1 Wang, Echo and Joey Roulette. “Exclusive: Musk’s SpaceX in merger talks with xAI ahead of planned IPO, source says.” Reuters. Jan. 29, 2026.

2 Jin, Berber, Corrie Driebusch and Kate Clark. “OpenAI Plans Fourth-Quarter IPO in Race to Beat Anthropic to Market” Wall Street Journal. Jan. 29, 2026.

3 Butts, Dylan. “Anthropic reportedly preparing for massive IPO in race with OpenAI: FT.” CNBC. Dec. 2, 2025.

4 Wang, Echo, Manya Saini and Juby Babu. “Elon Musk’s SpaceX to raise over $25 billion in blockbuster 2026 IPO, source says.” Reuters. Dec. 10, 2025.

5 Wang, Echo et al. “Exclusive: OpenAI lays groundwork for juggernaut IPO at up to $1 trillion valuation” Reuters. Oct. 30, 2025.

6 For more information, please refer to the index methodology.

7 For more information, please see: Jalagani, Srineel. “S&P Atlas Thematics: The Compass for Evolving Markets.” S&P Dow Jones Indices. July 28, 2025.

8 For more information, please see: Zurita, Diego. “Houston, We Have an Index: Exploring the S&P Kensho Global Space Index.” S&P Dow Jones Indices. Jan. 20, 2026.

The posts on this blog are opinions, not advice. Please read our Disclaimers.

Digging into the Divide in Global Financials

Contributor Image
Euan Smith

Quantitative Analyst, Index Investment Strategy

S&P Dow Jones Indices

Since the beginning of 2025, the global Financials sector has experienced a significant shift. For several years, across the developed world, the sector had been sailing in roughly the same direction, though generally the U.S. at a higher rate of knots. In 2025, market winds blew the S&P 500 Financials (Sector) and the S&P World Ex-U.S. Financials (Sector) Index in significantly different directions. This piece unpacks the drivers of this divergence.

Exhibits 1 and 2 highlight the recent change. Exhibit 1 shows annual index performance since 2010. In 11 of the 15 years prior to 2025, the U.S. Financials sector outperformed the ex-U.S. sector, and on occasions where the latter outperformed it was never by more than 12%. However, in 2025, the S&P World Ex-U.S. Financials Index outperformed by nearly 25%, and so far in 2026, it is over 7% ahead.

Correlations between the sectors have fallen recently, as shown in Exhibit 2.

Fluctuations are normal and correlations have been lower since 2010, but this, combined with the recent performance, demonstrates a clear change, which begs the question—why? Observing fundamental performance and index composition begins to provide an answer.

Exhibit 3 shows changes in both earnings and P/E since the start of 2025. Both indices saw solid earnings growth, especially the S&P World Ex-U.S. Financials Index at 23% compared to 9% for the S&P 500 Financials. The far larger differentiator, however, was that ex-U.S. P/E multiples saw large expansion, while in the U.S. they contracted slightly.

The performance divergence coincided with the U.S. tariff announcements in mid-February 2025, making them possible contributors to this sentiment shift. However, a more favorable monetary environment and increasing profitability may have also been drivers. Clearly though, market sentiment toward the ex-U.S. Financials sector has shifted significantly, resulting in a rerating relative to their U.S. peers since early 2025.

Despite this, the S&P World Ex-U.S. Financials Index is still a long way from parity with the S&P 500 Financials. Currently, P/E levels are around 14.3 for the S&P World Ex-U.S. Financials Index compared to 17.3 for the S&P 500 Financials.

These indices reflect more than just different macro measurements of the same sector. Owing to the differences in the makeup of the Financials sector globally, they have distinct GICS industry weights, as demonstrated in Exhibit 4.

Within the S&P 500 Financials, the sector is diversified across industries, with significant weights in the Capital Markets, Financial Services and Banks industries, spanning a range of companies from investment banks to cryptocurrency exchanges. In contrast, the S&P World Ex-U.S. Financials Index is dominated by the Banks industry.

Differences in industry weights give each index distinct sensitivities to market trends, causing potential performance differences. Exhibit 5 shows that, since early 2025, Banks have been the top-performing industry in both regions, benefitting the S&P World Ex-U.S. Financials Index. Additionally, four out of five S&P World Ex-U.S. Financials Index industries outperformed their S&P 500 Financials equivalents, demonstrating the impact of sentiment changes.

Whether 2025 was an anomaly or the beginning of a new regime for Financials remains uncertain. Sustained outperformance of the Banks industry or a lasting shift in sentiment due to geopolitical events could benefit the S&P World Ex-U.S. Financials Index. Conversely, performance may revert to the historical dominance of the S&P 500 Financials. In this uncertain landscape, sector indices provide a valuable perspective on how these dynamics unfold.

The posts on this blog are opinions, not advice. Please read our Disclaimers.

S&P/ASX Sustainability Screened Dividend Opportunities Index: 2025 Performance Review

Contributor Image
Izzy Wang

Associate Director, Factors and Dividends

S&P Dow Jones Indices

The S&P/ASX Sustainability Screened Dividend Opportunities Index delivered a standout performance in 2025, establishing itself as the best performer among all the S&P Factor Indices in the Australian equity landscape. The index posted a robust calendar year return of 21.22%, outpacing the S&P/ASX 300 by 10.9% (see Exhibit 1).

In addition to its recent outperformance, the S&P/ASX Sustainability Screened Dividend Opportunities Index consistently outperformed the S&P/ASX 300 over the mid and long term as well. As Exhibit 2 shows, it outperformed the S&P/ASX 300 over the 1-, 3-, 5- and 10-year periods, and over the full 14-year back-tested history since Jan. 31, 2012. Since its launch on Oct. 17, 2022, the index has achieved an excess annual return of 4.43% compared to the S&P/ASX 300.

Index Construction

The construction of the S&P/ASX Sustainability Screened Dividend Opportunities Index is underpinned by a transparent, rules-based approach that reflects both income and sustainability considerations (see Exhibit 3).1 The process begins by considering all stocks in the S&P/ASX 300 universe, excluding REITs. First, all stocks go through eligibility screens that include market size, liquidity and earnings-per-share (EPS) filters to avoid illiquid and unprofitable stocks. Second, the eligible stocks go through a series of sustainability screens to exclude companies involved in traditional energy, including oil & gas and thermal coal, and controversial businesses such as gambling, alcohol, tobacco, etc. After the eligibility and sustainability screens, the 50 stocks with the highest 12-month forecast dividend yield will be selected as index constituents. Constituents are weighted by the product of float-adjusted market cap and dividend yield, subject to single-stock and sector caps.

Sector Characteristics

A closer look at the sector composition of the S&P/ASX Sustainability Screened Dividend Opportunities Index reveals both commonalities with and distinctions from other high dividend strategies. Exhibit 4 compares the index’s sector weights with those of the S&P/ASX 300 and with the average of two other S&P/ASX indices that focus on high dividend yield.2

Like many dividend-focused indices, the S&P/ASX Sustainability Screened Dividend Opportunities Index tends to overweight Financials, Materials and Industrials—sectors that have historically provided robust dividend streams and stable earnings. Conversely, it is underweight in Health Care and Information Technology relative to the S&P/ASX 300.

While high dividend strategies often have significant allocations to Energy and Utilities—sectors known for high dividend payouts—the S&P/ASX Sustainability Screened Dividend Opportunities Index had no weight in these sectors in 2025. This exclusion is a direct result of the sustainability criteria.

Performance Attribution

The index’s outperformance in 2025 was driven by a combination of allocation and stock selection effects. Exhibit 5 shows the sector attribution analysis of the S&P/ASX Sustainability Screened Dividend Opportunities Index against the S&P/ASX 300.

One of the most significant contributors was the index’s underweight position in Health Care and Information Technology. Facing considerable headwinds in the Australian market during 2025, Health Care and Information Technology were two sectors within the S&P/ASX 300 that posted negative performance for the year. Given that the sectors collectively accounted for around 12% of the S&P/ASX 300’s average sector weight, the near-zero exposure in the S&P/ASX Sustainability Screened Dividend Opportunities Index helped to boost its performance in 2025. In addition to sector differences, stock selection within Financials and Consumer Discretionary also played a crucial role.

The S&P/ASX Sustainability Screened Dividend Opportunities Index has historically demonstrated that incorporating sustainability screens could lead to distinctive characteristics compared to pure high dividend yield indices, which may contribute to the index performance. The S&P/ASX Sustainability Screened Dividend Opportunities Index is a unique benchmark for tracking high dividend yield stocks in the ASX market while incorporating sustainability considerations.

1 For more detailed information, please see the index methodology.

2 The S&P/ASX Dividend Opportunities Index and S&P/ASX 200 High Dividend Index

The posts on this blog are opinions, not advice. Please read our Disclaimers.

The Drone Identity: Beyond Defense

Contributor Image
Srineel Jalagani

Senior Director, Thematic Indices

S&P Dow Jones Indices

The idea of unmanned flying machines has existed in human imagination for millennia. However, drones as we know them today only became a practical reality in the late 20th century with systems such as the Predator drone that was developed in the 1990s.

Drone technology has evolved rapidly from its early military origins. Currently, drones are also being used far beyond defense in logistics, infrastructure inspection, agriculture, environmental monitoring and emergency response. Their ability to collect data and reach difficult terrain has made them increasingly valuable across industries.

As drones become more central to industry and national security, benchmarks like the S&P Kensho Drones Index can help track the growth of this ecosystem. The S&P Kensho Drones Index measures U.S. companies involved in the development and deployment of remotely operated or autonomous aerial and marine drones. Importantly, the index goes beyond drone manufacturers to include firms that supply critical technologies enabling drone capabilities. Sensors, edge-computing chips, communications hardware and navigation systems form the backbone of drones and support their expanding use across civilian and military markets.1

The S&P Kensho Drones Index has been one of the strongest performers recently within the S&P Kensho New Economies framework, which tracks 25 themes shaping the Fourth Industrial Revolution (see the S&P Thematics Dashboard for additional information). The index was up roughly 21% YTD as of March 6, 2026, pushing its 12-month gain to around 75%, placing it near the top of the S&P Kensho New Economies leaderboard.

This YTD gain has been broad-based, with roughly three-quarters of index constituents (18) contributing positively to performance. By GICS industry, the largest contributions came from Aerospace & Defense, Electronic Components & Equipment and Energy Equipment & Services. The presence of Energy Equipment & Services firms highlights the growing role of industrial drone applications.

Three Energy companies, Oceaneering International, Forum Energy Technologies and TechnipFMC, accounted for three of the five largest contributors to the index’s YTD performance. These three companies operate subsea robotic systems used for pipeline inspection, subsea maintenance and deepwater oil & gas operations. Their strong contributions highlight how drone and robotic technologies are increasingly embedded in traditional industrial sectors such as Energy.

Notably, the broader Oil & Gas Equipment & Services industry has recently broken out of its three-year trading range. This industry’s momentum has supported the performance of Energy-focused companies within the S&P Kensho Drones Index.

The benefits of the index’s diversification across the drone value chain become even clearer when looking at earlier periods of performance. During the period from April 2025 to October 2025, when the index gained roughly 80%, performance was driven primarily by defense companies benefiting from geopolitical tensions and multi-year government defense spending commitments. While the underlying drivers may vary over time, they remain linked by a common thread (i.e., the expanding role of drones and autonomous systems across defense, industrial and commercial markets).

Several structural forces have recently strengthened the growth of the drone industry.

  • Policy Support and Regulatory Expansion: Governments are increasingly prioritizing domestically produced and trusted drone technologies.2 In the U.S., legislation such as the FY2026 NDAA3 requires key components to be sourced from the U.S. or allied countries, while expanding Beyond Visual Line of Sight (BVLOS)4 rules are enabling drones to operate over longer distances and unlocking new infrastructure and industrial use cases.
  • Hardware Innovation: Advances in chips, batteries and sensors are expanding drone capabilities. Edge-computing chips enable real-time onboard processing5 improved batteries extend flight times and new sensing technologies support more advanced inspection and monitoring tasks.
  • AI as the Intelligence Multiplier: AI is turning drones into autonomous systems capable of navigation, analysis and decision-making in real time. AI also enables drones to operate as part of connected networks6 with satellites, ground robots and other autonomous platforms.

As drones become embedded across defense and industrial systems, the S&P Kensho Drones Index seeks to track this evolving ecosystem across aerial and marine drone technologies and their enabling components.

1 Please see the S&P Kensho Indices Methodology for more information.

2 European Union, “Action Plan on Drone and Counter Drone Security,” Feb. 11, 2026.

3 House Armed Services Committee, “The FY26 NDAA.”

4 Federal Aviation Administration, “BVLOS Fact Sheet.”

5 Micron, “Edge AI in the sky,” September 2025.

6 McKinsey, “Future defense tech: Multidomain stacks to build affordable mass,” Feb. 12, 2026.

The posts on this blog are opinions, not advice. Please read our Disclaimers.