Get Indexology® Blog updates via email.

In This List

When Resilience Resonates: The S&P 500 Resilient Shareholder Yield Index

Defining Paths: The Expanding Landscape of Options-Based Index Strategies

Understanding the iBoxx Tadawul SAR Indices

What’s beyond the Top 60 in Canada?

S&P 500 in Focus: Global Trends and Local Insights

When Resilience Resonates: The S&P 500 Resilient Shareholder Yield Index

Contributor Image
Elizabeth Bebb

Director, Factor & Dividend Indices

S&P Dow Jones Indices

In a market defined by shifting cycles, tightening financial conditions and an increasingly high bar for corporate discipline, resilience isn’t just a desirable trait—it’s a differentiator. The S&P 500® Resilient Shareholder Yield Index identifies companies that balance rewarding shareholders with the financial strength needed to sustain those rewards over time. Its shareholder yield framework aggregates dividends, net buybacks and net debt reduction to reflect total capital return, while complementary quality metrics emphasize durable fundamentals.

YTD Outperformance of the Benchmark

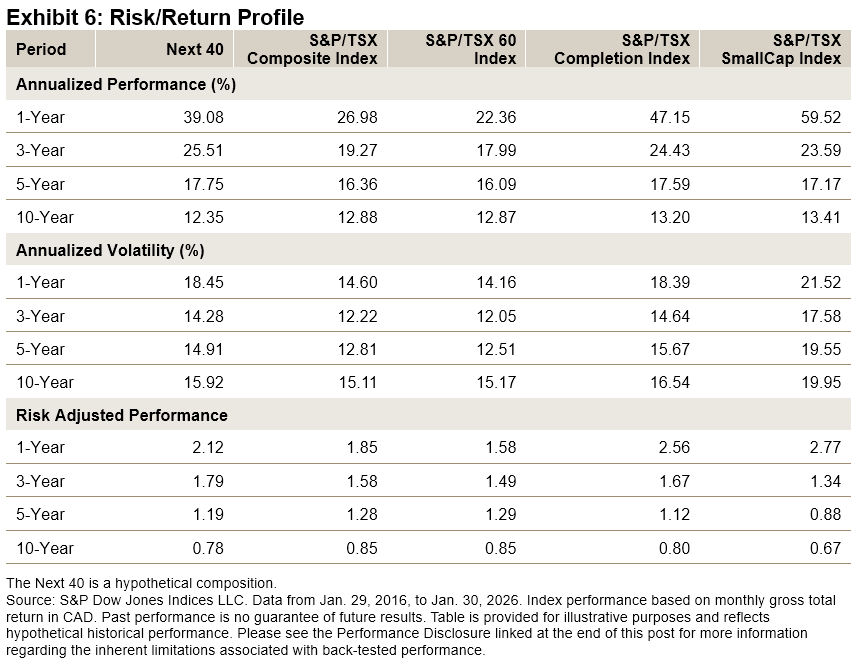
Year-to-date, the S&P 500 Resilient Shareholder Yield Index has outperformed the S&P 500 by 10%. This builds on its robust performance from the index’s first year of live history, when it gained 21.04%, contributing to a 5.80% cumulative outperformance relative to the S&P 500 since its launch on Dec. 2, 2024.

Methodology Overview

The methodology for the S&P 500 Resilient Shareholder Yield Index identifies companies with high shareholder yield while maintaining financial quality. This process begins by excluding companies with a shareholder yield above 25%, which removes high yielding firms that may point to structural challenges or financial distress.

Remaining companies are ranked using four metrics: two focused on consistent capital return generation (shareholder yield and capital return growth) and two quality measures (return on equity and free cash flow-to-total debt). Companies are scored and ranked based on their average performance across these metrics, with the top 100 selected for inclusion. Constituents are then weighted proportionally to their float-adjusted market capitalization (FMC) multiplied by their shareholder yield.

Back-Tested Historical Performance

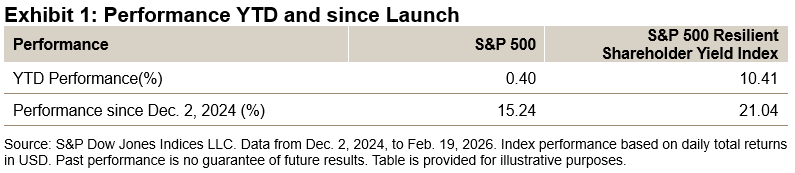
Over the long-term back-tested period, the index has delivered an annualized gain of 10.89%, outperforming its benchmark by 5.63%. Notably, this was achieved with a lower overall annualized volatility, leading to higher risk-adjusted performance than the benchmark.

Defensive Characteristics

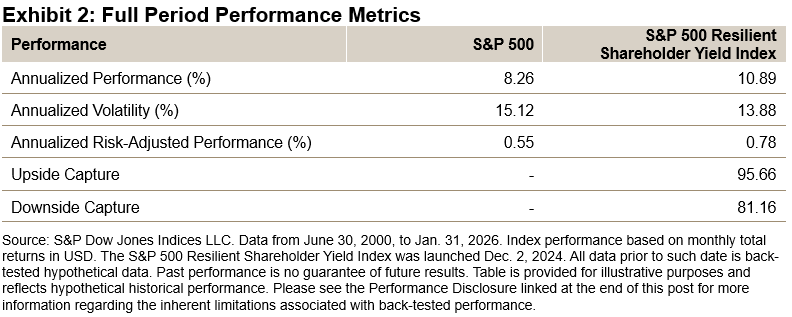
The S&P 500 Resilient Shareholder Yield Index has historically exhibited defensive characteristics, particularly during periods of elevated market volatility. Back-tested results show that when volatility increased—measured by VIX® levels above 20—the index tended to outperform relative to the S&P 500.

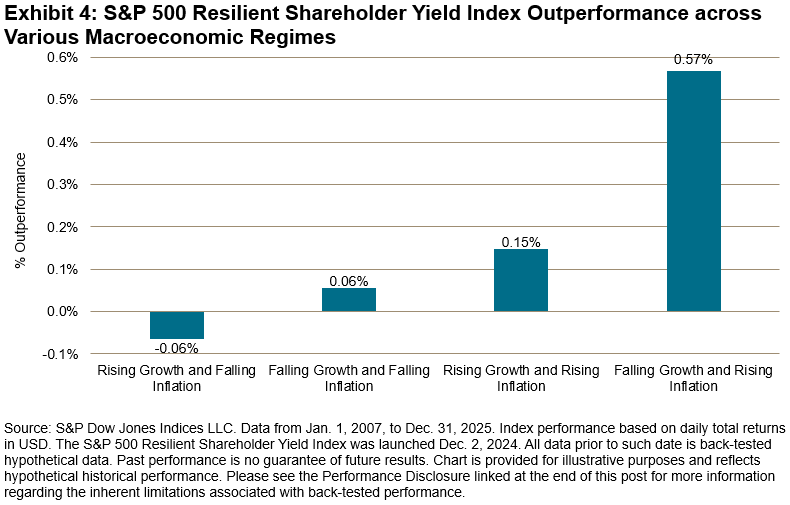
Macroeconomic Performance

Examining the index’s back-tested performance across different macroeconomic environments shows that it has delivered its strongest outperformance during periods of rising inflation—especially when economic growth was slowing. Although these environments have historically challenged broader equity markets, companies with disciplined capital allocation, strong cash generation and balance sheet flexibility have proven to be more resilient.
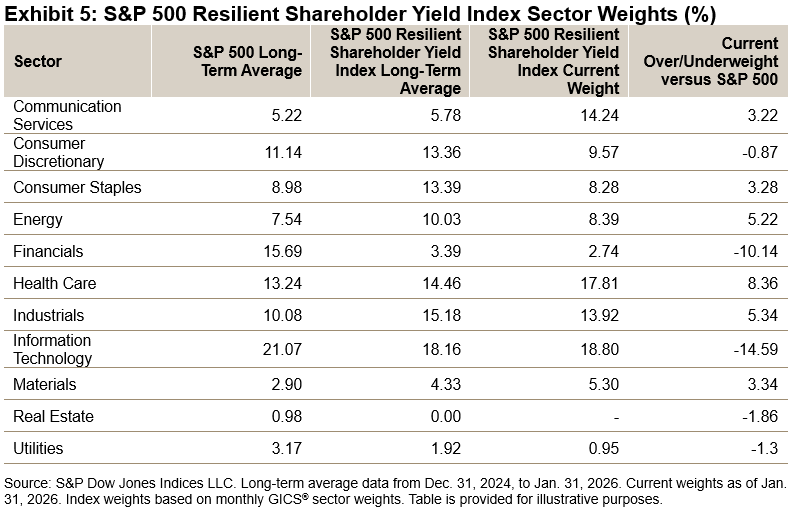
Sector Weights

The sector composition of the S&P 500 Resilient Shareholder Yield Index has historically favored Industrials and Consumer Staples while maintaining an underweight position in Financials. Currently, the index shows a pronounced underweight to Information Technology, alongside increased weight to Health Care, Energy and Industrials—reflecting a tilt toward more resilient cash flows and balance sheets.

Conclusion

Taken together, the historical evidence suggests that the S&P 500 Resilient Shareholder Yield Index lives up to its name. It has demonstrated an ability to participate meaningfully in rising markets while offering resilience during more challenging regimes. For market participants seeking an index that screens for companies that combine consistent capital return and financial discipline, the S&P 500 Resilient Shareholder Yield Index may offer a compelling framework for navigating changing market conditions.

The posts on this blog are opinions, not advice. Please read our Disclaimers.

Defining Paths: The Expanding Landscape of Options-Based Index Strategies

Contributor Image
Sue Lee

Director and APAC Head of Index Investment Strategy

S&P Dow Jones Indices

The investment landscape is in a perpetual state of evolution, with market participants continually seeking innovative tools. In recent years, options-based strategies—particularly those delivered through an ETF wrapper—have surged in popularity. Once the domain of institutional investors or structured product users, options-based strategies like covered call and buffered strategies have been democratized. This growth represents a significant shift that could reshape how a wider range of investors approach portfolio construction and navigate market volatility.

The Engine of Growth: Accessibility and Market Needs

The proliferation of options-based ETFs has been a notable development, providing investors with a generally easier-to-own and more liquid vehicle for accessing these strategies. As shown in Exhibit 1, their asset growth has been exponential, particularly in the last five years. Beyond the regulatory changes, this reflects an environment where traditional cross-asset correlations have shifted, and investors are increasingly looking beyond the conventional 60/40 portfolio for diversification and risk mitigation.

Two strategies have captured the lion’s share of this growth: covered call and buffered strategies. Covered call strategies focus on generating income by selling call options against invested assets, while buffered strategies aim to provide a specific level of downside protection in exchange for a cap on upside participation. By writing call options or buying put options, both strategies have historically made investment returns steadier and more predictable. A rolling one-year performance comparison of representative S&P 500® covered call and buffered indices versus the S&P 500 over the past 14 years shows that covered call and buffered indices delivered performance in the 0-15% range in more than two-thirds of the periods, compared to only one-third for the S&P 500.

The Foundational Role of Indices

Indices play a multifaceted, critical role in this expanding landscape. First and foremost, liquid and well-established equity benchmarks serve as the core component of the majority of these strategies. The S&P 500 is the preeminent choice, with its robust trading ecosystem: the high liquidity and tight bid-ask spreads in S&P 500 options facilitate the effective implementation of various strategies, from daily covered calls to one-year buffered products, catering to a wide spectrum of investment objectives.

Indices also serve as essential benchmarks for both active and passive options-based strategies. In a market crowded with funds described as actively managed, the ability to compare performance against a transparent and rules-based benchmark is paramount. Indices allow investors to dissect performance, understand the drivers of return and make informed decisions about whether a particular strategy is delivering on its objectives, ultimately fostering greater accountability and trust.

As investors continue to seek solutions that enhance portfolio resilience and adopt a more balanced approach to navigating market volatility, the relevance of options-based strategy indices could be expected to grow further. For a deeper dive into this topic, please refer to our recently published paper, “Defining Paths with Options-Based Index Strategies.”

The posts on this blog are opinions, not advice. Please read our Disclaimers.

Understanding the iBoxx Tadawul SAR Indices

How are indices bringing greater transparency to Saudi Arabia’s sukuk and fixed income markets? S&P DJI’s Jessica Tan joins GCMA’s Michael Grifferty for a closer look at the trends driving the evolution of these markets and how index-based tools are helping market participants evaluate the region’s opportunity set.  

The posts on this blog are opinions, not advice. Please read our Disclaimers.

What’s beyond the Top 60 in Canada?

Contributor Image
Anna Mittra

Associate Director, Global Exchanges

S&P Dow Jones Indices

Canada’s investment landscape is often defined by the S&P/TSX 60, the benchmark that comprises the nation’s largest companies. These larger-cap companies—predominantly Financials and Energy firms—tend to lead headlines for portfolio allocations. Yet beneath the top tier of widely recognized names exists a dynamic segment that focuses on emerging leadership, innovation and diversification in Canada’s public markets.

The group of companies ranked just outside the flagship S&P/TSX 60—referred to here as the “Next 40”—reflect an important segment with the potential to transition to the S&P/TSX 60. This group represents a blend of mid-sized companies and emerging smaller caps with high potential, making the Next 40 a potential signal for the direction of the Canadian economy.

The Next 40 consists of the 40 largest constituents of the S&P/TSX Completion Index. Rebalancing quarterly on the third Friday of March, June, September and December, this basket maintains strict modularity with the flagship S&P/TSX 60. To preserve the distinction, any constituent added to the S&P/TSX 60 is removed from the Next 40 on an intra-quarter basis and replaced, ensuring no overlap between the two tiers.

Over the period studied, the Next 40 tracked most closely to the S&P/TSX Completion Index, while also remaining competitive with the flagship S&P/TSX 60 and the broader S&P/TSX Composite Index (see Exhibit 2). Specifically, the Next 40 maintained a tracking error above 7% against the large-cap flagship, demonstrating that it was measuring a distinct market segment rather than acting as a redundant proxy. By contrast, its lower tracking error against the S&P/TSX Completion Index shows that it has historically been a reliable representation of the market, avoiding the unpredictability often found in smaller, less liquid stocks.

While the Next 40 tracked closely to the S&P/TSX Completion Index, it can act as a strategic filter that narrows the universe down to its most impactful stocks. By omitting smaller constituents that have historically underperformed, the Next 40 could serve as a more efficient version of the S&P/TSX Completion Index, focusing on how specific names tended to perform better than their peers over the 10-year period reflected in Exhibit 2. As shown in Exhibit 3, this refinement allowed the components in this statistic to populate the top-tier brackets—specifically those with a total return exceeding 150%—more consistently than the broader universe.

While the S&P/TSX 60 tends to be characterized by heavy concentration in mega-cap entities, the Next 40 has tended to have more balanced weights, with the largest constituent holding a weight of only 6.39% (see Exhibit 4). This differentiation is further supported by the varied sector contribution over the years (see Exhibit 5). While Financials remained a core pillar, sectors like Industrials and Materials have gained meaningful participation as well.

The Next 40 represents a compromise between size stability and growth dynamism. Over the 10-year period, the S&P/TSX Composite Index and the S&P/TSX 60 had high annualized returns. The Next 40 had only slightly higher volatility than the S&P/TSX 60, which reinforces its focus on the largest, most established firms outside of the traditional top tier.

Conclusion

The Next 40 is more than just an overflow list: it’s an indicator of the more liquid mid-cap segment of Canadian equities. By moving beyond the mega-cap concentration of the S&P/TSX 60, the Next 40 reduces focus on a handful of giants by seeking innovation in sectors that tend to be under-represented in the top tier. For a broader perspective on Canadian equities, incorporating a structured view of these firms may provide a fresh lens into where growth and innovation may emerge.

The author would like to thank Tom Phillips for producing analysis and data underlying this post.


The posts on this blog are opinions, not advice. Please read our Disclaimers.

S&P 500 in Focus: Global Trends and Local Insights

How is the continued evolution of the S&P 500 ecosystem helping market participants around the globe express views and manage risk? S&P DJI’s Tim Edwards and Cboe Global Markets’ Mandy Xu explore how the iconic index reflects global trends and how network effects are helping bring increased transparency and price efficiency to markets around the world. 

The posts on this blog are opinions, not advice. Please read our Disclaimers.