


The S&P 500® GARP 100 Index, launched on Nov. 24, 2024, sits at the intersection of value and growth strategies. Its objective is to identify 100 constituents from the S&P 500 that exhibit strong growth while maintaining reasonable valuations and high quality attributes.
Methodology
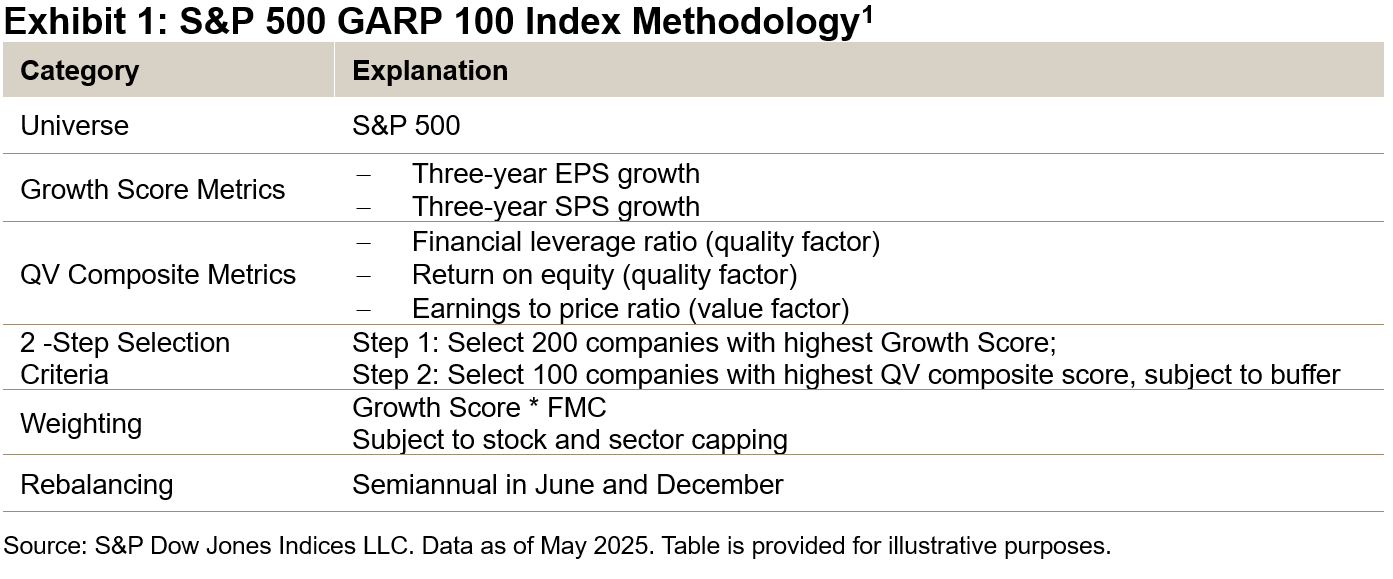
The index employs a two-step selection process. First, it identifies the top 200 ranked constituents based on their Growth Score, which is derived from three-year earnings per share (EPS) and sales per share (SPS) growth rates. From this subset, the top 100 companies are selected using a composite score that integrates quality and value (QV) metrics.
Weighting within the index is determined by multiplying the Growth Score by each security’s free-float market capitalization (FMC).
Historical Back-Tested Performance Analysis
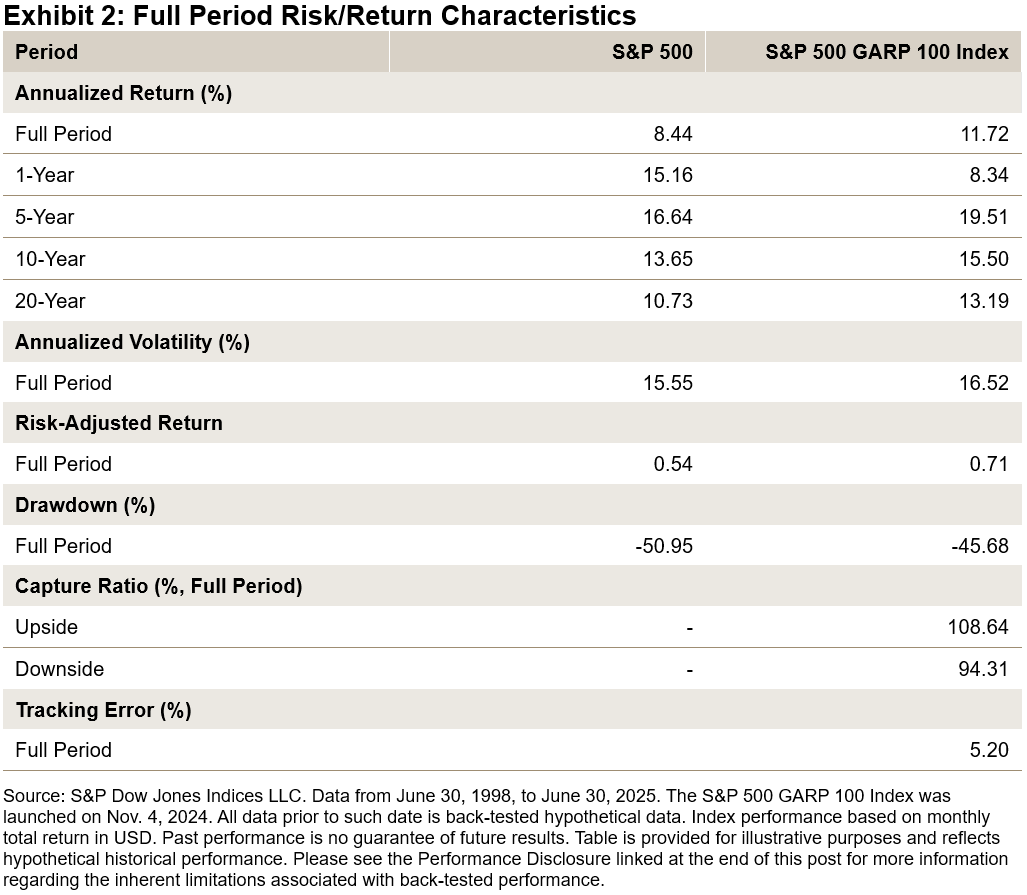
The historical back-tested performance of the S&P 500 GARP 100 Index shows significant outperformance, both in absolute and risk-adjusted terms, compared to its benchmark. The index exhibited an upside capture ratio of 108.53, highlighting its potential to benefit from rising markets. Conversely, a downside capture ratio of 94.31, along with a lower drawdown compared to the benchmark, underscores its moderate defensive characteristics.
Sector Breakdown Insights
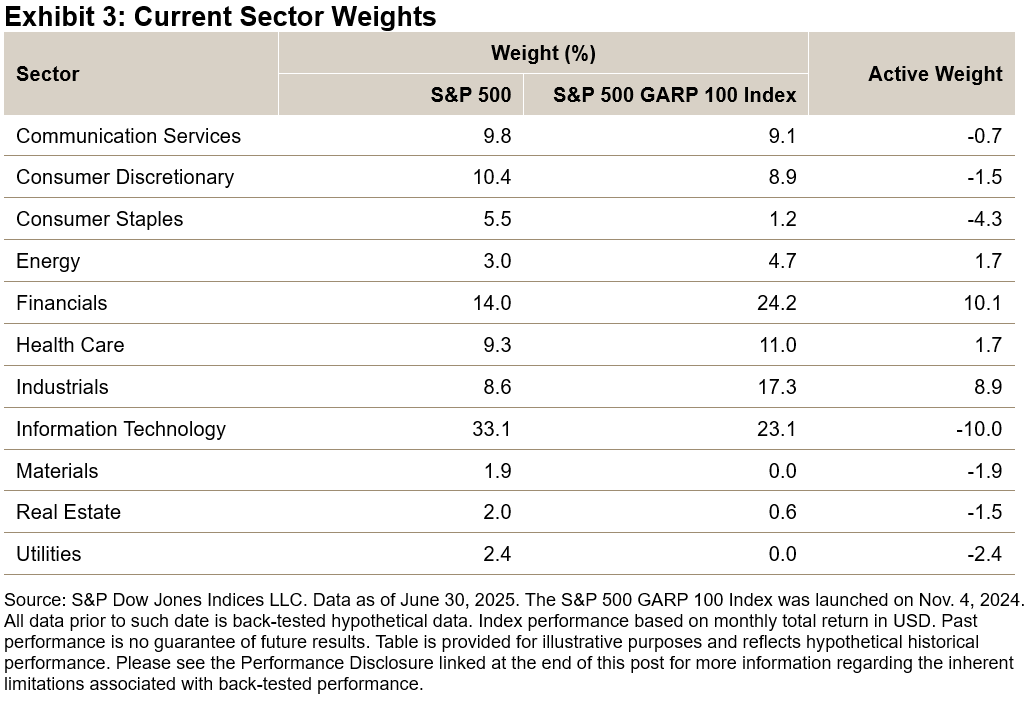
Exhibit 3 shows that as of June 30, 2025, the S&P 500 GARP 100 Index underweighted the Information Technology sector by about 10%, with Consumer Staples also underweight. The index had a high weight in Industrials and Financials. This is due to the multi-factor selection criteria of the methodology, which considers both growth and valuation metrics.
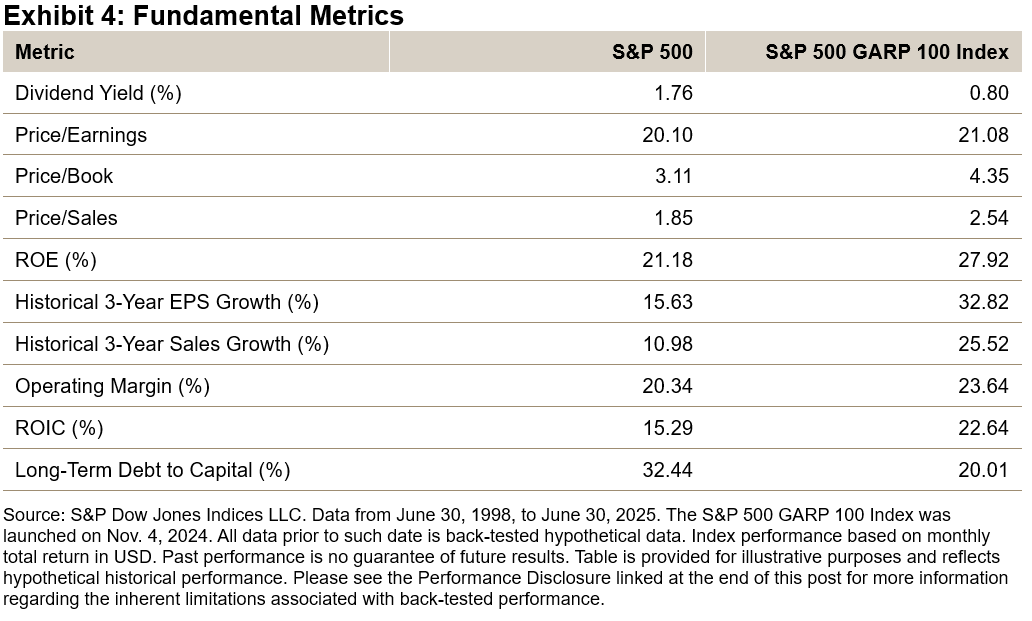
The S&P 500 GARP 100 Index has a multi-factor focus, having historically demonstrated strong fundamental characteristics across growth, value and quality metrics. Over the back-tested period, it exhibited significantly higher EPS and sales growth compared to the benchmark. Additionally, the index displayed strong quality metrics, including return on equity (ROE), return on invested capital (ROIC), operating margins and lower debt-to-capital ratios. Furthermore, the index featured lower price-to-earnings ratios, highlighting its emphasis on a lower valuation approach.
Historical Macroeconomic Performance
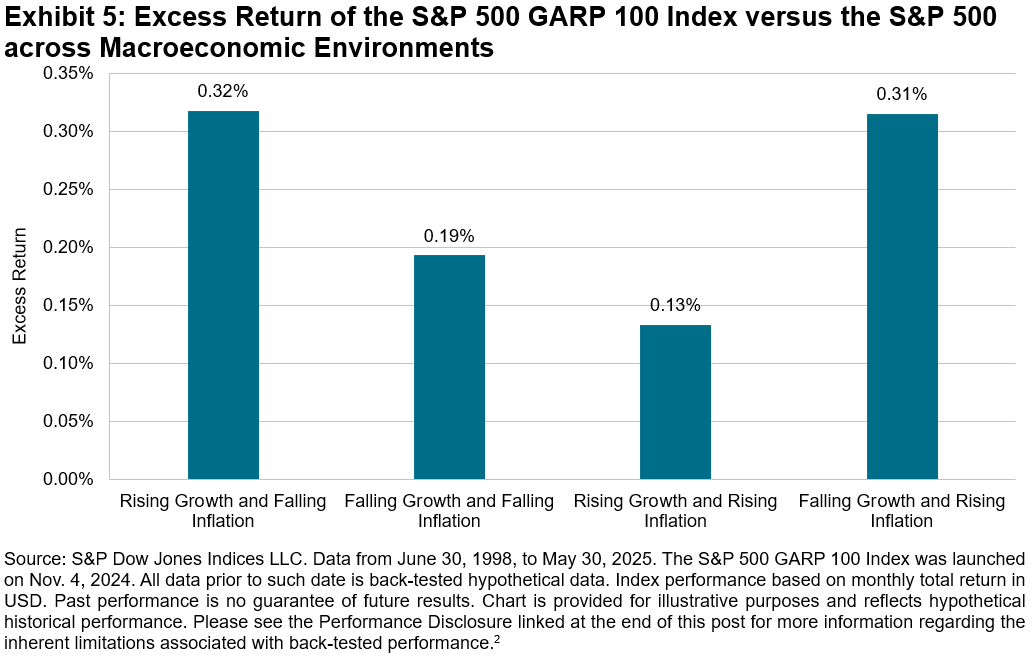
Exhibit 5 shows the monthly excess returns of the S&P 500 GARP 100 Index across various environments defined by rising and falling growth and inflation. Through its multi-factor approach, the index historically showed positive excess returns across each environment analyzed for this back-tested period.
Conclusion
The S&P 500 GARP 100 Index tracks companies within the S&P 500 that exhibit growth potential and strong valuations. Launched in November 2024, the index employs a rigorous multi-factor methodology that integrates growth, value and quality metrics. Back-tested historical performance analysis revealed significant outperformance against its benchmark, with defensive qualities and robust fundamentals.
1 For the full methodology rules, please refer to the S&P GARP Methodology Document.
2 For more information, please see: Hao, Bill and Rupert Watts. “A Historical Perspective on Factor Index Performance across Macroeconomic Cycles.” S&P Dow Jones Indices. Nov. 14, 2024.
The posts on this blog are opinions, not advice. Please read our Disclaimers.


