At one point deep into the Global Financial Crisis of 2008, I remember a clever colleague declaring “less down is the new up.” He wasn’t alone in this point of view, since in a world with so many markets and indices falling in unison, those that performed relatively better justifiably gained attention. One of those standouts at the time was the S&P 500® Low Volatility Index (“Low Vol”).
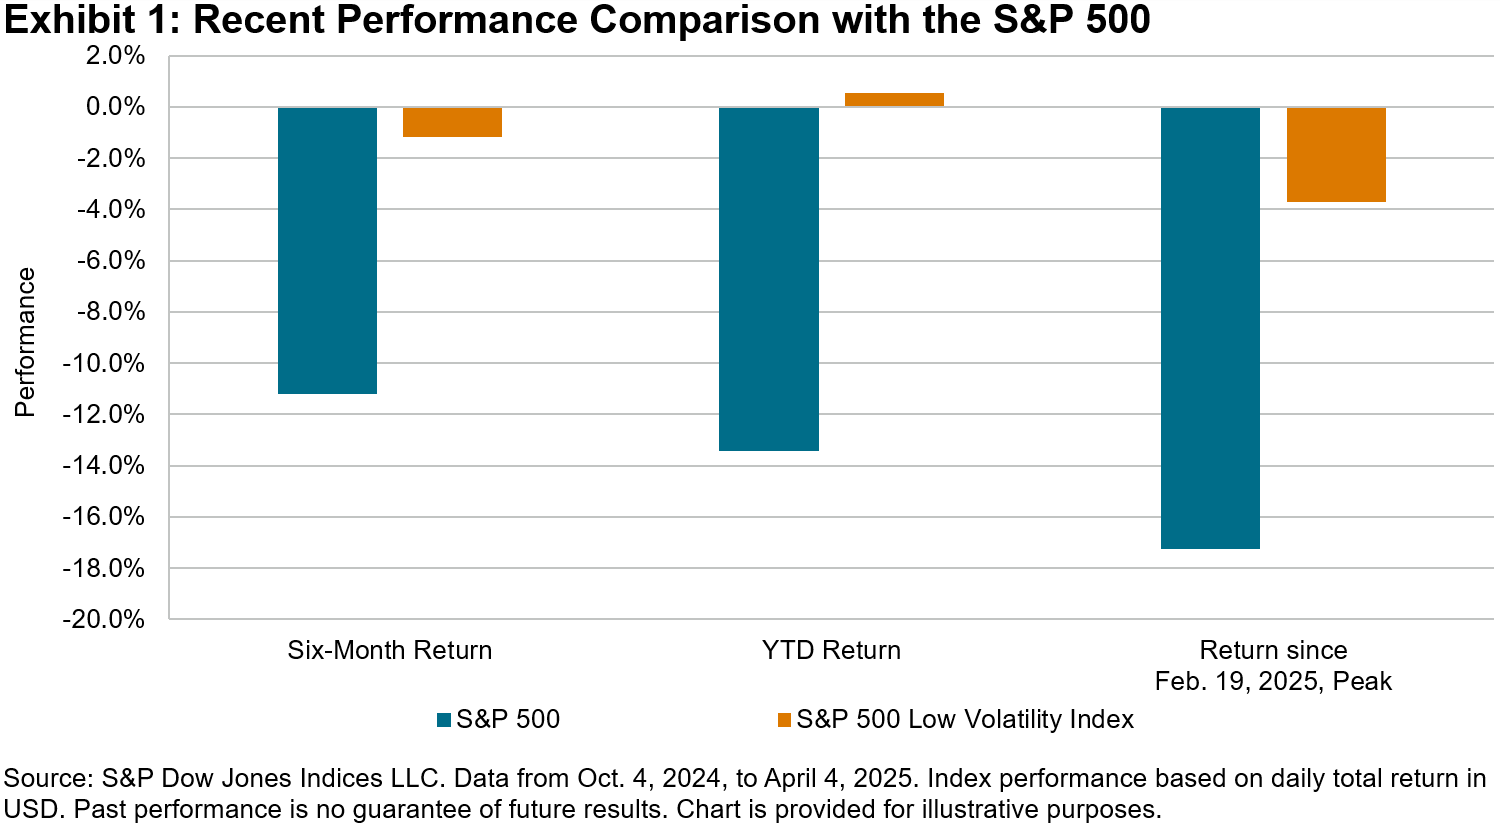
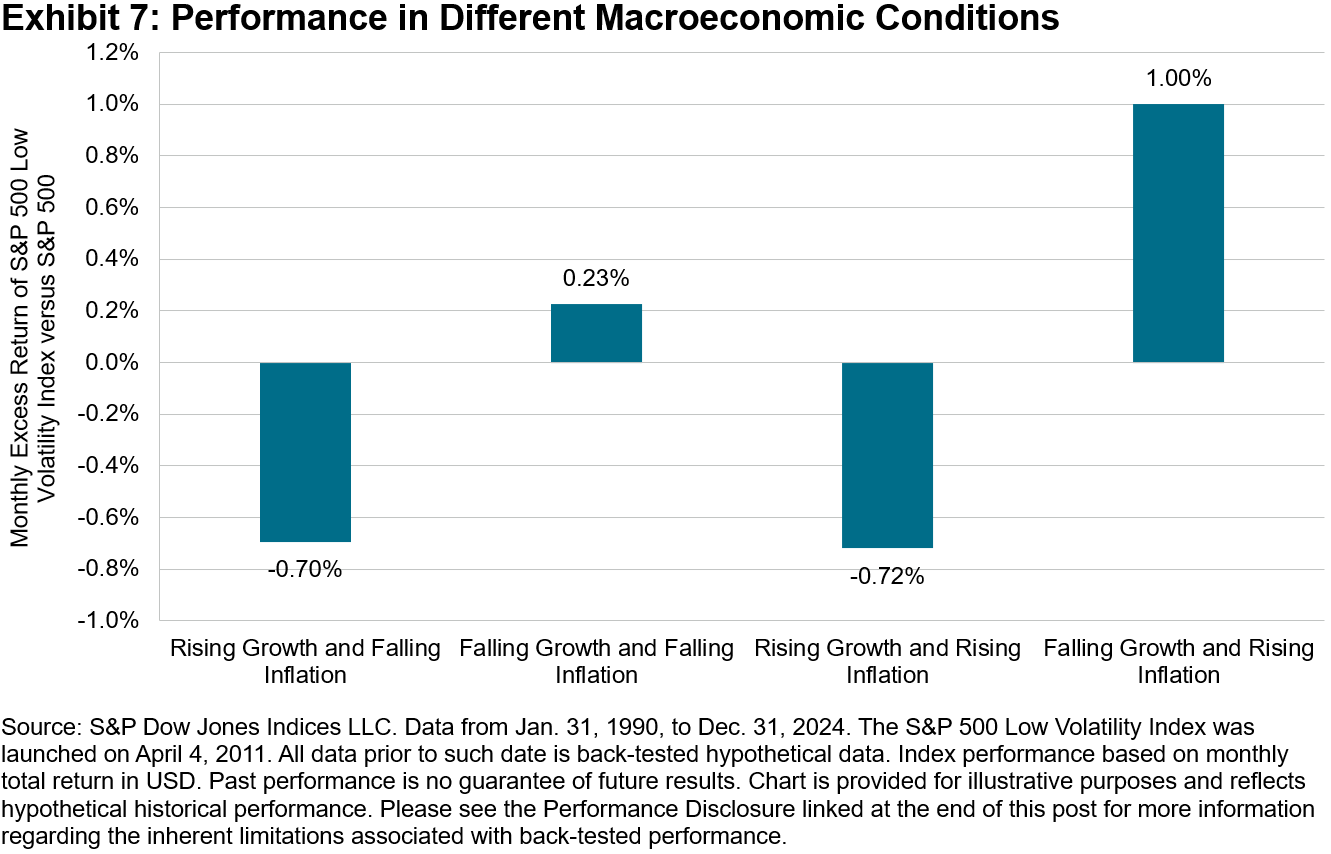
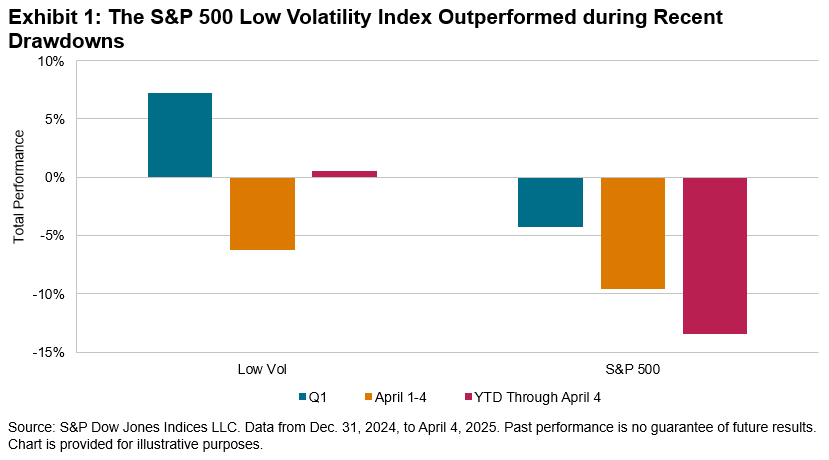
Nearly two decades have passed since then, and Low Vol has continued to stand out during downturns, including 2025’s market swoon, as shown in Exhibit 1.
This isn’t unusual; Low Vol has a track record of losing less, while still participating in upside, in a pattern often referred to as the “low volatility anomaly.” Researchers call this factor’s performance an anomaly since it defies conventional economic theory about the positive relationship between return and risk. Explanations for this breakdown in the risk/return relationship center around mispricing (more precisely, underpricing) of lower-risk stocks and overpricing of higher-risk stocks due to a mix of behavioral, structural and economic drivers.
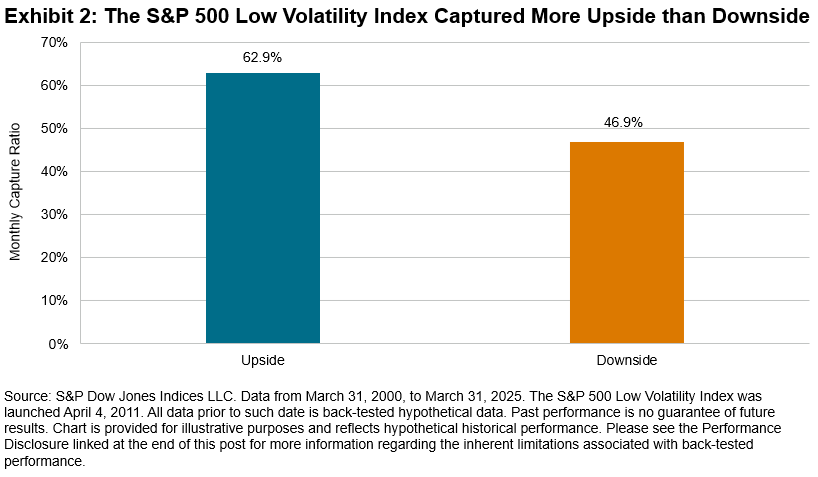
By design, the Low Vol index has historically delivered less risk than the S&P 500, with an annualized volatility of 11.6% compared to 15.3% for The 500™ and a lower beta (0.7) over the 25 years ending March 2025. Lower volatility and beta come from capturing less of the ups and downs of market movers, but in the case of Low Vol, this rate of capture is not symmetrical. Looking again at the 25-year period ending in March 2025, we calculated monthly upside and downside capture ratios for Low Vol relative to The 500, as shown in Exhibit 2.1
The observed upside and downside capture characteristics of Low Vol have played out in real time to various degrees of magnitude through expansions and downturns over the last 25 years. In recent months, the factor has appeared to show relative resilience once again, as illustrated by Exhibit 3’s chart showing rolling one-year excess performance versus The 500.
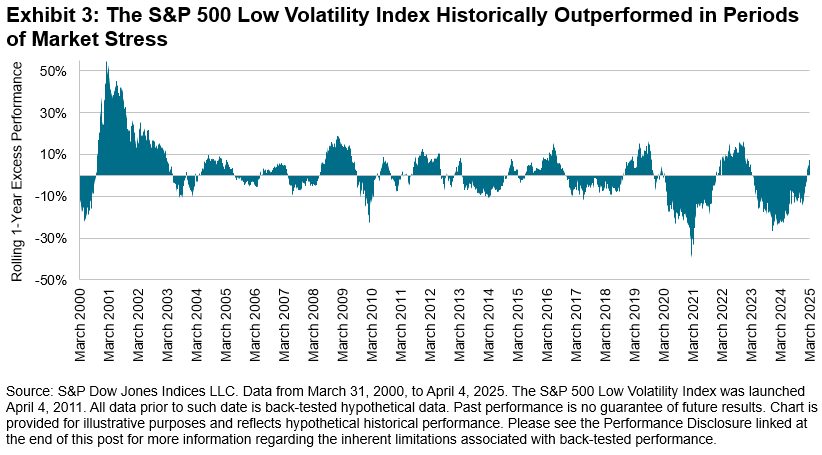
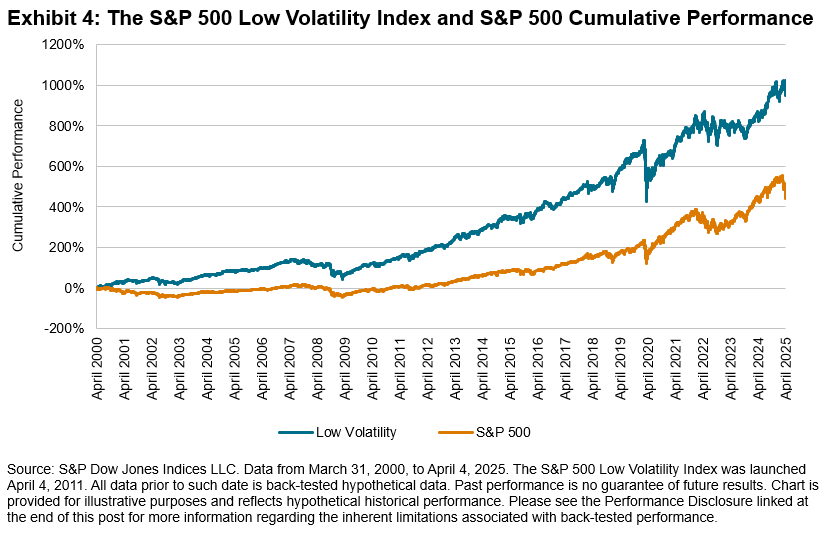
It is clear from Exhibit 3 that the recent performance differential between Low Vol and The 500, while noteworthy, is not without precedent and indeed has been surpassed during previous crises. Suffering less downside, on average, than the S&P 500, but participating slightly more during rebounds, repeated again and again, has historically led to a widening margin of cumulative outperformance for Low Vol versus The 500 over the last 25 years, as shown in Exhibit 4. On an annualized basis, the S&P 500 Low Volatility Index rose 9.9% per year compared to 7.0% for The 500.
Measures of risk, rolling performance and average upside/downside capture shed light on the persistent characteristics of S&P 500 Low Volatility Index, but viewing them together tells a longer-term story about the anomalous power of a defensive stance historically.
1 Upside and downside capture ratios are based on monthly performance of the S&P 500 Low Volatility Index relative to the S&P 500 from March 2000, to March 2025 and are capped at no more than 100% and no less than 0%.
The posts on this blog are opinions, not advice. Please read our Disclaimers.