Get Indexology® Blog updates via email.

In This List

Navigating Developed Markets: The S&P World Index Explained

Navigating the Global Index Landscape amid Tariff Volatility

Applying Nobel Prize-Winning Volatility Research to the S&P 500

Macro Madness

U.S. Homeland Securities – Selecting Firms with U.S.-Centric Revenue

Navigating Developed Markets: The S&P World Index Explained

Contributor Image
Diego Zurita

Analyst, Global Equities & Thematics

S&P Dow Jones Indices

Reliable and comprehensive benchmarks are indispensable in a landscape where global diversification is at the forefront. The S&P World Index tracks the performance of large- and mid-cap stocks from 24 developed markets, providing a consistent universe for historical market analysis and implementation of investment strategies.

The S&P World Index was launched in 2009, building on the legacy of the S&P Global BMI (Broad Market Index). Currently, the S&P World Index encompasses over 1,500 companies, reflecting approximately 85% of the market capitalization of the developed markets included in the index.

The index is constructed following a rules-based approach for size and liquidity. Companies must have a float-adjusted market cap of at least USD 100 million to be included in the index as of the annual rebalance in September. To ensure replicability, only liquid stocks are considered; companies must meet a 12-month median value traded ratio of 20% and a six-month median daily value traded of USD 0.25 million The large- and mid-cap stocks represent the top 85% of the local market’s total available capitalization. For further details about the index’s construction, please refer to the methodology.

As a co-founder of the Index Industry Association, S&P DJI adheres to industry best practices and evolving regulatory standards, reinforcing its role as a reliable and accurate benchmark provider for global market participants. The index methodology is reviewed regularly by an independent oversight committee, ensuring it evolves alongside market dynamics while maintaining its foundational principles.

Home bias—the tendency to invest predominantly in domestic equities—can limit diversification potential. The S&P World Index encompasses international equities from 24 developed countries, illustrating its comprehensive coverage (see Exhibit 2).

Moreover, the S&P World Index offers diversified weight across sectors. Exhibit 3 summarizes the weights of the Global Industry Classification System (GICS®) sectors for this benchmark.

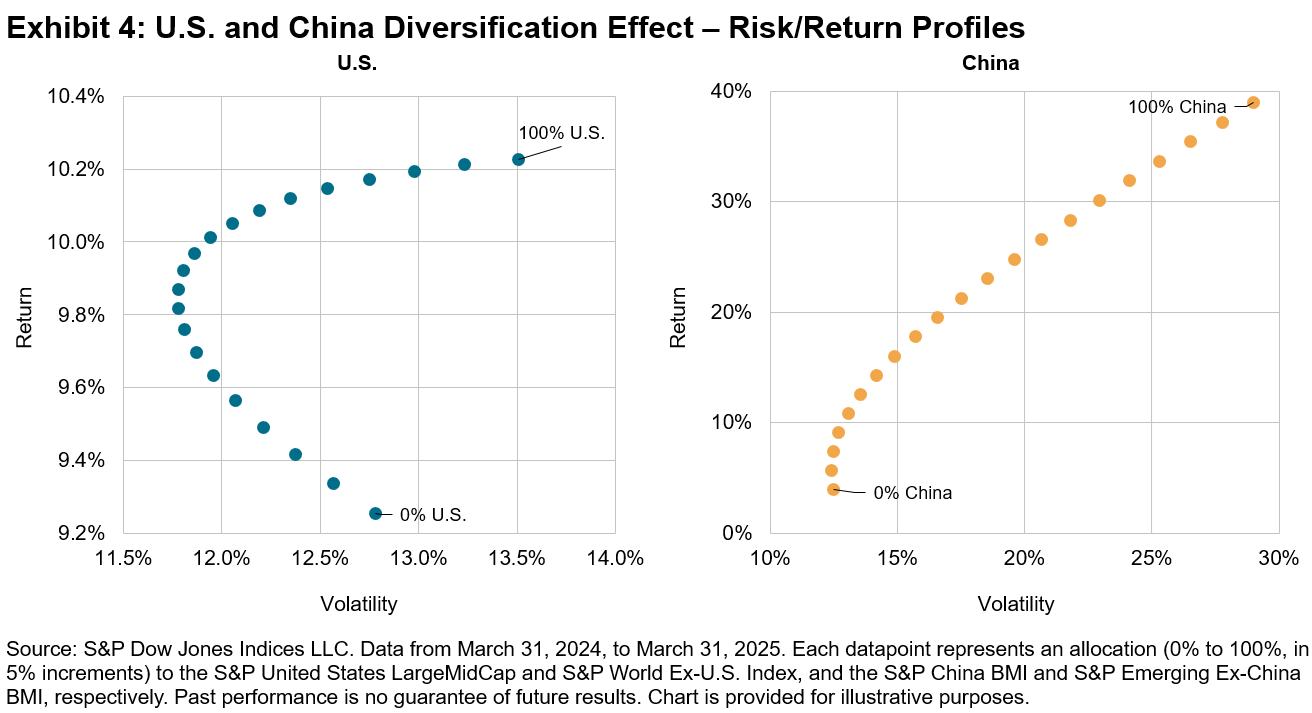
In order to provide benchmarks across the developed market opportunity set from targeted perspectives, the S&P World Index Series offers over 380 subindices that include sector, style and currency versions, as well as specific regional views (e.g., the S&P World Ex-U.S. Index).

In addition, the series includes sustainability-focused indices, such as the S&P World Scored & Screened Index, leveraging S&P DJI’s world-class sustainability datasets.

The S&P World Index is relevant to the passive investing conversation, as historic data suggest it’s difficult to outperform. SPIVA® (S&P Indices Versus Active) U.S. Year-End 2024 Scorecard results show that over the past 15 years, the S&P World Index has performed better than 92.5% of the actively managed funds that aim to beat it, which is even higher than the 89.5% outperformance rate of the S&P 500.

In conclusion, the S&P World Index provides comprehensive coverage of developed market equities and is a world-class benchmark backed by the highest standards of quality and integrity offered by S&P DJI. In an upcoming blog, we will showcase the S&P World Ex-U.S. Index and its outperformance of U.S. equities during the start of 2025.

The posts on this blog are opinions, not advice. Please read our Disclaimers.

Navigating the Global Index Landscape amid Tariff Volatility

Contributor Image
Michael Brower

Former Associate Director, Index Investment Strategy

S&P Dow Jones Indices

In an environment of rapidly evolving trade conditions, understanding the nuances of index performance across countries is essential. As trade policies fluctuate and central banks carefully evaluate the economic outlook, the repercussions for markets and global commerce may be significant.

Reflecting on the past couple of years, it is noteworthy that the 12-month total return differential between the S&P United States LargeMidCap and the S&P World ex-U.S. Index turned negative in March 2025 for the first time since October 2023, marking a notable shift from the 20% difference in 2024, a period characterized by strong performance for U.S. equities. This recent change not only highlights the evolving landscape of global indices but also emphasizes the importance of closely monitoring international market trends, as they can have substantial implications for growth trajectories.

The wavering of U.S. stocks is no less apparent when compared to a titan on the other side of the globe. In both 2024 and YTD 2025, the S&P China BMI outperformed the S&P Emerging Ex-China BMI by a wide margin, a significant reversal from 2023 when it underperformed by 33%.

Shifting our focus from performance to risk, we see a continuation of diversification benefits witnessed in the past for both U.S. and Chinese equities. In Exhibit 3, we calculate the trailing 12-month volatility differential between the S&P World Index and S&P World Ex-U.S. Index, and the S&P Emerging BMI and S&P Emerging Ex-China BMI, respectively. When the spread was positive, the inclusion of a country increased the volatility in the benchmark. When the spread was negative, the country acted as a volatility diversifier. Notably, both the U.S. and China have continued to be volatility diversifiers in 2025 (see Exhibit 3).1

As we consider these diversification characteristics, it’s important to recognize that the current shift in trade protectionism may signal a change in market dynamics for U.S. equities. By leveraging a comprehensive toolkit, different combinations of equity indices, such as hypothetically blending the S&P United States LargeMidCap with the S&P World Ex-U.S. Index and S&P China BMI with the S&P Emerging Ex-China BMI, could produce a different risk/return profile. Exhibit 4 displays the risk/return tradeoff of these combinations over the last year.

In summary, thoughtful approaches could be increasingly important for global investors seeking to harness opportunities and mitigate risks in today’s complex landscape. By better understanding the potential benefits of country diversification, market participants can make more informed decisions as they seek to navigate these dynamics.

The author would like to thank Benedek Vörös for his contributions to this post.

1  We recognize that the U.S. represents more than 70% of the S&P World Index. Nonetheless, it’s essential to highlight that this U.S. segment is made up of large multinational corporations whose revenue sources extend across multiple regions.

The posts on this blog are opinions, not advice. Please read our Disclaimers.

Applying Nobel Prize-Winning Volatility Research to the S&P 500

In  unpredictable markets, the ability to more accurately model and predict volatility may offer unique benefits when applied to indices used in insurance and structured products. Learn how the S&P 500 Engle Indices measure dynamic exposure to the S&P 500 while applying a predictive volatility control mechanism, which employs a variation of the GARCH model inspired by the research of Nobel Laureate Robert F. Engle. 

The posts on this blog are opinions, not advice. Please read our Disclaimers.

Macro Madness

Contributor Image
Anu Ganti

Head of U.S. Index Investment Strategy

S&P Dow Jones Indices

While U.S. basketball fans have been in the midst of March Madness, there has been no shortage of activity in global markets. Uncertainty over the policies from the new U.S. Presidential administration, stagflation concerns and, particularly, tariffs have weighed on investor sentiment, with the S&P 500® down 4% in Q1. While fans analyze various teams to pick their brackets, what indicators are available to equity investors when making sector weighting decisions? With all eyes on the 10-Year Treasury yield, the U.S. dollar and crude oil, understanding the evolving relationship of sectors to bonds, currencies and commodities may prove timely in an environment of heightened macro concerns. 

Though March Madness teams have been narrowed from the Elite Eight to the Final Four, we can begin our analysis by sampling 2 of the 11 GICS® sectors—the traditionally defensive Utilities sector and the cyclical Consumer Discretionary sector. Consumer Discretionary is particularly germane to market participants as it contains the Automobiles industry group, an industry that may be especially pressured by the recent announcement of auto tariffs. We calculated the historical six-month correlations of the excess returns of the S&P 500 Utilities and S&P 500 Consumer Discretionary, up 5% and down 14% YTD, respectively, versus the S&P U.S. Treasury Bond Current 10-Year Index, S&P U.S. Dollar Futures Index, and S&P GSCI Crude Oil.

Consistent with its defensive nature, Exhibit 1 shows that Utilities has tended to exhibit a strong positive correlation with bonds historically, while rate-sensitive Consumer Discretionary has had a more complex relationship. Positive correlations can arise, for example, due to an increase in yields, which may lead to a decline in spending as borrowing costs increase for consumers. On the other hand, negative correlations can occur during market downturns like we’ve seen recently, when risk-averse investors might reduce their exposure to the sector and turn toward safe havens like Treasuries. Consumer Discretionary currently has a slight positive correlation with the S&P U.S. Treasury Bond Current 10-Year Index, which is up 4% YTD.

Turning to the impact of currency movements on these sectors, with the S&P U.S. Dollar Futures Index down 3% YTD, the relationship of the U.S. dollar versus Utilities and Consumer Discretionary has oscillated over time, with both recently displaying a slight negative correlation. A weaker dollar can arise as a consequence of lower interest rates, which can aid in reducing borrowing costs for these sectors. Multi-national companies within Consumer Discretionary may further benefit from the translation effect of a weaker currency. But as both sectors generate most of their revenues domestically, a stronger dollar may also benefit domestically oriented companies.

Consistent with their recent negative association with the dollar, Utilities and Consumer Discretionary also demonstrate a negative relationship with crude oil prices, as rising commodity prices can raise input costs for companies within these sectors. An additional headwind for Consumer Discretionary could be the potential reduction in disposable income from higher consumer costs. The S&P GSCI Crude Oil is up 3% YTD.

The historical fluctuation of sector performance versus Treasuries, the dollar and crude oil spans beyond these two sectors. Exhibit 4 displays the correlations of excess returns across S&P 500 sectors versus each of these macro factors, which in many cases have differed significantly from their long-term averages since 2001.

Just as sports fans put their knowledge of basketball teams to the test as they approach the end of March Madness, understanding the nuances of sector movements versus bonds, currencies and commodities may prove useful when navigating market turbulence as we approach the beginning of Q2.

The posts on this blog are opinions, not advice. Please read our Disclaimers.

U.S. Homeland Securities – Selecting Firms with U.S.-Centric Revenue

Contributor Image
Luca Ramotti

Associate Director, Thematic Indices

S&P Dow Jones Indices

The S&P 500® has long been seen as the gauge for U.S. large-cap equities. Market participants seeking broader global exposure often turn to developed market indices, like the S&P World Index. However, over the past decade, developed market benchmarks have seen a notable shift: U.S.-domiciled stocks have increased their weight substantially, representing 72% of the S&P World Index as of year-end 2024 (see Exhibit 1).

Truly U.S.?

This trend highlights the growing importance of the U.S. in the global market and is a consequence of the strong performance of the U.S. market in recent years. Yet, this raises an important question—how global is U.S. exposure, really? And, conversely, how much of it comes from the U.S.? Analyzing revenue streams from companies in The 500™ reveals an international dimension. With less than 60% of revenue in The 500 generated domestically, international markets represent a material revenue source.

Presenting the S&P 500 U.S. Revenue Leaders Index

To limit global exposure and provide a more precise representation of U.S. domestic revenue-driven companies, we recently launched the S&P 500 U.S. Revenue Leaders Index. This index focuses on where companies generate their revenue, including only those that derive at least 50% of their revenue from domestic sources.

Sector Difference

An interesting feature of this index is its weighting scheme. The S&P 500 U.S. Revenue Leaders Index rebalances quarterly, in line with its benchmark, but unlike The 500, the index utilizes a modified float-adjusted market capitalization weighting, with sector weights constrained to +/-5% compared to the benchmark.

This is because the level of domestic revenue generation varies significantly across different GICS® sectors. For instance, the Utilities sector is unsurprisingly domestic focused, with companies generating almost the entirety of their revenues in the U.S., whereas Information Technology and Materials companies have more global operations, with domestic revenues representing only 44% and 48% of their revenues, respectively.

This differentiation necessitates the use of sector weight constraints to maintain the proportional representation of sectors broadly in line with The 500, reducing the disproportionate impact of any specific underweighted or overweighted sector.

Introducing sector weight constraints allows for a reduction of the active weight difference compared to The 500 and provides a more useful comparison to its benchmark, as well as a more accurate representation of the U.S. economy. By limiting sector weight variations, the index guards against disproportionate influence from any single sector. Comparing the sector weights at the end of March 2025, we observe that Information Technology and Communication Services were underweighted in the S&P 500 U.S. Revenue Leaders Index, whereas Health Care and Financials were more prominently represented (see Exhibit 5).

Conclusion

The S&P 500 U.S. Revenue Leaders Index tracks large-cap U.S. companies with at least 50% of their revenue exposure to the U.S. The index focuses on domestic economic activities, catering to those seeking more focused U.S. economic view. By employing sector-specific constraints, the index balances a higher exposure to more domestically focused sectors with maintaining a similar risk and performance profile to the benchmark.

The posts on this blog are opinions, not advice. Please read our Disclaimers.