The S&P SmallCap 600® celebrated its birthday last week, marking 27 years since its launch on Oct. 28, 1994. Designed to reflect the performance of small-cap U.S. equities, the index’s cumulative total returns have been affected by trends and narratives impacting the equities segment, historically.
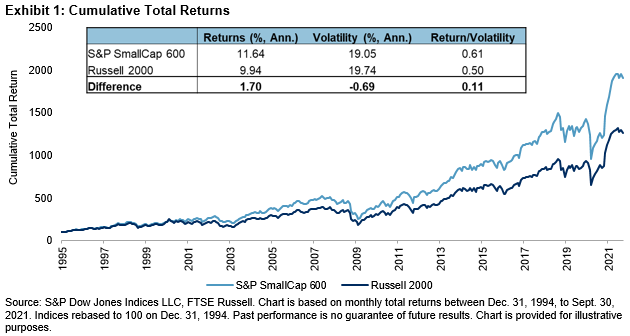
For example, Exhibit 1 shows that the S&P 600™ was affected by the so-called COVID-19 correction in 2020 and the subsequent rebound. The strength of the index’s rebound since Q4 2020 meant that its 59.5% total return since its last birthday was its highest figure, ever—quite the birthday present!

A key reason for the strength of the S&P 600’s rebound in the past 12 months is its greater sensitivity to U.S. macroeconomic variables, as many investors revised upwards their economic projections amid vaccine announcements and the subsequent rollout. As Exhibit 2 shows, smaller companies are typically more domestically focused in their revenue exposures, which helps to explain why the S&P 600’s returns have been more correlated to changes in U.S. GDP growth and consumption and investment, historically.

Some market participants might view small-caps as a relatively inefficient asset class more suited to the endeavors of active managers. However, data from our SPIVA® Scorecards suggests otherwise: most U.S. small-cap active managers underperformed the S&P 600 in 14 of the past 20 full calendar-year periods.
Our SPIVA U.S. Mid-Year 2021 Scorecard results also made for disappointing reading for those thinking that recent market movements would have offered a more favorable environment for active managers, as 78% of U.S. small-cap active funds underperformed the S&P 600 in the 12-month period ending June 30, 2021. The equivalent figure over the three-year horizon was 54.8% and underperformance increased to 66.7%, 83.5%, and 93.8% over the 5-, 10-, and 20-year horizons, respectively.

Additionally, the S&P 600 has typically been a harder benchmark to beat than the Russell 2000, another index designed to represent the performance of small-cap U.S. equities. As we have written about before, unlike the Russell 2000, the S&P 600 employs an earnings screen and the resulting quality exposure has contributed to its outperformance, historically. More recently, differences in sector weights and constituent composition helped to explain the S&P 600’s relative returns in 2020 and its sector-led bounce back so far in 2021. In short, index construction matters!

Finally, the breadth and depth of the U.S. equity market means that the S&P 600, its returns, and its characteristics may be relevant to investors around the world. As with portion sizes, what is smaller in the U.S. is larger elsewhere. For example, Exhibit 5 demonstrates that the float market capitalization of S&P 600 constituents is equivalent to that of several countries in the S&P Global BMI. Hence, having a view on U.S. small-cap equities may be as helpful for explaining global equity returns as understanding the trends and narratives affecting those countries.

The posts on this blog are opinions, not advice. Please read our Disclaimers.