Ric Edelman, Founder of RIA Digital Assets Council, explores the new economy, its potential sources of growth, and the importance of “future proofing” client strategies.
The posts on this blog are opinions, not advice. Please read our Disclaimers.Why Disruptive Innovation Matters to Advisors
Navigating Climate Risk with Indices
The Good Days of Yesteryear
Introducing the S&P Transportation Select Industry FMC Capped Index
Examining the Performance and Sector Diversification of the S&P BSE SENSEX 50
Why Disruptive Innovation Matters to Advisors
Navigating Climate Risk with Indices
How can indices bring greater transparency to climate risk? Designed to go beyond the requirements of EU Low Carbon Benchmark minimum standards, the S&P Paris-Aligned & Climate Transition Indices were created to help market participants looking to chart a path to net zero by 2050.
The posts on this blog are opinions, not advice. Please read our Disclaimers.
The Good Days of Yesteryear

With the S&P/TSX Composite Index up 16% YTD through June 17, 2021, the Canadian equity market seems to have put the pandemic in the rearview mirror. In this environment, predictably, the S&P/TSX Composite Low Volatility Index underperformed, up 11% over the same period. One-year volatility levels (no longer capturing the uncontrolled panic at the onset of the pandemic) have dropped significantly across all sectors of the market, and are now back to levels similar to those of February 2020.
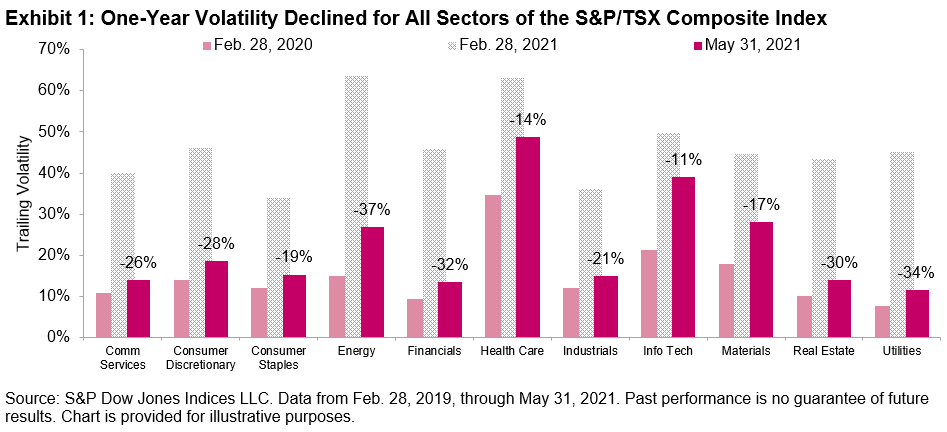
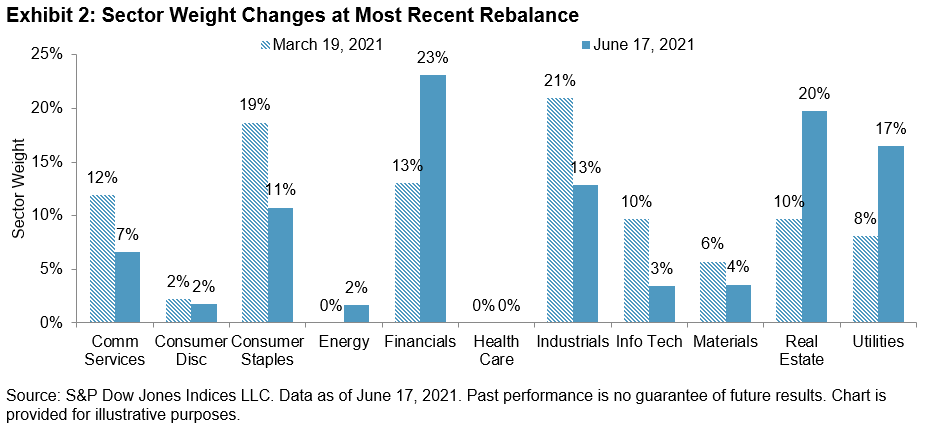
Volatility at the sector level provides a good proxy for the weight shifts in the latest rebalance for the S&P/TSX Composite Low Volatility Index effective following the close of trading on June 18, 2021. Not surprisingly, shifts in sector weights were significant. The historical stalwarts in the index resumed their substantial weighting, with Financials, Real Estate, and Utilities making up the three largest sectors. Communication Services and Information Technology, sectors that became a lot more relevant in the context of a lockdown, have scaled back significantly. Health Care, the sector with the highest volatility, still holds no weight in the index.
The posts on this blog are opinions, not advice. Please read our Disclaimers.
Introducing the S&P Transportation Select Industry FMC Capped Index

- Categories Equities
- Tags Air Freight & Logistics, Airlines, Airport Services, Dow Jones Transportation Average, Highways & Rail Tracks, infrastructure, Marine, Marine Ports & Services, Railroads, S&P Transportation Select FMC Capped Index, S&P Transportation Select Industry Index, transportation, transportation industry group, Trucking
The Transportation industry group1 provides transportation infrastructure as well as services to move people or goods. To track the industry group’s performance, S&P Dow Jones Indices offers the S&P Transportation Select Industry Index, S&P Transportation Select Industry FMC Index, and the Dow Jones Transportation Average. To address potential weight concentration issues in the FMC-weighted index, S&P Transportation Select Industry FMC Capped Index was launched on April 26, 2021. In this blog, we introduce this new index.
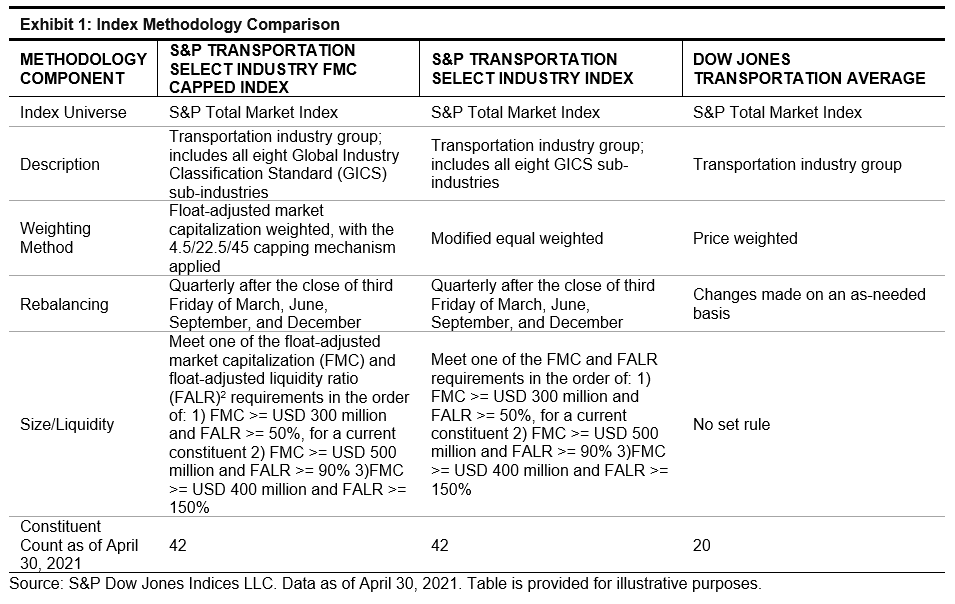
Exhibit 1 shows the methodology comparison of the S&P Transportation Select Industry FMC Capped Index, S&P Transportation Select Industry Index, and Dow Jones Transportation Average.
Universe
The S&P Transportation Select Industry FMC Capped Index includes all the sub-industries of the Transportation industry group—Air Freight & Logistics, Airlines, Airport Services, Highways & Rail Tracks, Marine, Marine Ports & Services, Railroads, and Trucking—in the S&P Total Market Index universe.
Size and Liquidity Criteria
The eligible stocks need to meet the float-adjusted market capitalization (FMC) and float-adjusted liquidity ratio (FALR) requirements, as shown in Exhibit 1.
FMC Weighted with Capping
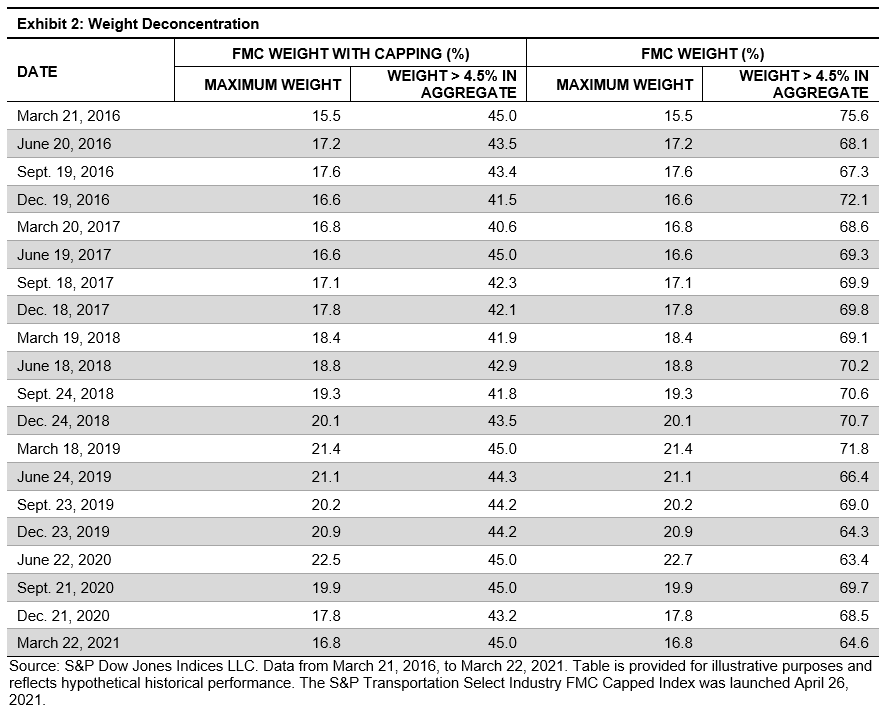
The S&P Transportation Select Industry FMC Capped Index is float-adjusted market cap weighted, subject to 4.5/22.5/45 capping at rebalance dates. That is, an individual constituent weight is capped at 22.5% and the aggregate weight of constituents that individually have a weight greater than 4.5% is capped at 45%. The purpose of capping is to reduce weight concentration in any single security and top holdings.
Exhibit 2 shows the weights at rebalance dates for S&P Transportation Select Industry FMC Capped Index and the corresponding FMC weights if there is no capping applied. The exhibit shows that the capping scheme reduced the concentration of the FMC weight historically.
Large Investable Capacity
The FMC capped index offers large investable capacity. Our analysis shows that even with a hypothetical fund size of USD 20 billion, all constituent holdings would still be below 5% of their corresponding FMC (see Exhibit 3).
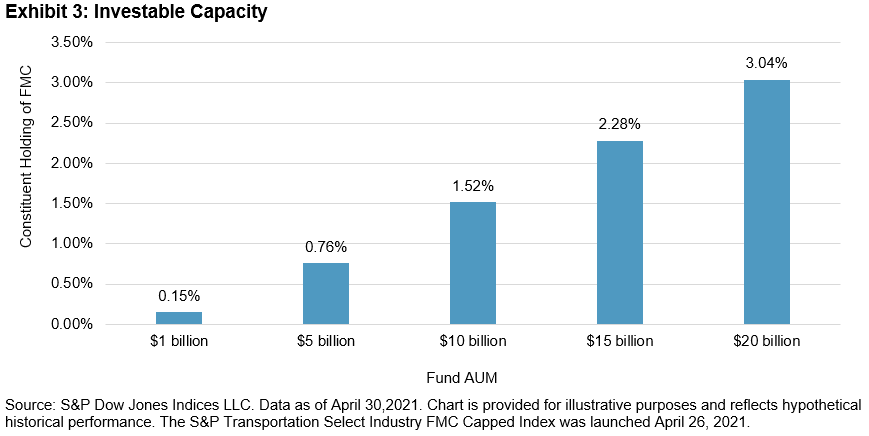
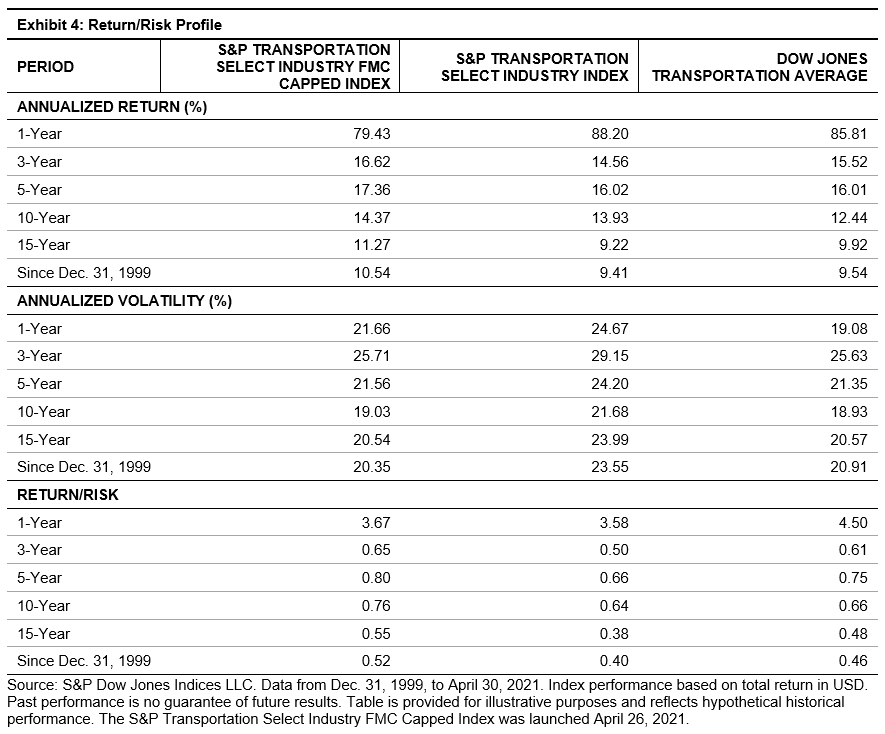
Exhibit 4 illustrates the return/risk performance of the S&P Transportation Select Industry FMC Capped Index, the S&P Transportation Select Industry Index, and the Dow Jones Transportation Average Index. The FMC capped index outperformed the other two indices in terms of absolute return and risk3-adjusted return during all other periods except the most recent one-year period.
Conclusion
The S&P Transportation Select FMC Capped Index is designed to track the performance of the transportation industry group and aims to reduce weight concentration issues by applying 22.5/4.5/45 capping. Our analysis shows that this index has a large investable capacity. Moreover, the index has comparable performance with other transportation indices such as the S&P Transportation Select Industry Index and the Dow Jones Transportation Average.
1 The GICS® classification standard is used to classify a company by its principal business activity. Each company is assigned to a sub-industry, an industry, an industry group, and a sector.
2 FALR is defined as dollar value traded over the previous 12 months divided by the FMC as of the rebalancing reference date.
3 Risk is calculated as annualized standard deviation of monthly total returns.
The posts on this blog are opinions, not advice. Please read our Disclaimers.Examining the Performance and Sector Diversification of the S&P BSE SENSEX 50

- Categories India
- Tags India, Indian equities, Indian sectors, S&P BSE SENSEX 50
The S&P BSE SENSEX 50 is designed to measure the performance of the top 50 largest and most liquid companies in India. The index constituents are weighted based on their float-adjusted market cap and must have a minimum annualized trading value of INR 10 billion. The S&P BSE SENSEX 50 is a highly diversified index, and its 50 constituents provide exposure to all 10 major sectors: Utilities, Telecommunication Services, Information Technology, Industrials, Healthcare, Fast-Moving Consumer Goods (FMCG), Finance, Energy, Consumer Discretionary, and Basic Materials.
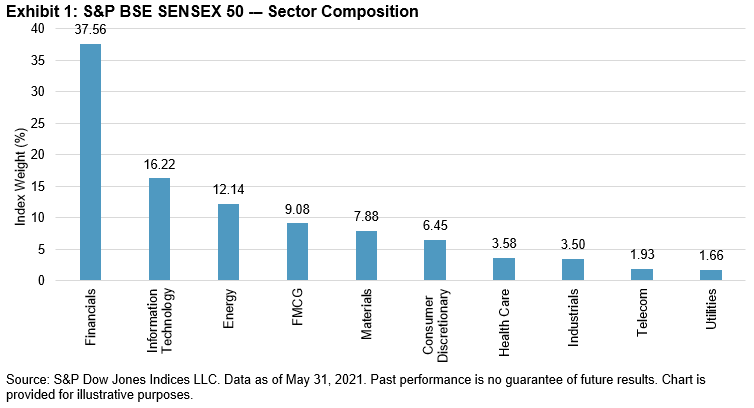
Exhibit 1 presents a pictorial representation showing the weight of the 10 sectors of S&P BSE SENSEX 50, as of May 31, 2021. We can see that the Financials and Information Technology sectors had the highest representation, at 37.56% and 16.22%, respectively, while the Telecommunications and Utilities sectors had the least representation, at 1.93% and 1.66%, respectively.
The returns of the S&P BSE SENSEX 50 have been promising over the past 10 years. The total returns index value has gone up from 6,095.76 on May 31, 2011, to 20,092.21 on May 31, 2021, reflecting an absolute return of 230%.
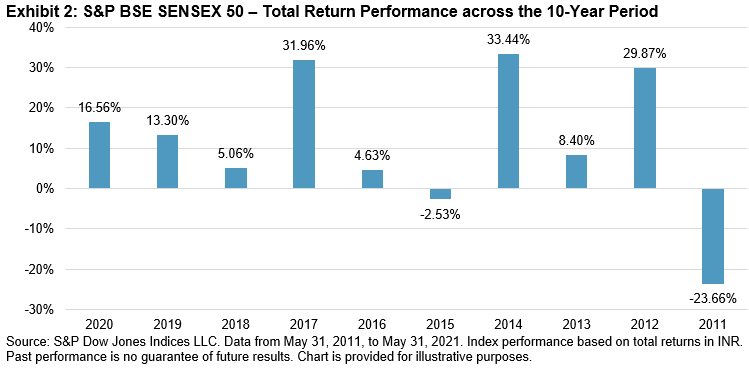
From Exhibit 2, we can see that in 8 out of 10 calendar years, the S&P BSE SENSEX 50 posted positive returns. The highest total returns of 33.44%, 31.96, and 29.87% occurred during 2014, 2017, and 2011, respectively. 2011 was the only year during which the index posted a significant negative return of -23.66%.

Exhibit 3 shows the annualized risk/return profile of the S&P BSE SENSEX 50 for 3-, 5-, and 10-year periods. Overall, the index’s returns were promising across all periods observed.
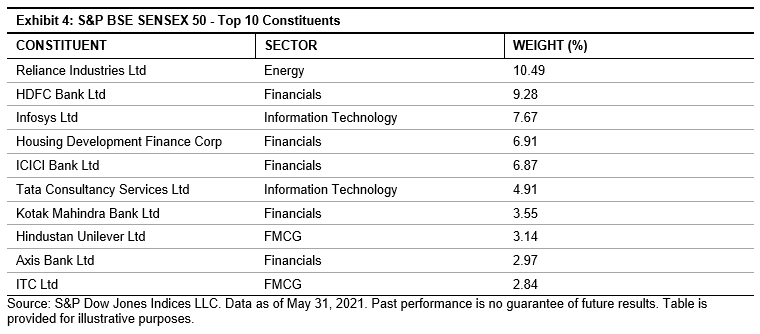
Exhibit 4 shows the top 10 constituents of the S&P BSE SENSEX 50 along with their corresponding sectors. We can see that Reliance Industries Ltd holds the highest weight, at 10.49%, followed by HDFC Bank Ltd at 9.28%. Furthermore, 4 of the 10 major sectors are well represented in the top 10 list.
To summarize, we can state that the S&P BSE SENSEX 50 is a well-diversified, liquid index that has a history of strong performance over the past decade.
The posts on this blog are opinions, not advice. Please read our Disclaimers.


