Get Indexology® Blog updates via email.

In This List

The S&P Europe 350 ESG Index – The European Benchmark for ESG-Focused Investors

A Return to Normalcy?

Concentrating on Technology

Deciphering Decrement Indices

Political Risk: Why It Matters

The S&P Europe 350 ESG Index – The European Benchmark for ESG-Focused Investors

Contributor Image
Jaspreet Duhra

Managing Director, Global Head of Sustainability Indices

S&P Dow Jones Indices

The S&P ESG Index Series is aimed toward those who are looking to incorporate environmental, social, and governance (ESG) considerations into their investment products. These indices seek to provide similar overall industry group weights as their underlying index while simultaneously offering an enhanced ESG profile.

Within the European equities market, the S&P Europe 350 ESG Index is designed to measure the constituents that meet sustainability criteria from the headline S&P Europe 350®, which tracks 16 major European markets and covers approximately 70% of the region’s market capitalization. The S&P Europe 350 ESG Index is a unique strategy, designed for the ESG-conscious investor seeking broad market exposure in Europe through an index that is efficient to replicate.

How Is the S&P Europe 350 ESG Index Constructed?

The first step is to apply exclusions focused on business activities (controversial weapons, tobacco, thermal coal), ESG scores, and United National Global Compact (UNGC) scores. The remaining eligible companies are ordered by S&P DJI ESG Score within their GICS® industry groups, and constituents are selected targeting 75% of the market capitalization in each S&P Europe 350 industry group.

Please see the index methodology for a full breakdown of the index construction rules.

Why Choose the S&P Europe 350 ESG Index?

  • The S&P Europe 350 ESG Index utilizes both ESG screens and ESG scores. This is an established methodology that resonates with the European market—almost 70% of the more than USD 4 billion invested in the S&P 500® ESG Index, which uses the same methodology, is invested in products listed in Europe.
  • The index uses market-leading S&P Global ESG datasets that are built on a foundation of hundreds of ESG data points collected from public sources, as well as direct company dialogue. Companies are assessed against unique ESG surveys for 61 industries, based on salient ESG risks and opportunities.
  • S&P Global Media & Stakeholder Analysis (MSA)—an ongoing ESG controversy monitoring ensures any constituent that experiences a significant ESG incident between rebalances can quickly be removed from the S&P Europe 350 ESG Index.
  • The methodology incorporates E&S characteristics (via S&P DJI ESG Scores) and proxies for good governance (i.e., companies with low UNGC scores are excluded and controversies monitoring using the MSA) and therefore potentially aligns with Article 8 of the EU Sustainable Finance Disclosure Regulation.

Why Incorporate S&P DJI ESG Scores?

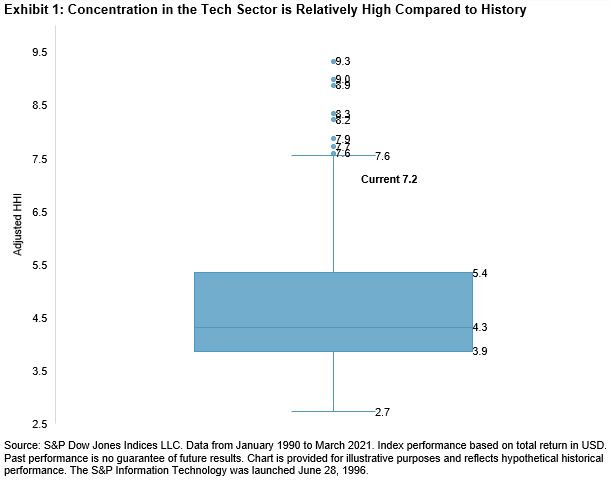
The results of the April 2021 index rebalance emphasize the importance of incorporating S&P DJI ESG Scores into the index methodology. Seven of the top 10 constituent exclusions were due to ESG scores (see Exhibit 1).

For instance, Novo Nordisk has had a deteriorating ESG score over the past few years, decreasing from 98 in 2018 down to a score of 69 in 2020. Notable areas of material weakness for the company are human capital development and innovation management.

The S&P Europe 350 ESG Index had 246 constituents as of April 2021, as companies with low-ESG scores or those companies conducting business activities which are not consistent with ESG norms from the underlying index were excluded. The index offers an improved S&P DJI ESG Score of 6.85%* over the benchmark, as well as a low tracking error of 1.04%. The result is a broad European index that incorporates robust ESG objectives for sustainably conscious investors.


* ESG Score Improvement is calculated as the difference between the index-level ESG score of the ESG index and the index-level ESG score of its underlying index.

The posts on this blog are opinions, not advice. Please read our Disclaimers.

A Return to Normalcy?

Contributor Image
Fei Mei Chan

Former Director, Core Product Management

S&P Dow Jones Indices

The onset of the COVID-19 pandemic a year ago produced the highest-ever monthly volatility reading for the S&P 500® in March 2020. Volatility began to decline as the market’s recovery began, but if we measure volatility on a 12-month trailing basis, as we do in Exhibit 1, we see the sustained impact of last year’s ructions.

Not only is overall market volatility now close to pre-pandemic levels, the same seems to be true for all sectors of the S&P 500. Exhibit 2 shows that one-year volatility declined significantly in every sector compared to three months earlier. While volatility in all sectors declined by at least 10%, the biggest drops came in Energy, Financials, and Utilities, which declined by approximately 20%.

Significant changes also took place in the latest rebalance for the S&P 500 Low Volatility Index, effective after market close May 21, 2021. The new allocation, as shown in Exhibit 3, is much closer to the allocations of pre-pandemic times. Stalwarts like Financials, Real Estate, and Utilities resumed their places in the index; Utilities added 11% to its weight. Health Care, Communication Services, and Technology (sectors that were the lifelines of locked-down livelihoods) scaled back to make room. Energy’s volatility remained too high to make the cut. In all, 34 names changed in the index, the largest change since the record rebalance of May 2020.

The S&P 500 Low Volatility Index chooses its constituents based on volatility at the stock level, but sector level volatility can give us insight into the dynamics that drive the changes. Hopefully, in this instance, sector volatility is also a narrative of better things to come.

The posts on this blog are opinions, not advice. Please read our Disclaimers.

Concentrating on Technology

Contributor Image
Anu Ganti

U.S. Head of Index Investment Strategy

S&P Dow Jones Indices

After the dominant performance of large-cap technology stocks in 2020, concentration concerns naturally come to mind. The HHI, or Herfindahl-Hirschman Index, is a widely-used concentration measure; it’s defined as the sum of the squared index constituents’ percentage weights (usually taken as whole numbers). For example, the HHI for an equally-weighted 50 stock portfolio is 200 (50 x 22); the HHI for the S&P 500 Equal Weight Index, which comprises 500 stocks, is 20 (500 x 0.22).

Other things equal, a higher HHI indicates an increased level of concentration, but as the simple illustration above shows, even for completely unconcentrated equal weight portfolios, the HHI level is inversely related to the number of names. So as we use the HHI to make comparisons within the Tech sector over time, we need to use an adjusted metric. The adjusted HHI is the sector’s HHI divided by the HHI of an equal-weighted portfolio with the same number of stocks. A higher adjusted HHI means that a sector is becoming more concentrated, independently of the number of stocks it contains.

Exhibit 1 shows a box-plot of the S&P 500 Information Technology’s adjusted HHI, using monthly observations since January 1990. We observe a median value of 4.3, interquartile range from 3.9 to 5.4, minimum of 2.7, and eight large outliers. Interestingly, the current adjusted HHI level of 7.2 is at the 95th percentile, indicating a historically high level of concentration for the Technology sector.

Exhibit 2 illustrates the relationship between the Tech sector’s adjusted HHI with the relative performance of the S&P 500 Equal Weight Information Technology compared to its cap-weighted counterpart. After peaks in concentration (such as during 1990, 1999, and 2002), equal-weighted Tech seems to outperform.

Another way to understand the relationship between concentration and relative performance is to plot the change in Tech’s adjusted HHI versus equal-weighted Tech’s relative performance (see Exhibit 3). We observe a positive relationship between concentration and subsequent performance of equal weighting within Tech, with an R2 of 0.4. 

The strong performance of large-cap Tech names last year led to an increase in the sector’s concentration levels.  History tells us that after peaks in concentration, equal-weighted Tech has tended to outperform. We can look to history to provide perspective on these trends.


The posts on this blog are opinions, not advice. Please read our Disclaimers.

Deciphering Decrement Indices

Low interest rates and dividend risk are two challenges commonly faced by equity-linked structured products. Explore how the design of S&P DJI’s range of decrement indices could help address these challenges and potentially deliver more favorable terms for structured products.

The posts on this blog are opinions, not advice. Please read our Disclaimers.

Political Risk: Why It Matters

Contributor Image
Laura Assis

Former Analyst, Global Research & Design

S&P Dow Jones Indices

International opportunities to diversify equity allocations are increasing, along with globalization, and as a result, political risk matters now more than ever. More so, the interplay of macroeconomic policymaking and government instability continues to have far-reaching effects in political risk, augmenting the uncertainty that goes hand in hand with allocating to emerging markets.

Mindful of this, S&P Dow Jones Indices collaborated with GeoQuant, an AI-driven political risk data firm, to devise the Emerging Markets Political Risk-Tilted Concept Index (hereafter the “Concept Index”).

Offering a reduced-political-risk alternative to the exposure of the S&P Emerging BMI, the Risk-Tilted Concept Index overweights (underweights) countries with relatively low (high) political risk, leading to higher cumulative returns during the back-tested period (see Exhibit 1).1 Allocation decisions are made in accordance with GeoQuant’s custom “Macro-Government Risk Indicator,” which assesses both the riskiness of policies derived from macroeconomic management and the uncertainty around the capacity of incumbent governments.

GeoQuant’s “Macro-Government Risk Indicator” is a weighted combination of macro-economic policy risk and government risk. In Exhibit 2 we can note the inverse correlation between a weighted cross-country aggregate of the indicator (r = -0.27) and the S&P Emerging BMI. This shows the inverse relationship between rising political risk and declining index performance. In fact, a sharp increase in macro-government risk from 2014 to 2015 among several high-weight countries (Taiwan, Brazil, and Russia) in the S&P Emerging BMI coincides with the largest drawdown from the benchmark index.

By incorporating political risk as a factor in emerging market allocation decisions, the Concept Index outperformed the S&P Emerging BMI while exhibiting lower volatility. The outperformance was mainly driven by mitigating losses in down markets. The Concept Index maintained a low annualized tracking error of 2.03% and a monthly average turnover of 1.84%, similar to the 1.65% of the benchmark. In fact, the risk/return characteristics presented in Exhibit 3 confirm that tilting the Concept Index according to countries’ relative political risk levels helped it to outperform the benchmark across the short and long term.

The ability of the Concept Index to decrease drawdown severity is noteworthy. Furthermore, it has the potential to hedge returns against unfavorable market conditions faster than with traditional methods, accomplished by controlling the downside.

Between 2013 and 2020, whenever the benchmark exhibited negative monthly returns, the Concept Index outperformed its benchmark 70% of the time. Moreover, the largest drawdown of the S&P Emerging BMI was -28.27%, compared to -26.13% for the Concept Index.

Incorporating political risk in allocation decisions can yield outperformance through lower volatility and higher returns. The Concept Index provides market participants with new tools to measure and assess the impact of political risk and to adapt equity allocation decisions accordingly.

To learn more about how political risk affects emerging market equities, see our paper Political Risk and Emerging Market Equities: Applications in an Index Framework.

1 The “Macro-Government Risk Indicator” covers 22 of the 26 total countries included in the S&P Emerging BMI between 2013 and 2020. The four countries not covered by the indicator are Czech Republic, Greece, Kuwait, and Morocco. The first three countries have a combined weight of 0.99% in the S&P Emerging BMI as of December 2020; Morocco has not been included the benchmark index since Q4 2015. The countries not covered are kept neutral to their weights in the S&P Emerging BMI.

The posts on this blog are opinions, not advice. Please read our Disclaimers.