Get Indexology® Blog updates via email.

In This List

S&P 400 and S&P 600: Why Consider

Bitcoin’s Rise Reminiscent of U.S. Gold Rush

Latin American Equities Close the Year in the Red Despite the Strongest Q4 in 20 Years

Global Islamic Indices Advanced 28% YTD, Outperforming Conventional Benchmarks up to 12%

Manage Drawdown and Recovery with Dynamic Allocation

S&P 400 and S&P 600: Why Consider

Contributor Image
Erika Toth

Director, Institutional & Advisory, Eastern Canada

BMO Asset Management

Most investors are familiar with the S&P 500 index. Its mid and small cap counterparts, the S&P 400 and S&P 600 don’t get quite the same coverage in the financial press. Yet these are powerful tools that must not be overlooked.

1. Diversification of the Indices

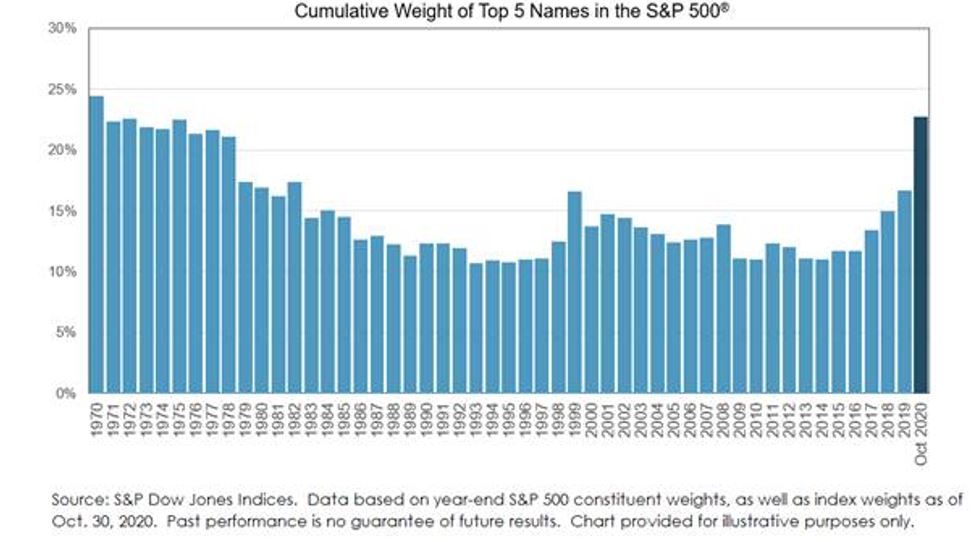
2020 was indeed a peculiar year for US equities. As the virus brought on volatility, the recovery in equity market indexes was uneven – and largely driven by a handful of mega-cap companies. If we look at the S&P 500 in particular, the level of concentration in the top 5 names is now the highest it has been in 40 years (20.19% as of December 31, 2020). It is interesting to note that between the 1970’s and today, the highest level of concentration reached was in December 1999, prior to the tech bubble burst.

An important implication is that the S&P 400 and 600 index returns are less reliant on a handful of names, and may therefore be an effective tool for diversifying US equity exposure.

2. Historical Performance

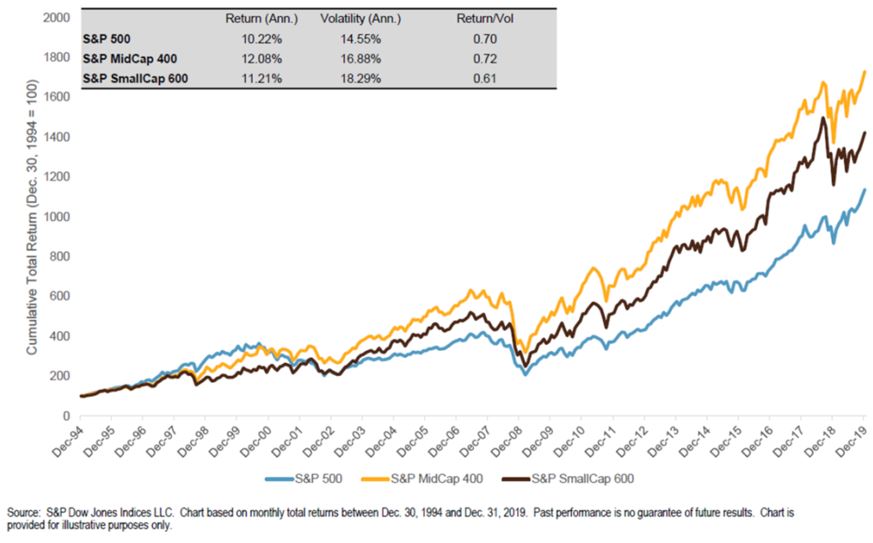
Looking at very long term time periods, small and mid-size indexes have demonstrated superior performance when compared to large-cap only. 25 years of data show an outperformance of 186 basis points per year (S&P 400) and 99 basis points per year (S&P 600) compared to the S&P 500.

3. Why Consider These Indexes Now?

Small and medium sized businesses have been disproportionately impacted by the pandemic, and have lagged in recent years, but may present greater growth opportunities for long term investors moving forward. These mid and small cap indexes may be posed to benefit from “re-opening” and possible M&A activity ahead of us.

The S&P 400 and 600 have historically had a higher correlation to a number of economic indicators (GDP growth, investment and consumption growth). As the re-opening becomes more broad-based, if consistent with such higher correlations, these indexes may provide a higher beta, leading to outperformance versus the S&P 500.

These indexes can also serve as a complement to the S&P 500. While the 500 provides good exposure to big tech and healthcare, the 400 and the 600 provide a heavier weighting towards industrials, real estate, financials and consumer discretionary sectors – pro cyclical sectors that possibly stand to do well as the economy as a whole recovers.

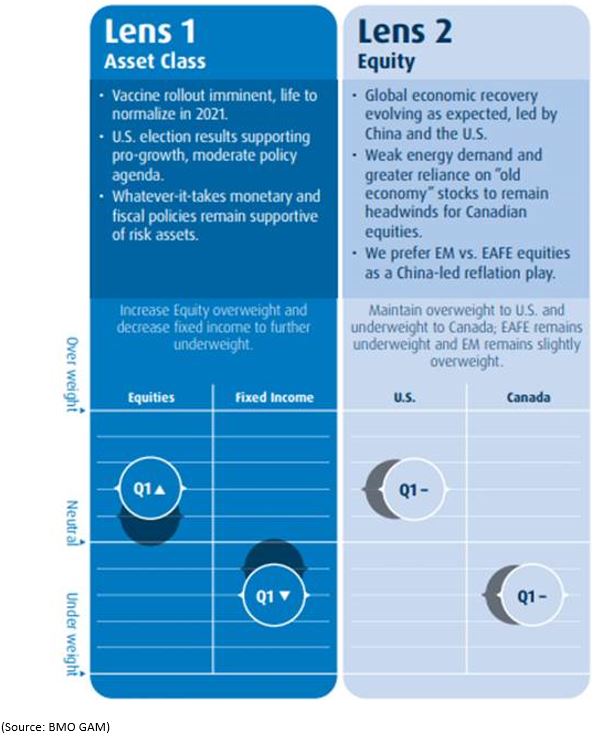
In the final quarter of 2020, BMO GAM’s Multi Asset Strategy Team (MAST) increased their overweight to equities versus fixed income based on the imminent rollout of vaccines and “Whatever-it-takes” monetary and fiscal policies supportive of risk assets. We maintained an overweight to US equities, and increased our portfolio beta by overweighting small cap equities on vaccine optimism. We expect these themes to continue into 2021.

Join BMO on Wednesday, February 3rd for our Virtual ETF Economic Forum, and hear from expert panels on Fixed Income, Equities, and Innovation in ETFs. They will share comprehensive research and actionable ideas to position your clients for the future.

The posts on this blog are opinions, not advice. Please read our Disclaimers.

Bitcoin’s Rise Reminiscent of U.S. Gold Rush

Contributor Image
Jim Wiederhold

Former Director, Commodities and Real Assets

S&P Dow Jones Indices

The recent enthusiasm for Bitcoin is reminiscent of the Gold Rush in the western U.S. from 1848-1860. With fits and starts, U.S. enthusiasm for gold exploded over this time period. Gold was the most popular safe haven and store of value in the 19th century. Viewed as one of the least volatile commodities, gold prices during that time were surprisingly tepid in comparison to the current, highly volatile moves from Bitcoin. Less liquid than other established stores of value, Bitcoin’s recent move has been parabolic in nature, as seen in Exhibit 1.

Recently, the parallels between the two assets have grown. Both Bitcoin and gold are viewed as scarce, have the potential to be held outside of conventional financial markets, and have values that cannot be inflated away by relentless money creation and currency debasement. Market participants, including mainstream asset managers, appear to be looking to both as attractive inflation hedges. Gold and Bitcoin are also uncorrelated to other popular asset classes in portfolios, which provides evidence of their diversification benefits. Despite the low correlation, one glaring difference can be seen in the volatility of Bitcoin over the past five years. It is multiple times higher than other asset classes as seen in Exhibit 2, which shows the monthly annualized volatility over one-, three-, and five-year horizons.

In addition to performance, the fundamentals of Bitcoin and gold differentiate in owning one versus the other. Gold is a physical asset, while Bitcoin is a digital one. While both are scarce, gold does not yet have a ceiling to supply, while there ultimately can only be 21 million Bitcoins mined. Also, according to Chainalysis, 20% of current Bitcoin supply is considered not recoverable due to hard drives being lost in garbage dumps or passwords lost in early investors’ heads. On the demand side, there are a lot of similarities between the two assets, as can be seen in Exhibit 3. Gold is viewed as a more secure investment with a long history of use and is widely accepted by all types of market participants. On the other hand, concerns of Bitcoin theft were rampant a few years ago; though as Bitcoin becomes more mainstream, these worries are fading, although lingering technology and exchange counterparty risks remain. The different ways to access return streams of gold are conventional and easily accessed by different types of market participants. Bitcoin, however, is in its infancy, but it is slowly becoming more easily accessible to mainstream investors.

S&P DJI intends to launch global cryptocurrency asset indices based on data sourced from Lukka, our cryptocurrency pricing provider known for its institutional-grade pricing. Soon, reliable and user-friendly crypto benchmarks will be available to promote more transparency in this area. Lukka is a New York City-based crypto asset software and data company. S&P Global participated in Lukka’s USD 15 million Series C in December 2020.

Market participants cite many reasons why they allocate a slice of their portfolio to Bitcoin. For many of those reasons, gold is already the ideal, established candidate for adoption. The S&P GSCI Gold tracks the most actively traded gold futures on the CME. Whether looking for an inflation hedge, store of value, way to diversify, or directional play in commodity markets, gold is the asset with the longest track record of price appreciation in human history.

The posts on this blog are opinions, not advice. Please read our Disclaimers.

Latin American Equities Close the Year in the Red Despite the Strongest Q4 in 20 Years

Contributor Image
Silvia Kitchener

Director, Global Equity Indices, Latin America

S&P Dow Jones Indices

Volatility is often the name of the game in Latin America. While 2020 was no exception, global markets also rode the COVID-19 volatility wave (see Exhibit 1). The global pandemic exacerbated uncertainty around the world and all capital markets were affected, particularly during Q1 2020.

In Exhibit 1, we can see that the S&P Latin America BMI experienced the greatest loss (-46.0%) among our major regional indices in Q1, followed by the S&P MILA Pacific Alliance Composite (-37.5%), which represents Latin America excluding Brazil. Latin American equities rose in Q2, roughly in line with the global recovery, but then they lagged in Q3. Propelled by global economic optimism following the announcements of vaccine developments, the S&P Latin America BMI topped the leaderboard in Q4, gaining more than 30%, but it was not enough to recoup losses from earlier in the year, as the index finished the year down 12.9%.

Similar trends were seen across sectors and countries throughout the year (see Exhibit 2). During the first quarter, all sectors and countries dropped, with Energy and Brazil performing worst. During the subsequent quarters, countries and sectors staged a strong recovery, though some fared better than others—a sign that the pandemic affected some countries and sectors more than others. While Q4 saw impressive returns, with Energy generating the best returns (51.2%), it was the Information Technology (49.2% YTD) and Materials (28.3% YTD) sectors that more consistently contributed to positive performance throughout the year. Materials companies, which include exporters of copper and iron, registered record prices for their exports, since January 2013 for copper and October 2011 for Iron.1

Among Latin American countries, all flagship indices ended the year under water when measured in USD (see Exhibit 3). The best performers were the S&P/BVL Peru Select 20% Capped Index, down 0.4%, and Mexico’s S&P/BMV IRT, down 1.8%.

The story was different for returns in local currencies, given the significant depreciation of most currencies versus the U.S. dollar during the year (see Exhibit 4). The S&P Brazil BMI in BRL (6.43%), Argentina’s S&P MERVAL Index in ARS (22.9%), and the S&P/BVL Peru Select 20% Capped Index in PEN (8.8%) rounded up the leaders for YTD returns in local currency.

With the pandemic still raging in many parts of the world, what should we expect in 2021? The good news is that there are two vaccines with high efficacy being distributed in several countries. Currently, only citizens from Brazil, Chile, and Mexico have started to get vaccinated, while remaining Latin American countries are on a long waiting list. Economists in the region2 are watching the slow and fragile recovery. It is summer in the southern hemisphere, which has helped to curb the number of infections and hopefully by the fall and winter of 2021, the vaccine will have helped control the spread. The key now is how quick and effective the rollout of the vaccines will be in Latin America and the rest of the world before the global economy returns to a strong growth trend. It’s going to be an interesting year, yet again.

For more information on how Latin American benchmarks performed in Q4 2020, read our latest Latin America Scorecard.


1 Source: S&P Global Ratings and CapitalIQ. Copper (Comex HG), and NYMEX Iron Ore 62% Fe.

2 Diego Ocampo and Luis M. Martinez. Panorama del sector corporativo de América Latina para 2021: Un año de recuperación con altibajos. (Latin America Corporate Sector Overview for 2021: A Year of Recovery with Ups and Downs) Dec. 28, 2020. S&P Global Ratings.


The posts on this blog are opinions, not advice. Please read our Disclaimers.

Global Islamic Indices Advanced 28% YTD, Outperforming Conventional Benchmarks up to 12%

Contributor Image
John Welling

Director, Global Equity Indices

S&P Dow Jones Indices

Global equities enjoyed substantial gains in the last quarter of 2020, gaining 15.9%, as measured by the S&P Global BMI. Shariah-compliant benchmarks, including the S&P Global BMI Shariah and Dow Jones Islamic Market (DJIM) World Index, slightly underperformed their conventional counterparts in Q4 2020 due to the strong performance of the conventional Financials sector, which gained nearly 25% during the period. However, despite this, the outperformance of Islamic indices finished in double-digits YTD, with an advantage of 11.2% and 11.9%, respectively. The outperformance trend played out across all major regions, with the DJIM World Emerging Markets Index leading the pack, providing an additional 20.0% return above the conventional benchmark.

Sector Performance as a Key Driver

As global equities continued to recover and extend gains in Q4 2020, sector drivers played an important role in Shariah outperformance, as Information Technology—which tends to be overweight in Islamic indices—was the best performer among sectors, while Financials—which is nearly absent in Islamic indices—continued to heavily underperform the broader market YTD. Exhibit 2 demonstrates the effect on returns of over- and underweight sector allocations of the S&P Global BMI Shariah compared with the conventional benchmark.

The majority of S&P Global BMI Shariah outperformance—9.9% of the 11.2% total outperformance YTD—can be explained by differing sector allocations, while 1.3% can be explained by beneficial differences in stock selection.

MENA Equities in Recovery

Having fallen significantly during Q1 2020, MENA equity performance improved considerably during Q4, as the S&P Pan Arab Composite turned positive YTD, gaining 1.2%. The S&P Morocco BMI led the way in the region in Q4, gaining 18.4%, followed by the S&P UAE, which gained 12.0%. The S&P Pan Arab Composite Shariah surpassed its conventional counterpart by 7.8% during the year, in large part due to significant representation of Saudi Arabia, which outshone regional peers. The S&P Saudi Arabia and S&P Oman were the only MENA country indices to enter positive territory YTD, gaining 6.8% and 0.9%, respectively.

For more information on how Shariah-compliant benchmarks performed in Q4 2020, read our latest Shariah Scorecard.

This article was first published in IFN Volume 18 Issue 2 dated the 13th January 2021.

The posts on this blog are opinions, not advice. Please read our Disclaimers.

Manage Drawdown and Recovery with Dynamic Allocation

Contributor Image
Claire Yi

Former Analyst, Strategy Indices

S&P Dow Jones Indices

In October 2019, S&P Dow Jones Indices launched the S&P ESG Global Macro Index, an ESG-themed, regionally diversified, volatility-managed, multi-asset index. As discussed in my previous blog, the index has generated stable absolute returns of 5.44% annually, a volatility of 4.89%, and downside protection during extreme market scenarios, based on back-tested performance from Aug. 31, 2010, to Dec. 31, 2020.

The global equities market experienced unprecedented fast drawdown and recovery in 2020. Although the S&P ESG Global Macro Index’s performance was not as stunning as that of the S&P 500® in 2020, it outperformed a pure equity and static 60% equity/40% bond portfolio with a risk control mechanism.1 This blog reviews how the S&P ESG Global Macro Index’s dynamic asset allocation helped to achieve this outcome.

Economic- and Market-Signal-Based Allocation

The S&P ESG Global Macro Index uses a short-term economic movement signal and a medium-term market trend signal to revise its asset allocation on a monthly basis (see brochure).  Exhibit 2 provides the timeline of allocation signals of the S&P ESG Global Macro Index in 2020. There were three different phrases.

Phase 1: Before Sell-Off

At the beginning of 2020, the Organization for Economic Co-operation and Development’s composite leading indicator (the OECD’s CLI) was below 100, indicating economic activity was below its long-term potential level. Although the three-month momentum of the equity market was still positive, the index allocated 55% to equities and 45% to fixed income.

Phase 2: COVID-19 Sell-Off

The sell-off started on Feb. 19, and hit bottom on March 23. The S&P 500 declined 33.93% in 23 trading days. The S&P ESG Global Macro Index reduced its equity allocation from 55% to 0% on March 1, as the momentum signal turned negative during that month’s rebalance.

Phase 3: Recovery

On Aug. 18, the S&P 500 completely erased its February-March 2020 losses, calling an end to the COVID-19-driven plunge. As the market signal turned positive on July 1, the index reassigned a 55% weight to the equity basket to capture the upside potential gain from equities.

Risk Control Mechanism

After the monthly allocation is determined, the S&P ESG Global Macro Index applies a 5% risk control overlay by adjusting a leverage factor applied to the overall portfolio in order to achieve a stable risk at the index level. Exhibit 3 shows the allocation to each asset class after applying 5% risk control. There were three periods worth noting.

Period 1: From Feb. 19 to March 10, when the market started to fall in response to COVID-19, there was a clear negative relationship between equities and fixed income. The S&P 500 dropped 14.88% while the bond component2 gained 3.83% in 14 trading days. Before March, the index had a decreased leverage factor for protection. As the index switched to the bond portfolio starting March 1, it was leveraged. This is because the 100% bond portfolio’s volatility was less than 5%. The leverage resulted in a 2.3% return for the index from March 1 to March 10.

Period 2: From March 11 to 23, as oil prices fell, the negative relationship did not hold. The S&P 500 dropped 22.37%. During the same period, the bond stopped acting as a safe heaven and dropped by 1.37%, and the realized volatility of the all-bond portfolio was higher than 5%. The S&P ESG Global Macro Index thereby reduced its bond exposure by lowering the leverage factor and returned -1.30% during those nine trading days.

Period 3: After March 24, the market started to rebound, and the bond portfolio’s volatility decreased gradually. In response, the index continued to increase the leverage factor to maintain the 5% target volatility. From March 24 to June 30, the index kept its portfolio configuration unchanged, while increasing the leverage factor from 0.52 to 1.35. On July 1, the equity basket was added back to the index based on the positive market signal. The new equity/bond portfolio had a volatility higher than 5%. Thus, the index used a smaller leverage factor to maintain a stable level of risk, resulting in a 20.08% actual allocation to equity.

During volatile periods, especially in undesirable macroeconomic conditions, a dynamic allocation strategy, which balances risk and return during drawdowns and recoveries, could be worth consideration.


1 Risk control is commonly used in structured product’s underlying methodology, and a higher citation like 10% or 15% may lead to higher returns.

2 Represented by the index bond basket, including the S&P 10-Year U.S. Treasury Note Futures Index, S&P Euro-Bund Futures Index, and S&P 10-Year JGB Futures Index, following a ratio of 3:2:1.

The posts on this blog are opinions, not advice. Please read our Disclaimers.