Get Indexology® Blog updates via email.

In This List

Why Now for ESG?

The Market Is Up, But So Is Volatility

Core ESG Indexing Is Engaged to Drive Change

Record Participation in the CSA Powers the DJSI into Its Third Decade

SPIVA® Latin America Mid-Year 2020 Scorecard: Convergence to Underperformance

Why Now for ESG?

Contributor Image
Shaun Wurzbach

Managing Director, Head of Commercial Group (North America)

S&P Dow Jones Indices

In a recent webinar I moderated, Brie Williams of State Street Global Advisors joined me to discuss how environmental, social, and governance (ESG) data and investing are now at an important turning point. During that webinar, we answered some advisor questions. I encourage you to watch this replay if you missed it. We ran out of time to answer all the questions we received, so I thought it would be worthwhile to bring our discussion to Indexology to “extend our time” and, in that way, answer more questions advisors may have as they evaluate how and in what ways to position ESG investing. In this first post, I have grouped questions on the theme, “Why Now for ESG?” In a follow-up post, I will cover a second, related theme, “How Is the ESG Discussion Changing?”

Q: ESG has been around for a while. What is different now that should command our attention?

Brie Williams, State Street Global Advisors: When it comes to ESG investing, the world is changing. Investor engagement is growing while data and analytics that track the performance of these strategies are evolving. As a result, ESG adoption is accelerating.

  • Globally, the percentage of retail and institutional investors that apply ESG principles to at least a quarter of their portfolios jumped from 48% in 2017 to 75% in 2019.1
  • Specific to scoring data, the more ESG data providers are investing in developing ESG scoring solutions, the more companies will prioritize reporting and disclosure. After all, we can only focus on financial materiality so distinctly because increased reporting in non-traditional areas has already been in motion.

Q: We always hear about incredible amounts of money tracking ESG, but is that all in other countries, or solely institutional clients? What do you see going on with ESG ETFs and mutual funds?

Brie: ESG is an evolving space and relatively small from an asset base and product offer space; however, development is becoming more dynamic and diverse, with new products and new issuers as well as conversions of existing products to ESG.

  • Most of the assets lie in equity, where flows are favoring broad ESG over thematic.
  • The industry is trending toward lower-cost solutions, with over 50% of U.S. ESG ETFs launched in the past two years having a net expense ratio under 20 bps.
  • ETFs are helping to democratize access to ESG, enabling investors large and small to better realize their investment objectives.

And the cash flow story behind the ESG superhighway is dynamic.

  • Sustainable funds attracted an estimated USD 45.7 billion in net flows globally during the first quarter of 2020, even while the overall fund universe suffered USD 384.7 billion in outflows as markets plunged in response to the pandemic.2
  • We project a nearly eight-fold increase in global ESG ETF and indexed mutual fund assets, from USD 170 billion as of May 31, 2020, to more than USD 1.3 trillion by 2030.3

Q: Is ESG an idea with staying power, or is it a “flavor of the year” in the financial media and product marketing space?

Brie: Three trends are positioning ESG to transform from a check-the-box portfolio component to a significant component of a portfolio.

  1. The great reset in a turbulent 2020, with “S” and “G” issues at the forefront

The management of “E” and “S” risks will likely emerge as the new standard of comprehensive corporate governance—and underscore how non-financial E, S, and G factors may affect long-term valuation.

  1. Investors are reshaping what’s next. Industry transformation is under way, helping investors to:
    • Incorporate ESG factors for sustainable performance;
    • Rely on better data to make better decisions;
    • Gain ESG exposure with cost-effective ETFs; and
    • Customize portfolios with ESG funds.
  2. Changing investment demographics

Large-scale wealth transfers—nearly USD 15.4 trillion in global wealth transferred by 20304—and a greater emphasis on living according to values have encouraged ESG adoption. Those changes will presumably reverberate and be magnified through increased government regulation and institutional investments.


1 BPN Paribas, “The ESG Global Survey 2019,” 2019.

2 Morningstar, March 31, 2020.

3 State Street Global Advisors, June 2020, based on Morningstar data as of May 31, 2020.

4 Wealth-X, “A Generational Shift: Family Wealth Transfer Report 2019,” June 2019.

The posts on this blog are opinions, not advice. Please read our Disclaimers.

The Market Is Up, But So Is Volatility

Contributor Image
Fei Mei Chan

Former Director, Core Product Management

S&P Dow Jones Indices

So far, 2020 has brought us a global pandemic, a coordinated global economic shutdown, and, in the U.S., a notably contentious election. So it’s no surprise that volatility has been, and remains, elevated. Despite all this, equities have fared reasonably (some would say surprisingly) well, with the S&P 500® climbing 13% through Nov. 19 since the end of 2019.

The elevated volatility can be seen across all sectors of the S&P 500 relative to the beginning of the year, despite having declined a bit in the past three months. The highest volatility sectors continue to be Energy and Financials.

The latest rebalance for the S&P 500 Low Volatility Index (effective after market close Nov. 20, 2020) wrought minimal changes. Only eight names, accounting for about 7% of the index’s weight, cycled out of the index. The Energy, Financials, and Utilities sectors, traditionally low volatility stalwarts, continued to hold only a small fraction of the portfolio. Consumer Staples and Health Care together accounted for just over 50% of the rebalanced portfolio’s weight, as our methodology targets the 100 least volatile stocks in the benchmark S&P 500.

The posts on this blog are opinions, not advice. Please read our Disclaimers.

Core ESG Indexing Is Engaged to Drive Change

Contributor Image
Shaun Wurzbach

Managing Director, Head of Commercial Group (North America)

S&P Dow Jones Indices

I define core ESG indexing as the use of indices designed to apply environmental, social, and governance (ESG) screening and ESG scores to recognized and sometimes iconic indices like the S&P 500®, S&P/ASX 200, or S&P/TSX Composite. These headline indices become actionable components of asset allocation when a fund or separately managed accounts (SMA) provider tracks the index. Our SPIVA® and Persistence Scorecards prove time and again that these well-designed indices are fit for that purpose. Now we have designed and launched core ESG versions of these indices to leverage SAM’s1 robust ESG data to measure the ESG engagement of companies in the benchmark index. Looking at the cost and availability of the ETFs that currently exist in the U.S., U.K./Europe, Canada, and Australia in this core ESG category, it is fair to say that the partnership of index providers, ETF data providers, asset managers, and market makers has democratized access to ESG for strategic allocation. But it’s okay with me if you prefer to think of that use of ESG as thematic rather than strategic.

How exactly is core ESG indexing engaged to drive the types of change that ESG investors want to see? At first glance, most core ESG indices are not excluding as many industries or companies as ESG “leader” indices. The conscious design difference in core ESG has helped to historically ensure that core ESG indices track their benchmark closely. Yet the core ESG selection of eligible companies based on ESG score leads to industry and sector differences we can see. Exhibit 1 shows the last company selected and the next company not selected based on ESG scores for some of the industries within the S&P 500. Sector weight information is available free on spglobal.com/spdji, showing sector weight differences between benchmark and ESG indices.

At the company level, our expectation is that CFOs are engaged in addressing ESG inquiries from firms like SAM. SAM accesses both public and non-public information to render scores. This inquiry and reporting drives people and process changes at these companies as they attempt to improve year over year. And those same CFOs try to ensure their company is selected in core ESG indices. As investor demand for ESG continues to increase, my expectation is that selection in the S&P 500 ESG Index will matter to CFOs in a similar way to how selection matters in one of our Dividend Aristocrats® indices.

Another aspect of engagement that core ESG indices drive is bringing more transparency to how companies are managing material nonfinancial risks and opportunities. Is that information relevant to company valuation? A growing field of accountancy as well as education and training practice led by universities and the Sustainability Accounting Standards Board (SASB) are making that point, and I think that point is often missed by advisors and investors of my generation. We were trained to look at the three financial statements of the firm. We may need to have it pointed out to us how substantial the shift has been in valuation to intangible assets. Exhibit 2 illuminates this point in the ubiquitous S&P 500 by showing how intangible assets have increased significantly as a driver of market capitalization for the top five companies in the index over time.

Exhibit 2 shows that we need to be more curious about how ESG can provide information about intangible assets and nonfinancial risks and opportunities. More information and data from ESG data providers like SAM will paint a more complete picture of how to measure the long-term sustainable performance of equity and fixed income asset classes.

1 SAM, part of S&P Global, provides the data that powers the globally recognized Dow Jones Sustainability Indices, S&P 500 ESG Index, and others in the S&P ESG Index Series. Each year, SAM conducts the Corporate Sustainability Assessment, an ESG analysis of over 7,300 companies. The CSA has produced one of the world’s most comprehensive databases of financially material sustainability information, and serves as the basis for the scores that govern S&P DJI ESG indices.

The posts on this blog are opinions, not advice. Please read our Disclaimers.

Record Participation in the CSA Powers the DJSI into Its Third Decade

Contributor Image
Manjit Jus

Managing Director and Global Head of ESG Research & Data

S&P Global

In 2020, the 21st rebalancing of the Dow Jones Sustainability Indices (DJSJ) occurred; however, this is the first time it has taken place solely under the umbrella of S&P Global (after S&P Global’s  acquisition of RobecoSAM’s ESG Ratings business in January 2020). It also marked a new step forward toward greater transparency and insight, as S&P Global announced to companies that they would be receiving a new level of granularity in their results—scores on up to 120 individual questions and metrics in the Corporate Sustainability Assessment (CSA). The 2020 CSA saw a number of key updates to the methodology, including the addition of specific questions on plastic waste, revised questions on ESG-focused products and services in the financial industry, and the extension of information security questions to a broader set of industries. These topics reflect the shifting landscape of investor interest as it relates to ESG and challenge companies to think about emerging topics as they begin to materialize in the form of new risks or opportunities. While we saw strong improvements in some areas, we also saw that companies across many industries continue to struggle on topics such as cybersecurity. From a governance perspective, fewer than 20% of companies across all industries have board members with relevant cybersecurity or IT experience. New questions introduced in the pharmaceuticals industry highlighted that few companies publicly report on information related to fair drug pricing, another topic that is certainly likely to gain increased attention as a result of the ongoing global health crisis.

This year, despite the ongoing global challenges, we saw an increase of nearly 19% in the number of companies completing the CSA, bringing the total number of CSA participants to 1,386. This is the highest number in the DJSI’s more than 20 years of history and the biggest year-over-year increase, ever. Reassuringly, we saw growth across all regions, despite the different local economic and political challenges that companies faced. Reflecting on past years, it would seem that crises serve as a strong driver to bolster sustainability agendas. Between 2008 and 2009, we saw an increase in company participation of nearly 15%, the second highest record in DJSI history. Interestingly, the Financial sectors drove much of this growth. In 2020, the Real Estate and Financial sectors demonstrated the highest growth rate—a clear sign that ESG is at the top of the agenda for financial institutions as they brace for new regulations and requirements for ESG disclosure—at both the company level and in their ESG product portfolios.

For more detailed information on this year’s DJSI rebalance and key highlights from the CSA, please read our insight. For more detailed information and findings from this year’s results, please read our Annual Scoring & Methodology Review.

The posts on this blog are opinions, not advice. Please read our Disclaimers.

SPIVA® Latin America Mid-Year 2020 Scorecard: Convergence to Underperformance

Contributor Image
Maria Sanchez

Director, Sustainability Index Product Management, U.S. Equity Indices

S&P Dow Jones Indices

We recently published our industry-famous SPIVA report for the Latin America region. SPIVA, which stands for S&P Indices Versus Active, analyzes the performance of actively managed mutual funds against their respective category benchmark. In the case of Latin America, S&P Dow Jones Indices began publishing the scorecard in 2014, covering Brazil, Chile, and Mexico.

The SPIVA Latin America Mid-Year 2020 Scorecard shows that the majority of active equity managers in Chile and Mexico failed to outperform their benchmarks over 1-, 3-, 5-, and 10-year periods, even when the first half of 2020 offered abundant opportunities for active managers. The dispersion and volatility of the S&P Latin America BMI’s constituents remained above the historical median for four of the six months.1

However, Brazilian active managers in the Brazil Equity Funds, Brazil Large-Cap Funds, and Brazil Corporate Bond Funds categories managed to take advantage of the circumstances in the short term. We have seen this outperformance by active managers on a short-term basis in the past as well.

A compilation of the Latin America SPIVA scorecards from year-end 2014 to mid-year 2020 show that when observing one-year periods, Chilean active managers outperformed in December 2014; Brazilian active managers outperformed in one or more of their categories in June 2015, December 2015, and June 2016; and the majority of Mexican equity active managers were able to beat their benchmarks in December 2019 (see Exhibit 1).

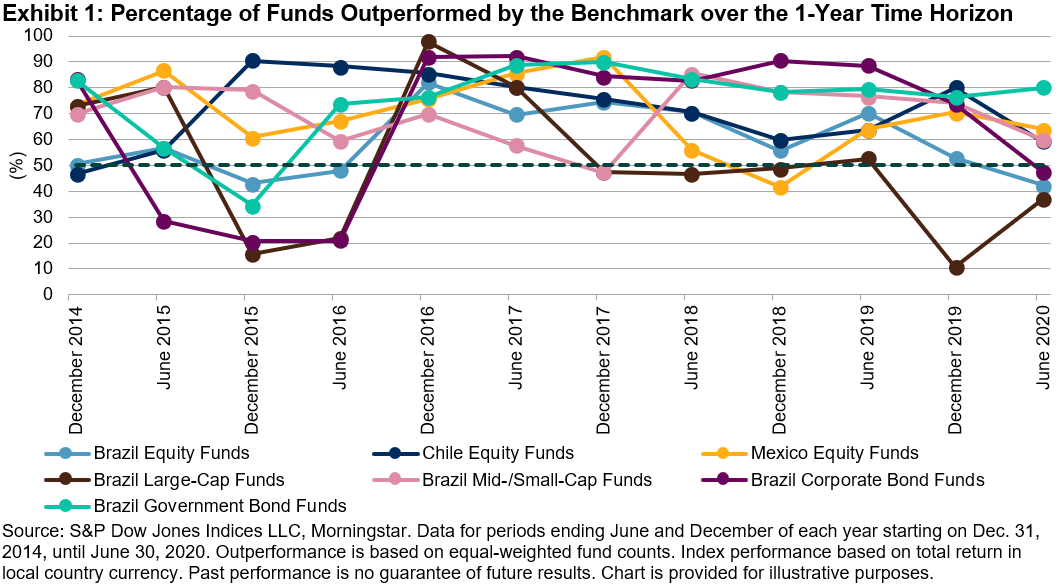
However, when compared with a longer time horizon, say a three-year period, we see that the percentage of active managers outperforming goes down.

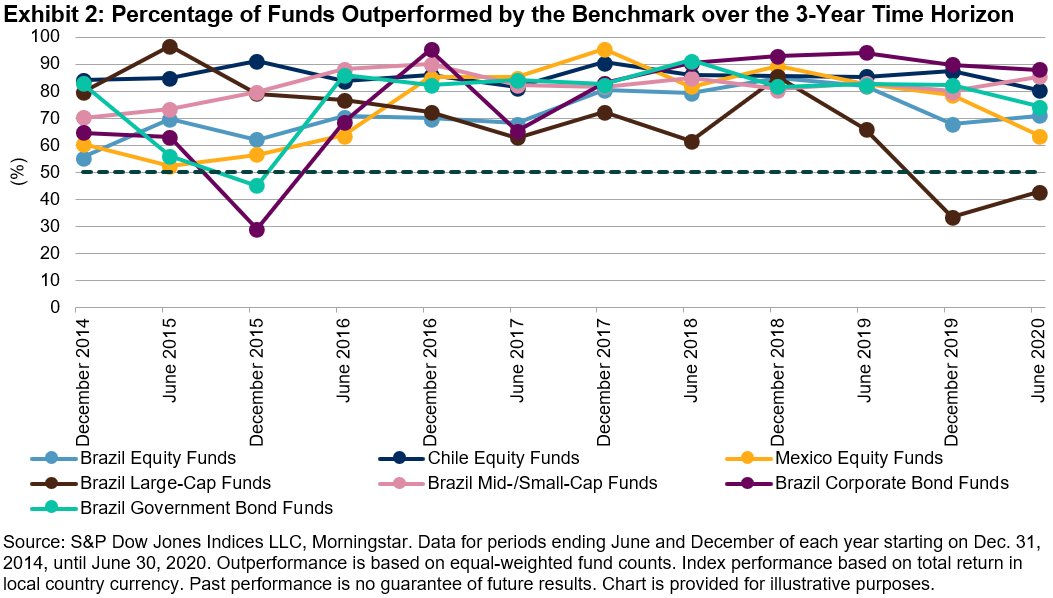
And when considering even longer time periods, like across a five-year period, the majority of active managers in all categories for all three countries were outperformed by their benchmarks.

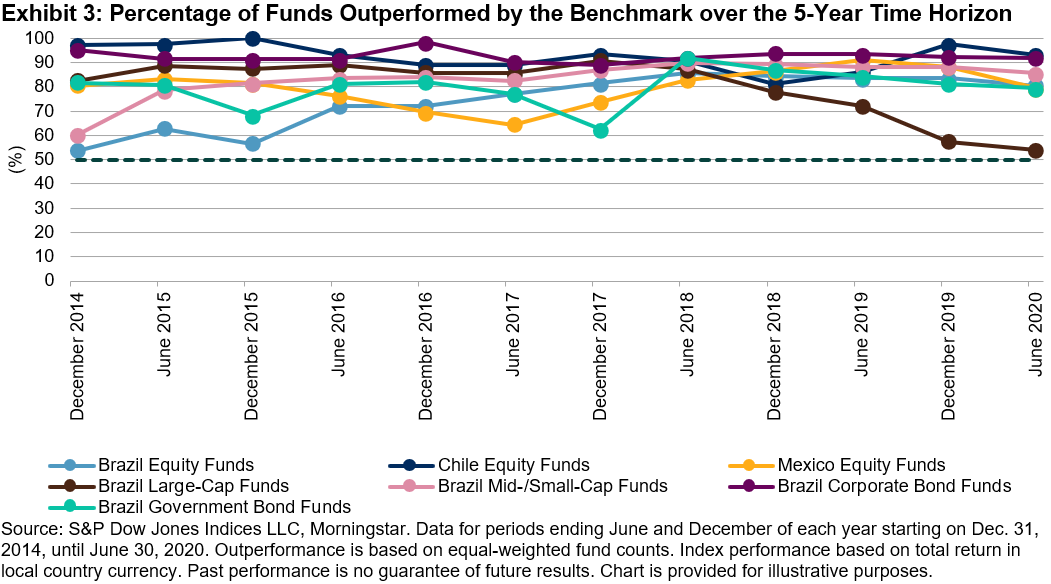
Lastly, for the 10-year period observed, the percentage of funds outperformed by their benchmarks converged in a range above 70%.

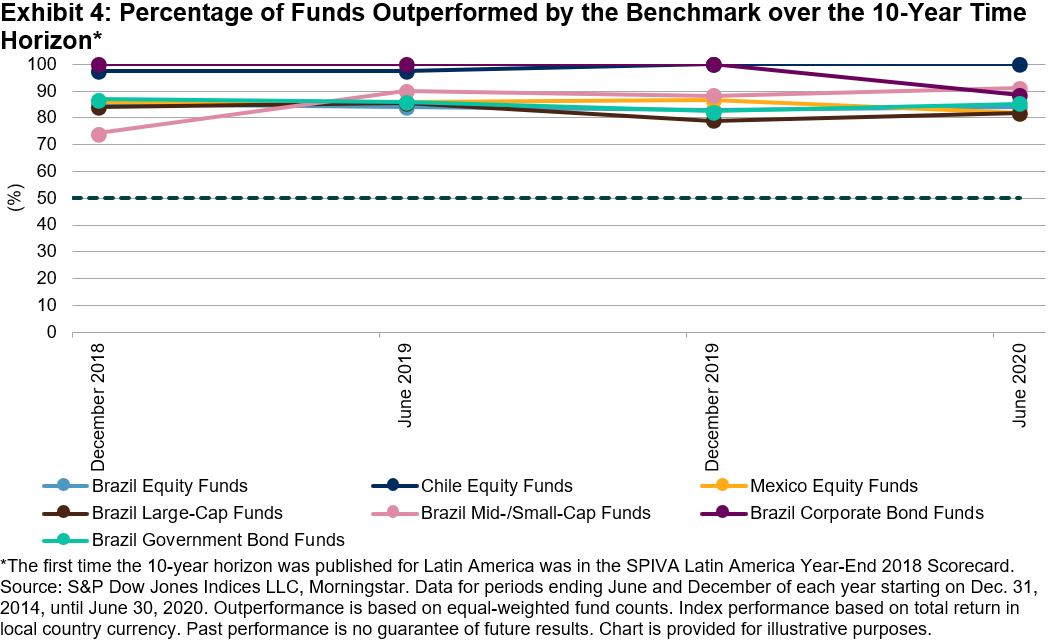
As evidenced by the SPIVA scorecards, the majority of active managers underperform most of the time, especially across long-term horizons, demonstrating how difficult is to consistently beat the benchmark.

1 Index Dashboard: Dispersion, Volatility & Correlation: January 2020; February 2020; March 2020; April 2020; May 2020; June 2020.

The posts on this blog are opinions, not advice. Please read our Disclaimers.