Get Indexology® Blog updates via email.

In This List

Active U.K. Income Funds Endure Challenging Times

Global Islamic Indices Continue to Outperform, Gaining up to 13% over Conventional Benchmarks YTD

How Target Outcome Indices Work

The Case for Investing in Water

Global Diversification in 2020 – Is India Seeing This Opportunity?

Active U.K. Income Funds Endure Challenging Times

Contributor Image
Ari Rajendra

Senior Director, Head of Thematic Indices

S&P Dow Jones Indices

The U.K. has been one of the worst-hit countries in developed markets in terms of dividend cuts in 2020. One in two dividend-paying companies in the S&P United Kingdom BMI have cut dividends, while half of the remaining companies are also expected to cut dividends.1 A tough year indeed for equity income managers, as opportunity to differentiate abates in the near term. This blog explores why this may be so and draws attention to the benefits of indexing under the current environment.

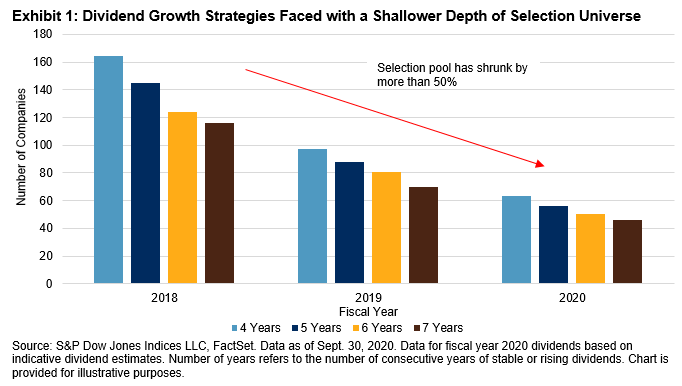
Selection Pool for Dividend Growth Strategies Has Shrunk Significantly

Prior to the pandemic, there were a little over 300 dividend-paying companies within the S&P United Kingdom BMI, but this has now fallen to just under 200. Despite the reduction, this may still appear to be a sizable selection universe for dividend funds. However, the impact could be amplified depending on the type of dividend strategy. For example, a consistent dividend growth strategy would select companies that have maintained stable or growing dividends for a certain number of consecutive years. Exhibit 1 illustrates that the number of such companies has fallen by more than 50% since 2018.2

Dividend Portfolios Could See Convergence in Holdings

At present, approximately GBP 60 billion3 of assets are currently in U.K. dividend-based strategies, mostly in active funds. Many of them may employ dividend growth strategies. The potential implication of a reduced selection pool is an increased likelihood of holdings overlap between these active dividend funds.

While an accurate comparison of holdings between active funds is challenged by inconsistent reporting dates and incomplete disclosures, there were some interesting observations.

Sustainable dividend payers such as GlaxoSmithKline, Phoenix Group, British American Tobacco, Legal & General Group, and RELX were among names found to be commonly present in many of the largest income funds,4 all of which are also present in the S&P UK High Yield Dividend Aristocrats® Index. Intriguingly, the top four active income funds, with combined assets of almost GBP 15 billion, were each also observed to have at least 35%, and an average of 46%, of their respective assets invested in stocks within the S&P UK High Yield Dividend Aristocrats Index,5 a figure that could rise even further.

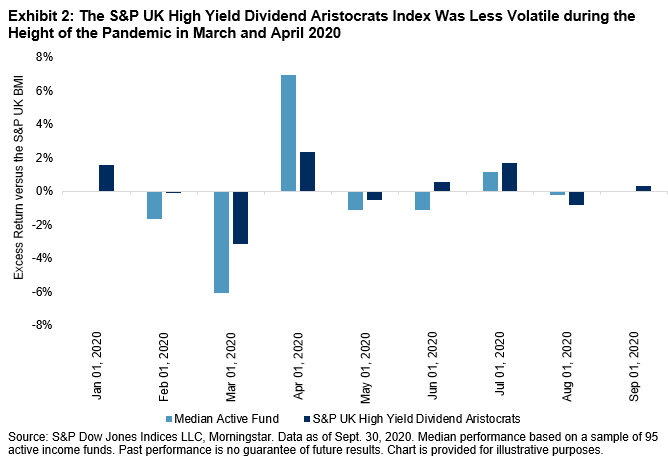
A potential consequence of commonality of dividend portfolios is convergence in performance. Although inconclusive, the performance difference between the median active fund and its passive counterpart, the S&P UK High Yield Dividend Aristocrats Index, has converged to a tighter range in recent months, as shown in Exhibit 2. It is also worth highlighting that the index posted meaningful outperformance of 2.6% YTD as of Sept. 30, 2020.

Diminishing Value of Active Income Funds in Recent Years

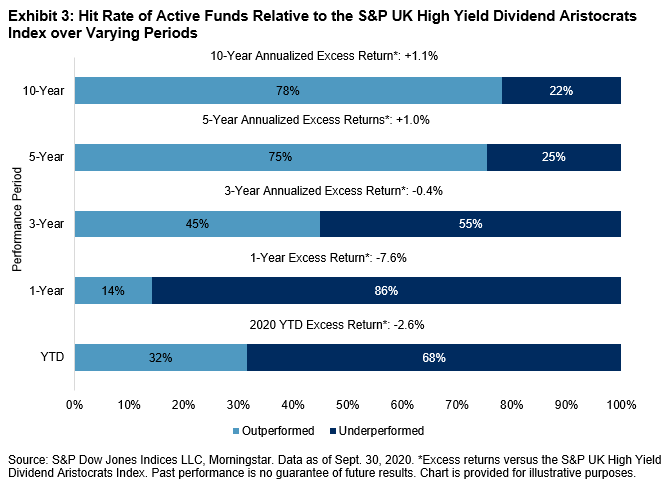
Historically, active manager selection has indeed shown to add value. Exhibit 3 shows that at least 75% of active funds were able to outperform the S&P UK High Yield Dividend Aristocrats Index over the 5- and 10-year periods ending Sept. 30, 2020. However, the tide shifted in recent years, when only 14% of funds outperformed over the past year. Going forward, outperformance may prove to be a greater challenge for the aforementioned reasons.

It is also worth noting that this analysis used gross-of-fees returns and does not include the 1% average management fee imposed by active funds. Thus, on a net-of-fees basis, a large part of the long-term excess returns would have been eroded by fees (see annualized excess returns in Exhibit 3).

Grounds for Hope

Equity income investors choosing to stay the course have reason to take comfort from some of the drivers of dividend cuts. First, unlike the Global Financial Crisis, in 2020 companies acted prudently by pre-emptively cutting dividends to shore up balance sheets. Second, regulatory and political pressure forced many companies to suspend their dividends. Both are reasons to believe that many of these companies may be better positioned to resume dividend payments in the future. In fact, some already have.

A narrower selection pool and relatively higher fees may continue to limit the opportunity for active funds to differentiate, and we highlight their recent underperformance versus an alternative passive income benchmark. As such, the S&P UK High Yield Dividend Aristocrats Index can be a compelling passive solution for capturing U.K. dividends.

1    Based on indicative dividends for fiscal year 2020.
2    Fiscal year 2018, mostly paid in calendar year 2019.
3    Based on a screen of open-ended income funds in Morningstar.
4    Based on holdings data reported by Morningstar.
5    Two funds had last reported holdings on June 30, 2020, and one other only had 50% of holdings (by weight) disclosed.

The posts on this blog are opinions, not advice. Please read our Disclaimers.

Global Islamic Indices Continue to Outperform, Gaining up to 13% over Conventional Benchmarks YTD

Contributor Image
John Welling

Director, Global Equity Indices

S&P Dow Jones Indices

Global equities withstood a slump in the last month of the quarter, ultimately gaining 8.1% in Q3 2020 and entering positive territory YTD, as measured by the S&P Global BMI. Meanwhile, Shariah-compliant benchmarks,  including the S&P Global BMI Shariah and Dow Jones Islamic Market (DJIM) World Index, significantly outperformed conventional indices, ultimately gaining an advantage of 13.3% and 14.4% YTD, respectively. The outperformance trend played out across all major regions, with the DJIM World Emerging Markets Index leading the pack, providing an additional 21.3% return above the conventional benchmark.

Sector Performance as a Key Driver

As global equities continued to recover in Q3 2020, sector drivers played an important role in Shariah outperformance as Information Technology—which tends to be overweight in Islamic indices—was the best performer among sectors, while Financials—which is nearly absent in Islamic indices—continued to heavily underperform the broader market. Exhibit 2 demonstrates the effect on returns of over- and underweight sector allocations of the S&P Global BMI Shariah compared to the conventional benchmark.

The majority of the outperformance—7.9% of the 12.6% total outperformance YTD—is explained by differing sector allocations, while 4.7% is explained by stock selection differences within sectors.

MENA Equity in Recovery

Having fallen significantly during Q1 2020, MENA equity performance improved considerably, as the S&P Pan Arab Composite was down 4.8% YTD, a welcome contrast since logging Q1 losses of 23.4%. The S&P Bahrain led the way in the region in Q3, gaining 17.8%, followed by the S&P Saudi Arabia, which gained 13.6%. All MENA country indices remained negative YTD, while the S&P Saudi Arabia was the closest to recovery, down just 0.01% YTD.

For more information on how Shariah-compliant benchmarks performed in Q3 2020, read our latest Shariah Scorecard.

A version of this article was first published in Islamic Finance News IFN Volume 17 Issue 41 dated the 14th October 2020.


The posts on this blog are opinions, not advice. Please read our Disclaimers.

How Target Outcome Indices Work

Indexing is democratizing access to defined outcomes, providing a simple, transparent, index-based blueprint for target outcome strategies that can be applied to both active and passive vehicles. Take a closer look at what makes these indices tick and the range of potential applications for these innovative tools.

The posts on this blog are opinions, not advice. Please read our Disclaimers.

The Case for Investing in Water

Contributor Image
Tianyin Cheng

Former Senior Director, ESG Indices

S&P Dow Jones Indices

Water is essential to the production and delivery of nearly all goods and services. Many businesses are reliant on a sufficient flow of clean water to operate and realize their growth ambitions. Overconsumption of water, water pollution, environmental degradation, and changing climatic conditions are making clean water an increasingly scarce resource.1 As the world population grows and competition for water resources between industry sectors intensifies, nations are set to experience a 40% shortfall in water by 2030.2

As these demands for clean water increase, companies involved in water-related business activities stand to grow in the coming years. Allocation to water can be systematically captured by rules-based, transparent index construction. Market participants could utilize index-linked water strategies to gain exposure to water, manage water risk, express their sustainability views, or allocate as part of a broader natural resource theme.

THE S&P GLOBAL WATER INDEX

The S&P Global Water Index is designed to track 50 of the largest publicly traded companies involved in water-related business activities through two distinct clusters: Water Utilities & Infrastructure and Water Equipment & Materials.

The underlying universe consists of securities trading on a developed market exchange with a minimum three-month average daily value traded of USD 1 million (USD 500,000 for current constituents), a total market capitalization of USD 250 million, and a float-adjusted market capitalization of USD 100 million after each rebalancing.

Given that companies can have multiple business segments and not all may derive from water-related business, it is helpful to separate those with pure exposure to water and those with mixed exposure. Hence, we assign an exposure score of 1.0, 0.5, or 0 for each company, based on its primary business, and select and weight companies based on their exposure score and market capitalization. Hence, the index attempts to provide a balanced, yet reflective view of the global water market by recognizing the full ecosystem of companies and pure-play names to be more focused areas.

RISK/RETURN CHARACTERISTICS

Over a long-term investment horizon, the S&P Global Water Index performed better than the broad-based global equity benchmark, the S&P Global BMI, by 3.04% per year since its inception on Nov. 30, 2001 (see Exhibit 2).

The S&P Global Water Index demonstrated stronger defensive characteristics than the global equities market, with a lower downside capture ratio and higher upside capture ratio (see Exhibit 3).

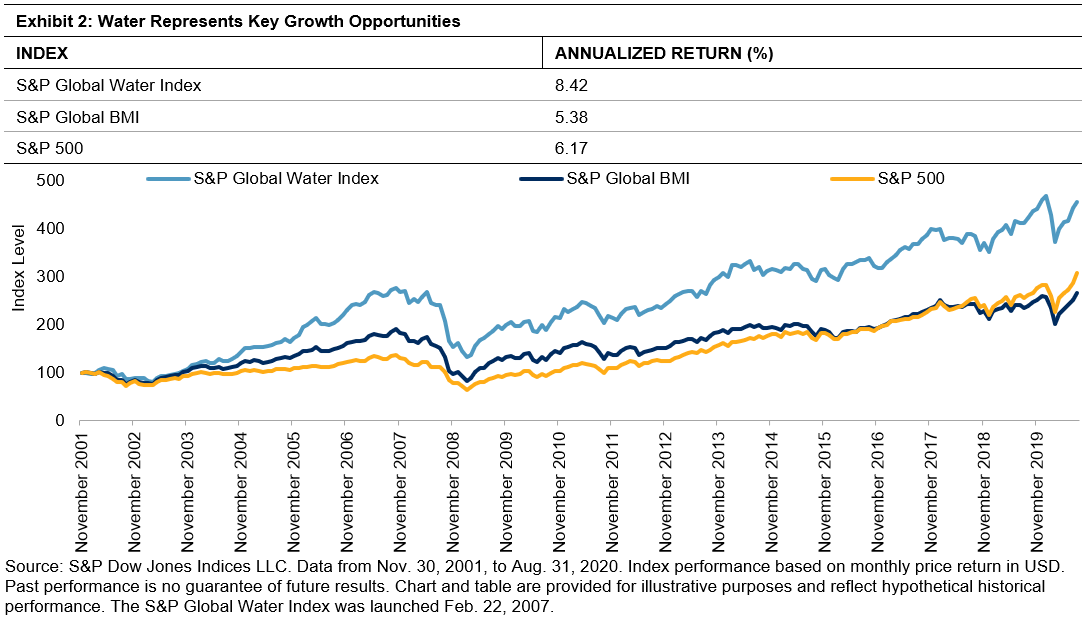
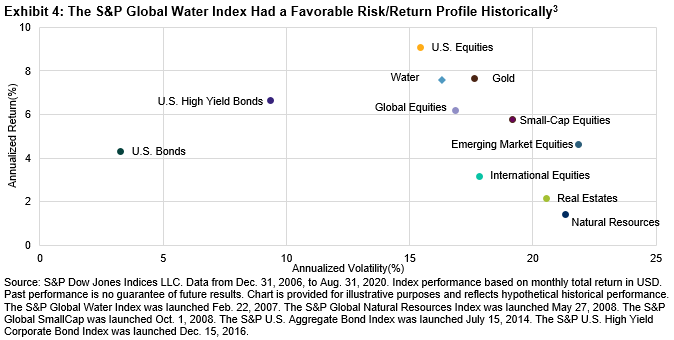
The S&P Global Water Index also provided favorable risk/return characteristics over the long run compared with key traditional asset classes, including real estate, small-cap equities, international equities, emerging market equities, and gold (see Exhibit 4). The favorable long-term risk/return characteristics compared with the S&P Global Natural Resources Index could be attractive for investors looking to diversify from other natural resource exposure.

For more information on the S&P Global Water Index, please refer to the index methodology and our recently published paper, Investing in Water for a Sustainable Future.

1 “Integrating water stress into corporate bond credit analysis.” UNEP Finance Initiative, Natural Capital Declaration (NCD), Deutsche Gesellschaft für Internationale Zusammenarbeitand (GIZ), and German Association for Environmental Management and Sustainability in Financial Institutions (VfU), 2015, https://www.unepfi.org/publications/ecosystems-publications/integrating-water-stress-into-corporate-bond-credit-analysis/.

2 “The United Nations World Development Report 2015: Water for a Sustainable World.” UNESDOC Digital Library, United Nations Educational, Scientific and Cultural Corporation, 2015, http://unesdoc.unesco.org/images/0023/002318/231823E.pdf.

3 “Water” represents the S&P Global Water Index, “Natural Resources” represents the S&P Global Natural Resources Index, “Global Equities” represents the S&P Global BMI, “U.S. Equities” represents the S&P 500®, “International Equities” represents the S&P Developed Ex-U.S. BMI, “Emerging Market Equities” represents the S&P Emerging BMI, “Small-Cap Equities” represents the S&P Global SmallCap, “U.S. Bonds” represents the S&P U.S. Aggregate Bond Index, “U.S. High Yield Bonds” represents the S&P U.S. High Yield Corporate Bond Index, “Gold” represents the S&P GSCI Gold, and “Real Estate” represents the Dow Jones Global Select Real Estate Securities Index.

The posts on this blog are opinions, not advice. Please read our Disclaimers.

Global Diversification in 2020 – Is India Seeing This Opportunity?

Contributor Image
Koel Ghosh

Former Head of South Asia

S&P Dow Jones Indices

The year 2020 has been unique, with the COVID-19 pandemic bringing unprecedented changes to economic activity that no one was fully prepared for, as well as record levels of volatility in financial markets. But such disruption not only creates innovation, it also gives opportunities to contrarian options and allows new themes to emerge dominant.

India has always been a country with a “home bias” in its investment strategies—meaning that Indian investors have generally preferred local securities to global. This is understandable; high yields in the fixed income markets and strong performance from equities, as well as a faith that India would deliver world-beating economic growth, kept investors glued to the local markets. However, the market’s reaction to the events of 2020 have provided a counterpoint to the accepted wisdom, when opportunities beyond domestic borders emerged as the clear winners.

Exhibit 1 compares the YTD trends in the S&P BSE SENSEX with a range of global indices calculated by S&P DJI, including our benchmarks for the U.S., Europe, and China. As the chart makes clear, 2020 has been a year in which global diversification could have helped Indian investors. Note that the S&P BSE DOLLEX 30 is the U.S. dollar equivalent of the Indian rupee-denominated S&P BSE SENSEX; for purposes of comparison, the performance of all indices is shown in U.S. dollars.

Whenever we compare performance, analyzing different time periods helps understand how the trends played out for a particular investment strategy or rather, in this case, the indices representing the country markets. The case for international diversification for Indian investors also holds up well in the long term, particularly for the world’s largest stock market: the S&P 500’s performance, whether over 1, 3, 5, or 10 years, was distinctly superior.

The global opportunity set offers a wide range of sectors and companies—within them, the likes of Microsoft, Apple, Amazon, and Facebook, that have benefited from the move toward virtual workplaces, virtual shopping, and higher spending on communications and technology. Using the S&P Global BMI, Exhibit 3 highlights the performance of certain global equity sectors and industries that showed both substantial gains and declines this year, illustrating the strength of the market’s trends. While airlines and energy companies have seen steep declines across the world, the soaring shares of global software, IT, and internet companies have offered refuge to those who had made an allocation.

International diversification provides local investors the chance to take part in such global trends and participate in the opportunities that arise from advancing technology and global changes in corporate and consumer behavior. Furthermore, in times of turmoil, broader diversification could enable market participants to weather the bad times, along with making the most of the good times.

The extraordinary events of 2020 have so far emphasized the potential of global equities to Indian investors, but are they seeing the opportunity? Offering perspective, S&P Dow Jones Indices’ series of global benchmarks can help frame the landscape of international investing.

Note: Thanks to Tim Edwards for a series of conversations that generated ideas for this blog and for providing some of the accompanying data.

The posts on this blog are opinions, not advice. Please read our Disclaimers.