Get Indexology® Blog updates via email.

In This List

How Factors Behaved Differently in the Australian Market in the First Half of 2020

The S&P Systematic Global Macro Index – Catching the Trend

Active Managers’ Outperformance in Brazilian Bond Funds – Skill or Price Distortion?

The Beat Goes on for the S&P 500 Dividend Aristocrats

Education Is the Armor That Can Protect You from Your Stomach

How Factors Behaved Differently in the Australian Market in the First Half of 2020

Contributor Image
Liyu Zeng

Director, Global Research & Design

S&P Dow Jones Indices

In our paper “How Smart Beta Strategies Work in the Australian Market,” we examined the long-term performance characteristics of S&P DJI’s Australian factor indices in different market trends. In the first half of 2020, the Australian equities market had a roller coaster response to the coronavirus outbreak, global market crash, and government stimulus packages. While most of the factor indices behaved similarly to their long-term performance characteristics, some did not. In this blog, we divided the first six months of 2020 into three time periods based on the varying price trends of the S&P/ASX 200 and reviewed how the Australian factor indices reacted in each of these different periods with the decomposition of their returns based on factor attributions for periods.

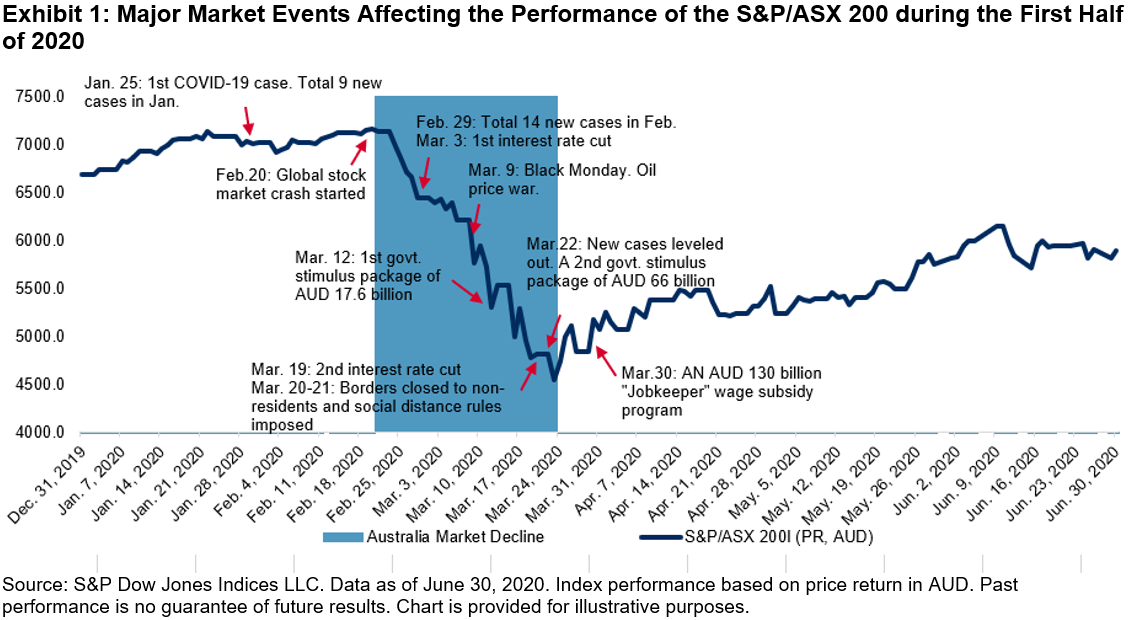
Despite the worldwide spread of coronavirus, the Australian equities market gained 7.5% during the period from Dec. 31, 2019, to Feb. 20, 2020, largely supported by the stronger-than-expected economic data. Apart from the S&P/ASX 200 Momentum, which gained 11.3%, the rest of the S&P DJI Australian factor indices underperformed the S&P/ASX 200.

Momentum and quality factors have historically tended to outperform their benchmarks during uptrend markets. According to the factor attribution shown in Exhibit 3, style factors (especially medium-term momentum), industry biases, and stock-specific risk all positively contributed to the S&P/ASX Momentum return and resulted in strong outperformance during this period. For the S&P/ASX 200 Quality Index, despite the positive return impact contributed by style factors, industry biases (overweight in Steel and Insurance and underweight in Banks and REITs) and stock-specific risks were unfavorable for the S&P/ASX Quality Index return, and the index underperformed slightly for the period.

With increasing concerns about the coronavirus outbreak, global recession, and disruption to corporate supply chains and sales, the Australian market experienced a sharp decline starting on Feb. 20, 2020, together with the global stock market crash and oil price decline. Over the period from Feb. 20, 2020, to March 23, 2020, the S&P/ASX 200 dropped 35.9%. According to the factor index research outlined in our paper, quality and low volatility indices tended to outperform while value and small-cap indices tended to lag the benchmark during bearish markets.

During this market decline, most factor indices’ performances tended to align with their long-term characteristics. However, we noticed that the outperformance of the low volatility index was not as pronounced as what we saw in previous market sell-offs. According to the factor attribution, both the style factor exposures and stock-specific risk positively affected the return of the S&P/ASX 200 Low Volatility Index. However, the strong industry bias to REITs (one of the worst-performing industries during this period) severely dragged the index return and eroded the outperformance of the index.

Following a series of health and safety measures (closing borders, imposing social distance rules), interest rate cuts, and government stimulus and subsidy packages, the S&P/ASX 200 started to rebound after touching its lowest point on March 23, 2020. The S&P/ASX 200 posted a gain of 30.1% during the market rally from March 23, 2020, to June 30, 2020. Historically, momentum, quality, and small-cap indices tended to outperform their benchmarks, while value, dividend, and low volatility tended to underperform during bullish markets. However, in this recent rally, the S&P/ASX Quality Index underperformed the S&P/ASX 200 by 3.8% while the S&P/ASX Dividend Opportunities Index outperformed by 2.3%.

For the S&P/ASX 200 Quality Index, the targeted exposures to profitability and leverage, as well as the industry biases, contributed positively to the index return. The unintended exposure to short-term momentum negatively affected the index, resulting in underperformance. For the S&P/ASX Dividend Opportunities Index, the dividend yield and value factors generated negative returns in this period, though the industry biases (underweight in Consumer Staples and REITs; overweight in Metals & Mining [ex-Gold & Steel], Utilities, and Consumer Discretionary) and stock-specific risk contributed positively to the dividend index performance and led to index outperformance.

Overall, the S&P/ASX 200 Momentum and S&P/ASX 200 Quality Index were the best-performing Australian factor indices in the first half of 2020, while the S&P/ASX 200 Enhanced Value performed the worst. Most factor indices aligned with their long-term cyclical characteristics, with a small number of them showing different behavior largely due to industry biases and unintended factor exposures.

The posts on this blog are opinions, not advice. Please read our Disclaimers.

The S&P Systematic Global Macro Index – Catching the Trend

Contributor Image
Rupert Watts

Head of Factors and Dividends

S&P Dow Jones Indices

Trend-following strategies have the potential to outperform during periods of crisis, and that is exactly what the S&P Systematic Global Macro Index (S&P SGMI) did during the COVID-19-related drawdowns. Here we will examine this index and attribute its performance YTD.

The S&P SGMI is a trend-following strategy that takes long or short positions in 37 constituent futures across the following sectors: equites, commodities, fixed income, and FX. As Exhibit 1 shows, the index has returned 1.3% so far in 2020, and it performed particularly well during the height of the market volatility, finishing March 2020 up 11.3%.

The strong performance of the S&P SGMI in March 2020 was directly a function of the severe market conditions that prevailed across financial markets, combined with its flexible model that can adapt to the current environment. The model is designed to assess each constituent future individually to identify the most current, statistically relevant trend.

Importantly, the length of each constituent’s trend is dynamic, and only the most recent period of time when the trend was stable is used. This is determined using an iterative process that starts with the most recent 22-day period and adds five-day increments until the longest stable trend is identified using a statistical test.

Constituents are then risk-balanced to ensure no single sector or constituent drives the volatility of the index.

Attribution Analysis

In the first quarter of 2020, the S&P SGMI trend-following algorithm identified several moves, predominantly in commodities, where downward momentum in energy markets had gathered pace.

To highlight the role that commodities played, Exhibit 2 shows the performance of two standalone sub-indices computed using the same methodology as the S&P SGMI. The first is the S&P Systematic Global Macro Commodities Index (SGMI Commodities; the physical commodity futures component), and the second is the S&P Systematic Global Macro Financials Index (S&P SGMI Financials; the equity, fixed income, and FX components). Clearly, it was the S&P SGMI Commodities that performed particularly well in March 2020, finishing the month up 23.8%.

To further attribute the YTD performance, it is necessary to examine the position direction for the underlying constituents. Exhibits 3 and 4 show the position direction for the commodity and equity constituents within the S&P SGMI. Note that new positions are implemented from the second through the sixth business day of the month.

Starting with commodities, Exhibit 3 shows the index went short WTI and Brent in February 2020 and thus benefited from the plunge in energy, with WTI contributing 1.7% and Brent contributing 1.6% in March 2020 alone. In March, the index was also short gasoil, heating oil, and gasoline, which all had substantial declines, contributing 1.1%, 1.1%, and 1.8%, respectively.

Short positions in copper, cotton, live cattle, and corn contributed to profit in March 2020 as well, though far less substantially. The S&P SGMI was negatively affected by long positions in sugar (contributing -0.8% in March 2020), while long positions in precious metals did not have a material impact on the index.

The majority of commodities remained short in the second quarter of 2020, thus eroding some of the first quarter gains as most of them rebounded.

Exhibit 4 shows position directions for the equity index components. The S&P SGMI benefited from short positions taken in March 2020 in the S&P 500®, Nikkei 225, Dax, and Euro Stoxx 50, which offset losses from long positions in February 2020. The S&P 500 contributed -0.7% in February 2020 and 0.8% in March 2020 to finish the quarter positive.

Long positions in the Kospi 200 and Nasdaq 100 adversely affected performance in the first quarter; however, these latter two indices lost slightly less ground in March 2020 than the others. Overall, the equity asset class finished slightly down in the first quarter.

The S&P 500 and Nikkei 225 flipped to long in April 2020, while the Kospi 200 switched to short, meaning half the equity positions were long and half were short. The Dax and Euro Stoxx 50 went long in May 2020, leaving the Kospi 200 as the only remaining short position. Overall, the equity asset class finished slightly up for the second quarter.

The fixed income components switched from short in February 2020 to long in March 2020, and finished the quarter slightly down. They all remained long in the second quarter and did not contribute meaningful returns, as yields saw little change.

The majority of the FX positions were short in the first quarter (the British pound being the exception in March 2020), and all remained short versus the U.S. dollar in the second quarter.

Conclusion

Trend-following strategies can play an important role in client portfolios, offering the potential for diversifying returns during periods of market stress. Through its flexible model, the S&P SGMI was able to perform well through the initial stages of the COVID-19 crisis. As we enter the third quarter of 2020 with continued uncertainty around the coronavirus, it will be interesting to follow its future performance.

The posts on this blog are opinions, not advice. Please read our Disclaimers.

Active Managers’ Outperformance in Brazilian Bond Funds – Skill or Price Distortion?

Contributor Image
Maria Sanchez

Director, Sustainability Index Product Management, U.S. Equity Indices

S&P Dow Jones Indices

There were impressive results for active managers in the Brazil Corporate Bond Funds category, with 93.6% of them beating the benchmark in March 2020 and 88.2% Q1 2020. However, were these performance results due to true skill?

This outperformance may be related to a market distortion. On the one hand, Brazil’s corporate bond funds experienced record outflows in March 2020, forcing managers to sell, thereby increasing local bond spreads and distorting prices.[1] On the other hand, benchmark characteristics open a window of distortion; the Anbima Debentures Index represents a broad portfolio of debentures that is not necessarily replicable. This market segment is especially illiquid, and in stressful scenarios like the one that has occurred in 2020, the index may not reflect the real market.

Brazil Government Bond Funds

In the first quarter of 2020, 72.5% of active managers in the Brazil Government Bond Funds category beat the benchmark; this outperformance was driven mostly by larger funds, since the asset-weighted average fund return was 70 bps higher than the benchmark return.

Conclusion

Despite the positive results in the short term, fund performance worsened over longer horizons, as 84.8%, 92.0%, and 95.8% of Brazil Corporate Bond Fund managers underperformed the benchmark over the 3-, 5-, and 10-year periods, respectively. Likewise, 76.6%, 79.3%, and 84.7% of the Brazil Government Bond Fund managers underperformed the benchmark over the same periods, respectively.

Don’t miss the upcoming SPIVA® Latin America Mid-Year 2020 Scorecard to find out if the trend continued.

[1] https://www.bloomberg.com/news/articles/2020-04-17/banks-snap-up-new-brazil-local-bonds-as-funds-forced-to-look-on

The posts on this blog are opinions, not advice. Please read our Disclaimers.

The Beat Goes on for the S&P 500 Dividend Aristocrats

Contributor Image
Howard Silverblatt

Senior Index Analyst, Product Management

S&P Dow Jones Indices

The S&P 500® Dividend Aristocrats® is an index comprising companies in the S&P 500 that have increased their annual cash payments for at least 25 years in a row. Dividends are a part of their culture and public appeal (income), as they broadly highlight their increases. In general, their increases are smaller but still constant, and even in bearish markets, these companies have continued to increase (for example, the 2000-2002 Tech Bust, the 2008-2009 Global Financial Crisis, and most recently during the COVID-19 pandemic).

As of July 19, 2020, there were 65 issues in the S&P 500 Dividend Aristocrats, including the spun-off issues of Carrier and Otis (from United Technologies, which is now Raytheon) and after the removal of Ross Stores. Of the 65, 33 have already increased dividends, and both spin-offs have started to pay them. One issue, Ross Stores, suspended its dividend and was therefore removed before the market opening of July 1, 2020.

Because of the timing of the dividend increases, if none of the current issues were to change their dividend rate (no increases and no decreases) for the remainder of the year, all but one would pay more in 2020 than they did in 2019, an important requirement for membership in the S&P 500 Dividend Aristocrats. Some of the companies would have a “bye” in 2020, a sports term referring to when a team advances even though they did not compete in a match in that round.

Consider a company that paid quarterly dividends of USD 0.50, USD 0.50, USD 0.60, and USD 0.60 in 2019, and then paid four dividends of USD 0.60 in 2020; without an increase, the 2020 payment would be higher than that of 2019. Under this scenario, 28 issues would have a bye year and need to increase their actual payment rate in 2021 (“byes” are not common, with the last one being United Technologies in 2019, before its spin-off; Chevron in 2017; and Caterpillar in 2016). The sole company (at this time) that would not increase its dividend in 2020 over that of 2019 is VF Corporation, which, at its current rate, would pay USD 1.92 for 2020, compared with USD 1.93 in 2019 (through year-end 2019, it had increased dividends for 47 consecutive years).

The working base case for the Dividend Aristocrats is that they will pay through 2020, with some utilizing the “bye” feature. Of note (to the “bye” feature) are ExxonMobil and W.W. Grainger, which typically increase in April but did not this year, and Leggett & Platt and Lowe’s, which typically increase in May but did not. July 2020 has already produced traditional increases from PPG Industries, Stanley Black & Decker, and Walgreens Boots Alliance. August typically brings increases from Dover Corporation, Federal Realty Investment Trust, and Illinois Tool Works—but even if they did not increase, at their current rate, they will pay more in 2020 than they paid in 2019.

The bottom line for the Dividend Aristocrats appears to be that they will pay through Q3 2020, and absent a downturn (cash flow), they will also pay through Q4 2020. The number of increases may drop (use of the “bye”), and increases may be smaller than usual (with increases of one penny being the new wink). However, a small increase in their dividends would be preferable to those 62 issues in the S&P 500 that have cut since mid-March 2020.

The posts on this blog are opinions, not advice. Please read our Disclaimers.

Education Is the Armor That Can Protect You from Your Stomach

Contributor Image
Brent Kopp

Senior Director, Central Region, Wealth Management Channel

S&P Dow Jones Indices

I had the privilege to sit down, albeit virtually, with Larry Swedroe, Chief Research Officer at Buckingham Wealth Partners, after he participated in our webinar for financial advisors, “How Has COVID-19 Affected Active vs. Passive Performance?” to dig deeper into his thoughts on SPIVA® results during the first four months of 2020.

Brent Kopp (BK) – What was your biggest takeaway from the SPIVA data during the pandemic that we examined during the webinar?

Larry Swedroe (LS) – One of the biggest myths that Wall Street needs investors to believe to keep playing the game of active management and paying higher fees is that active management maybe doesn’t win in bull markets due to a cash drag, but these managers will protect you in bear markets. We might be willing to accept a lower return in the long run, provided we get insurance in the really bad market environments, especially if I’m a retiree in the withdrawal phase. The truth is active managers tend to actually do a little bit worse in bear markets than bull markets. One study found that, at every turning point in the market, the average active manager got it wrong. For example, when the market was at a peak in March 2000, active managers had the least amount of cash, and at the bottom in August 2009, they had the most amount of cash.

This data is in line with the period we examined in the webinar. During the initial stages of the COVID-19 crisis, we saw huge swings in the market. Even though active managers had the ability to go to cash, almost two-thirds still got it wrong and underperformed (see the top left pie chart of Exhibit 1).

Every year, I hear on CNBC that this is a stock picker’s year, but it has never been a stock picker’s year when you adjust for risk appropriately over time. Exhibit 2 shows the rolling five-year standard deviation of excess returns of U.S. large-cap mutual funds over the past five decades. You should expect to see wide dispersions when there are large differences in levels of skill. The trend of declining dispersion in excess returns fits with our narrative that the competition is getting tougher for active managers.

BK – What do you find works best in client conversations to keep them committed to their investment and savings plan?

LS – Most important is education up front on investment history. We will show the quilt chart of returns that shows that there is no pattern to when an asset class will perform best. They simply rotate, and it’s quite random. We teach our clients that asset classes have similar risk-adjusted returns, just like most factors have similar risk-adjusted returns. We lead with the evidence. There will be long periods of outperformance and long periods of underperformance in different asset classes, and we don’t want to jump around to chase performance. We tell our clients that you are going to be challenged, and there will be times when you’ll question the strategy, but here are the underlying principles based in history. Staying disciplined is important. As Warren Buffett said, “temperament trumps intelligence.” In March 2020, we were buying stocks, and in June 2020, we were selling stocks, because it takes about a 20% market move to trigger our rebalance process, which happened in both directions in the first half of the year. We were buying low and selling high, which every investor dreams of doing. Unfortunately, they usually do the opposite.

BK – Do you have any parting bits of wisdom for us?

LS – Sure. Education is the armor that can protect you from your stomach, and I’ve yet to meet a stomach that makes good decisions. Heads make much better ones.

If you are interested in hearing more from Larry Swedroe, along with Craig Lazzara and Berlinda Liu from S&P Dow Jones Indices, on these SPIVA results, please find the following link to the webinar replay: “How Has COVID-19 Affected Active vs. Passive Performance?”

You can also click on this link to access the Engagement Hub, which offers CE credit for S&P DJI webinar replays covering market trends including risk management, ESG, SPIVA, and more.

The posts on this blog are opinions, not advice. Please read our Disclaimers.