Get Indexology® Blog updates via email.

In This List

The Beat Goes on for the S&P 500 Dividend Aristocrats

Education Is the Armor That Can Protect You from Your Stomach

Latin American Equity Markets Staged Recovery in Q2 2020 despite Continuing Battle with COVID-19

Performance Trickery, part 4

Impact of Inflation Expectations on Retirement Income

The Beat Goes on for the S&P 500 Dividend Aristocrats

Contributor Image
Howard Silverblatt

Senior Index Analyst, Product Management

S&P Dow Jones Indices

The S&P 500® Dividend Aristocrats® is an index comprising companies in the S&P 500 that have increased their annual cash payments for at least 25 years in a row. Dividends are a part of their culture and public appeal (income), as they broadly highlight their increases. In general, their increases are smaller but still constant, and even in bearish markets, these companies have continued to increase (for example, the 2000-2002 Tech Bust, the 2008-2009 Global Financial Crisis, and most recently during the COVID-19 pandemic).

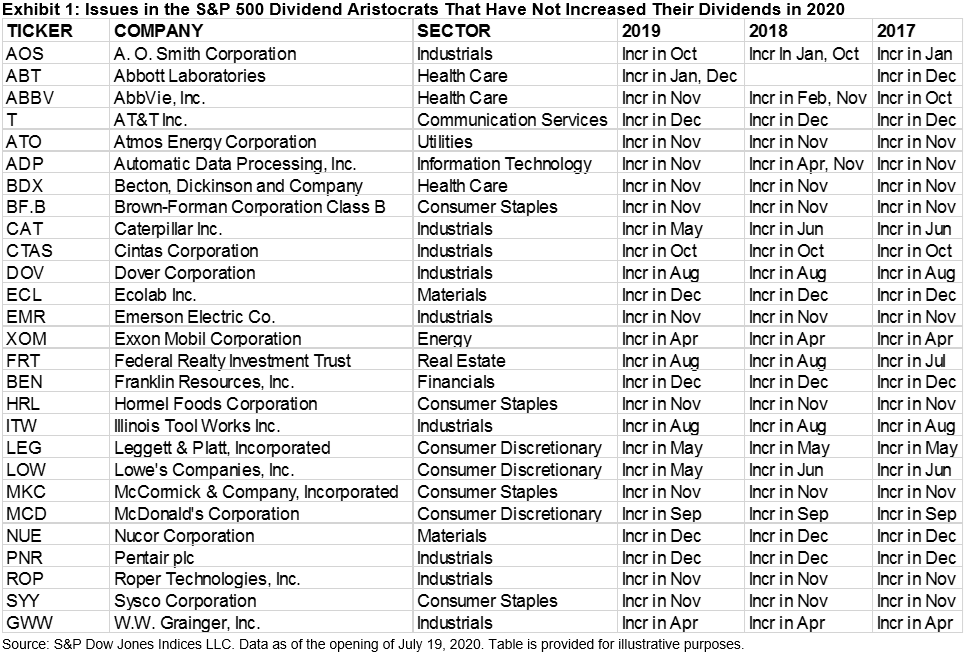
As of July 19, 2020, there were 65 issues in the S&P 500 Dividend Aristocrats, including the spun-off issues of Carrier and Otis (from United Technologies, which is now Raytheon) and after the removal of Ross Stores. Of the 65, 33 have already increased dividends, and both spin-offs have started to pay them. One issue, Ross Stores, suspended its dividend and was therefore removed before the market opening of July 1, 2020.

Because of the timing of the dividend increases, if none of the current issues were to change their dividend rate (no increases and no decreases) for the remainder of the year, all but one would pay more in 2020 than they did in 2019, an important requirement for membership in the S&P 500 Dividend Aristocrats. Some of the companies would have a “bye” in 2020, a sports term referring to when a team advances even though they did not compete in a match in that round.

Consider a company that paid quarterly dividends of USD 0.50, USD 0.50, USD 0.60, and USD 0.60 in 2019, and then paid four dividends of USD 0.60 in 2020; without an increase, the 2020 payment would be higher than that of 2019. Under this scenario, 28 issues would have a bye year and need to increase their actual payment rate in 2021 (“byes” are not common, with the last one being United Technologies in 2019, before its spin-off; Chevron in 2017; and Caterpillar in 2016). The sole company (at this time) that would not increase its dividend in 2020 over that of 2019 is VF Corporation, which, at its current rate, would pay USD 1.92 for 2020, compared with USD 1.93 in 2019 (through year-end 2019, it had increased dividends for 47 consecutive years).

The working base case for the Dividend Aristocrats is that they will pay through 2020, with some utilizing the “bye” feature. Of note (to the “bye” feature) are ExxonMobil and W.W. Grainger, which typically increase in April but did not this year, and Leggett & Platt and Lowe’s, which typically increase in May but did not. July 2020 has already produced traditional increases from PPG Industries, Stanley Black & Decker, and Walgreens Boots Alliance. August typically brings increases from Dover Corporation, Federal Realty Investment Trust, and Illinois Tool Works—but even if they did not increase, at their current rate, they will pay more in 2020 than they paid in 2019.

The bottom line for the Dividend Aristocrats appears to be that they will pay through Q3 2020, and absent a downturn (cash flow), they will also pay through Q4 2020. The number of increases may drop (use of the “bye”), and increases may be smaller than usual (with increases of one penny being the new wink). However, a small increase in their dividends would be preferable to those 62 issues in the S&P 500 that have cut since mid-March 2020.

The posts on this blog are opinions, not advice. Please read our Disclaimers.

Education Is the Armor That Can Protect You from Your Stomach

Contributor Image
Brent Kopp

Senior Director, Central Region, Wealth Management Channel

S&P Dow Jones Indices

I had the privilege to sit down, albeit virtually, with Larry Swedroe, Chief Research Officer at Buckingham Wealth Partners, after he participated in our webinar for financial advisors, “How Has COVID-19 Affected Active vs. Passive Performance?” to dig deeper into his thoughts on SPIVA® results during the first four months of 2020.

Brent Kopp (BK) – What was your biggest takeaway from the SPIVA data during the pandemic that we examined during the webinar?

Larry Swedroe (LS) – One of the biggest myths that Wall Street needs investors to believe to keep playing the game of active management and paying higher fees is that active management maybe doesn’t win in bull markets due to a cash drag, but these managers will protect you in bear markets. We might be willing to accept a lower return in the long run, provided we get insurance in the really bad market environments, especially if I’m a retiree in the withdrawal phase. The truth is active managers tend to actually do a little bit worse in bear markets than bull markets. One study found that, at every turning point in the market, the average active manager got it wrong. For example, when the market was at a peak in March 2000, active managers had the least amount of cash, and at the bottom in August 2009, they had the most amount of cash.

This data is in line with the period we examined in the webinar. During the initial stages of the COVID-19 crisis, we saw huge swings in the market. Even though active managers had the ability to go to cash, almost two-thirds still got it wrong and underperformed (see the top left pie chart of Exhibit 1).

Every year, I hear on CNBC that this is a stock picker’s year, but it has never been a stock picker’s year when you adjust for risk appropriately over time. Exhibit 2 shows the rolling five-year standard deviation of excess returns of U.S. large-cap mutual funds over the past five decades. You should expect to see wide dispersions when there are large differences in levels of skill. The trend of declining dispersion in excess returns fits with our narrative that the competition is getting tougher for active managers.

BK – What do you find works best in client conversations to keep them committed to their investment and savings plan?

LS – Most important is education up front on investment history. We will show the quilt chart of returns that shows that there is no pattern to when an asset class will perform best. They simply rotate, and it’s quite random. We teach our clients that asset classes have similar risk-adjusted returns, just like most factors have similar risk-adjusted returns. We lead with the evidence. There will be long periods of outperformance and long periods of underperformance in different asset classes, and we don’t want to jump around to chase performance. We tell our clients that you are going to be challenged, and there will be times when you’ll question the strategy, but here are the underlying principles based in history. Staying disciplined is important. As Warren Buffett said, “temperament trumps intelligence.” In March 2020, we were buying stocks, and in June 2020, we were selling stocks, because it takes about a 20% market move to trigger our rebalance process, which happened in both directions in the first half of the year. We were buying low and selling high, which every investor dreams of doing. Unfortunately, they usually do the opposite.

BK – Do you have any parting bits of wisdom for us?

LS – Sure. Education is the armor that can protect you from your stomach, and I’ve yet to meet a stomach that makes good decisions. Heads make much better ones.

If you are interested in hearing more from Larry Swedroe, along with Craig Lazzara and Berlinda Liu from S&P Dow Jones Indices, on these SPIVA results, please find the following link to the webinar replay: “How Has COVID-19 Affected Active vs. Passive Performance?”

You can also click on this link to access the Engagement Hub, which offers CE credit for S&P DJI webinar replays covering market trends including risk management, ESG, SPIVA, and more.

The posts on this blog are opinions, not advice. Please read our Disclaimers.

Latin American Equity Markets Staged Recovery in Q2 2020 despite Continuing Battle with COVID-19

Contributor Image
Silvia Kitchener

Director, Global Equity Indices, Latin America

S&P Dow Jones Indices

We have made it through the first half of 2020. Despite the continued spread of COVID-19 wreaking havoc on public health and the global economy, the markets did surprisingly well during Q2. In the U.S., the equity market rebounded from Q1, driven by government stimulus packages and the easing of restrictions imposed during the pandemic. The S&P 500® gained 20.5%, while the S&P Latin America 40, which is designed to measure the 40 largest, most liquid companies in the region, followed close behind, gaining 19.5%. However, Latin America was still deep in the red YTD, down 35.9%.

Among S&P Latin America BMI sectors, Information Technology (63.2%), Consumer Discretionary (47.6%), and Energy (41.2%) were the best performers for the quarter. In this new era of working, shopping, and recreation from home, online-based companies like Brazil’s PagSeguro Digital and StoneCo Ltd, which help businesses manage their e-commerce services, seem to be booming in emerging markets, as shown by their price appreciation. It will be interesting to see how industries quickly adapt to the “new normal” and not only survive, but also thrive.

In terms of countries, Argentina led the pack with the S&P MERVAL Index gaining 58.7% in local currency for the quarter. Brazil came in second, with a return of 31.2% as reflected by the S&P Brazil BMI. Peru’s S&P/BVL Peru General Index returned 16.7%. Chile’s S&P IPSA also had a strong quarter, with a gain of 13.5%. Colombia barely stayed afloat, with a lower return of 1.4% for the S&P Colombia BMI. Year-to-date, the countries’ returns were still in the red, with Colombia the worst and Argentina at the top with single-digit negative returns. There is still a lot of work ahead before the region stabilizes. Pre-pandemic, there were already significant domestic troubles: social unrest in Chile, economic woes in Argentina, and political instability in Brazil, among other issues. Added to this mix, the pandemic of the century and the economic damage it is leaving behind will likely make for a tough recovery.

Despite the strong quarterly returns, many economists[1] (not surprisingly) are predicting an uphill battle for the region. As the COVID-19 pandemic spreads and conditions worsen in several countries, S&P Global Ratings economists are reducing the 2020 GDP growth forecast to a contraction of roughly 7.5%. Growth for 2021 is expected to be around 4% and economic recoveries are expected to be slower than originally predicted. To put it in context, GDP for the U.S. is forecast to grow 4.8% for 2021.[2] S&P Global Ratings expectations are that economies that implemented strong policy support, such as Chile and Peru, may have “smaller permanent GDP losses.” It adds that the story may be different in countries like Mexico and Brazil, where support has been more limited.

In this environment of uncertainty, it is interesting to see how some specialized indices have performed. The following charts show the performance for the quarter and YTD of the sustainability and ESG indices for Chile, Mexico, and the Pacific Alliance, compared to the local broad benchmark and flagship index.

It is worth noting that the Dow Jones Sustainability Indices (DJSI), like the ones for Chile and the Pacific Alliance, have a different methodology than other ESG indices, as is the case of the S&P/BMV Total Mexico ESG Index. The main difference is that the DJSI series uses the “best-in-class” approach selecting a small percentage of companies with the highest scores within their respective industries. The ESG index also focuses on companies with the highest ESG scores, however, it has a broader scope in coverage, aiming to maintain low tracking error compared to its benchmark. It also applies certain exclusions in order to align with the basic principles of sustainability. Regardless, the data shows that sustainability indices have either outperformed, as in the case of Mexico, or have performed in line with their respective country indices.

A group that is having a resurgence around the world in the midst of COVID-19 is the small-cap segment. The report shows that small-cap indices (such as Brazil’s S&P/B3 SmallCap Select Index) had a great quarter (29.1%) and stable one-year return (3.4%). Likewise, Mexico’s S&P/BMV IRT SmallCap gained 24.1% for Q2 and 0.8% for the one-year period. Chile’s S&P/CLX IGPA SmallCap hung on to its five-year return (5.6%), not a small feat given that for these comparable periods, all other indices’ were far behind it.

There is no doubt that it has been a tough year, but where there is chaos, there is opportunity. Let us find it.

For more information on how Latin American benchmarks performed in Q2 2020, read our latest Latin America Scorecard.

[1] Latin American Economies Are Last in and Last out of the Pandemic. S&P Global Ratings. Elijah Oliveros-Rosen. June 30, 2020.

[2] U.S. Economic Outlook. FocusEconomics June 2, 2020. https://www.focus-economics.com/countries/united-states.

The posts on this blog are opinions, not advice. Please read our Disclaimers.

Performance Trickery, part 4

Contributor Image
Craig Lazzara

Former Managing Director, Index Investment Strategy

S&P Dow Jones Indices

As a potential investor, would you be impressed by the pattern of fund returns summarized in Exhibit 1?  (I would be.)

Exhibit 1. Portfolio and Benchmark Cumulative Returns

Over the course of 15 years, the portfolio in question notched a total return of 69%, versus only 50% for its benchmark.  The accumulation of added value seems reasonably steady, and the portfolio doesn’t appear to be substantially more volatile than the benchmark, an impression that’s confirmed by the annual data in Exhibit 2.

Exhibit 2. Portfolio and Benchmark Annual Returns

The portfolio generated 0.62 units of return for every unit of volatility, while the benchmark’s return/risk ratio was 0.53.  Not only did the portfolio outperform in absolute terms, in other words, it also outperformed after adjustment for risk.

One of your colleagues is as impressed as you are with value added shown by Exhibits 1 and 2.  He’s so impressed, in fact, that he prepares Exhibit 3, the better to admire the accumulation of alpha.

Exhibit 3. Portfolio’s Cumulative Value Added

If we pull on this thread, the fabric begins to unravel.  The cumulative value added shown in Exhibit 3 – roughly 19% – is consistent with the total returns we observed in Exhibit 1.  But now it becomes clear that the majority of the value added came very early in our 15-year history.  What’s going on?  Exhibit 4 illuminates the issue by showing annual, rather than cumulative, value added.

Exhibit 4. Annual Value Added

For the first three years, the portfolio handily outperformed its benchmark.  For the subsequent twelve years, its value added was exactly zero – positive 50 basis points one year and negative 50 basis points the next.  After year three, the portfolio and the benchmark rose by almost exactly the same amount.  Although no new value added was generated, the initial margin is algebraically certain to increase as long as the market goes up.

As with many things in performance accounting and fund marketing, data can be accurate and misleading at the same time.  Exhibit 1, though accurate, gives the impression that the portfolio’s managers have added value steadily for the last 15 years.  Exhibit 4 reveals that their value-adding days ended more than a decade ago.  As we’ve advised before, whenever you examine a performance history, disaggregate.  If the value added is real, it will show up in annual or quarterly numbers.  If it’s not real, it might still appear in cumulative returns.  Users of more granular data are less likely to be misled.

The posts on this blog are opinions, not advice. Please read our Disclaimers.

Impact of Inflation Expectations on Retirement Income

Contributor Image
Hamish Preston

Head of U.S. Equities

S&P Dow Jones Indices

Our latest S&P STRIDE dashboard showed a dramatic increase in the cost of retirement income for various retirement dates (vintages) in Q2.  For example, the present value of an inflation-adjusted stream of cash flows equal to USD 1 per year – or USD 1/12 per month – starting in 2065 and ending 25 years later, rose 19.07% since March.  This increase nearly matched the S&P Composite 1500’s 20.8% quarterly gain.

Even more striking was the fact that the cost of retirement income rose above USD 25 for most vintages, the first time any such measure recorded a quarter-end reading above USD 25 (based on data since January 2016). A key driver of this observation was negative real interest rates.

Calculating the present value of inflation-adjusted cash flows requires us to use real interest rates for discounting; “real” meaning that they account for inflation expectations.  Exhibit 2 shows the real yield curve at the end of June.  Appendix II in the S&P STRIDE index series methodology outlines the process for constructing the curve but suffice to say that it is calculated by:

  • Using data from six S&P U.S. TIPS indices (1-5 years, 7-10 years, 10 years, 10-15 years, 15 years plus, 30 years) to obtain real interest rates across various maturities, and;
  • Interpolating to obtain the entire real yield curve.

The yield curve is assumed to be flat for maturities that are shorter than the duration of the S&P 1-5 Year U.S. TIPS index (approx. 3 years) and longer than the duration of the S&P 30 Year U.S. TIPS index (approx. 30 years).  This means the 3-year and 30-year real interest rates are used to discount hypothetical monthly payments in the near-term and very far into the future, respectively.

Exhibit 2 shows that the entire U.S. real yield curve was negative at the end of June. Hence, the present value of each hypothetical monthly payment was greater than USD 1/12, resulting in cost of retirement income figures over USD 25 for most vintages. 2005, 2010 and 2015 offered the exceptions as the post-retirement vintages have fewer than 25 years of payments remaining.

The Fisher equation tells us that real interest rates can be approximated by the difference between nominal interest rates and inflation expectations: real interest rates rise as nominal interest rates rise or inflation expectations fall, and vice versa.  Since nominal U.S. interest rates were low and stable in Q2, negative real interest rates and the recent increases in cost of retirement income appear to reflect investors’ rising inflation expectations.

The sizeable monetary stimulus likely fueled this as economic theory tells us that, all else equal, increases in the money supply are inflationary – in theory, giving people additional money to spend drives up demand for goods, causing prices to rise.

Of course, inflation may not rise as expected: people made similar predictions following central bank intervention during the Financial Crisis. Nonetheless, since one of the main risks for retirees is not having enough inflation-adjusted retirement income to support their desired standard of living, investors may wish to consider retirement strategies that have an explicit focus on reducing the volatility of retirement income – such as the S&P STRIDE index series.  Indeed, post-retirement S&P STRIDE vintages have far higher TIPS allocations than their S&P Target Date counterparts, making them more insulated against changes in expected inflation.

To sign up for the S&P STRIDE: Cost of Retirement Income dashboard, please use this link.

The posts on this blog are opinions, not advice. Please read our Disclaimers.