Get Indexology® Blog updates via email.

In This List

Did Latin American Active Managers Outperform in This Tumultuous Time?

Battle of Factors: Low Volatility versus High Beta

A YTD History of S&P 500® Dividend Increases, Cuts, and Suspensions

Indian Capital Markets Followed Global Trends in the First Half of 2020

A Cast of Crude Oil Indices

Did Latin American Active Managers Outperform in This Tumultuous Time?

Contributor Image
Maria Sanchez

Director, Sustainability Index Product Management, U.S. Equity Indices

S&P Dow Jones Indices

Low volatility and dispersion make it harder for active managers to add value. In other words, high volatility and high dispersion environments are expected to favor active managers to demonstrate their skill. In this aspect, March 2020 offered an opportunity to active managers[1] across the world, including in Latin American equity markets. High dispersion and volatility extended through May 2020.

Despite the circumstances, the majority of equity active managers in Brazil and Chile failed to outperform their respective benchmarks in 2020. While the strong performance of Brazil Large-Cap Funds shown in the SPIVA® Latin America Scorecard Year-End 2019 continued in the one- and three-year periods ending May 31, 2020, on a long-term basis, it was not so.

During Q1 2020, Brazil Mid-/Small-Cap Funds outperformed, which could be based on stock selection skill or a style drift across the capitalization scale. Given that over the longer term, a majority (88% for the 10-year period) of Brazil Mid-/Small-Cap Fund active managers were not able to outperform their benchmark, it’s more likely that the Q1 2020 success was due to style drift, incorporating some larger companies in the fund composition.[2]

Asset-weighted returns were generally lower than equal-weighted returns, suggesting that the first quarter was more challenging for larger funds across Latin American countries.

Mixed early 2020 results in the short term highlighted the difficulty of timing the market. For the first quarter, the majority of Brazil Mid-/Small-Cap Funds beat their respective benchmark. In the period from January to May 2020, Mexican equity active funds were the only ones that mostly outperformed their benchmark. Lastly, in the one-year period ending May 31, 2020, the success story was in the hands of Brazil Equity Funds and Brazil Large-Cap Funds.

The results were not just varied in the short term but ephemeral, since in the longer-term 5- and 10-year periods, a majority of actively managed funds underperformed their respective benchmarks across countries and styles.

As volatility remains high and dispersion above average, let’s see if results are more favorable for active managers in the next SPIVA® Latin-America Mid-Year 2020 Scorecard.

[1] Index Dashboard: Dispersion, Volatility & Correlation March 2020

[2] Performance Trickery, Part 3

The posts on this blog are opinions, not advice. Please read our Disclaimers.

Battle of Factors: Low Volatility versus High Beta

Contributor Image
Pavel Vaynshtok

Former Managing Director, Global Head of Strategy Indices

S&P Dow Jones Indices

2020 has surprised us all with a number of firsts. Not only did we witness wild swings in the market from one quarter to the next, we also saw an unusual performance of commonly followed factors. While this blog will not attempt to predict factor performance, it will address recent factor behavior and put this behavior into historical context.

The magnitude of market returns during Q2 2020 was impressive, with the S&P 500® returning 20.5% for the quarter. This comes on the heels of a similarly dramatic, albeit negative, showing during Q1 2020, when the index fell by 19.6%. The whipsawing of the market from one quarter to the next is extraordinary when compared with the historical median S&P 500 quarterly return of 3.5% and a median Q2 return of 3.2% (see Exhibit 1).

Factor performance was just as extreme and, in many cases, nearly a mirror opposite of Q1 2020. The S&P 500 High Beta Index (High Beta) and S&P 500 Low Volatility Index (Low Volatility) were the noteworthy outliers during Q2 2020. While High Beta staged a strong comeback, Low Volatility lagged the market and was the worst-performing factor.

It is perhaps not surprising that these factors exhibited the behavior that they did in the Q2 2020. After all, High Beta’s historical return dispersion was the highest among the factors analyzed, while Low Volatility’s dispersion was the lowest (see Exhibit 2). The relative magnitude of their respective bounceback in Q2 2020 makes sense in the context of these factors’ historical return dispersions.

In a further display of how anomalous this past quarter was, Exhibit 2 highlights that nearly every factor’s return was at the extreme of its historical distribution, with a notable exception of the S&P 500 High Dividend Index. We wrote earlier about the reasons for the disappointing performance of dividends in Q1 2020[1] (the underperformance of defensive sectors and low volatility, and the outperformance of growth over value). The bounceback of dividends in Q2 2020 was underwhelming, driven by some of the same dynamics that carried over from Q1 2020.

With High Beta and Low Volatility near the extremes of their historical performance, how have these strategies fared over the long term? High Beta is a curiosity. The Capital Asset Pricing Model[2] tells us that a security’s return should be proportional to its risk. Yet, High Beta’s historical performance has been disappointing (see Exhibit 3). Low Volatility, on the other hand, has had superior risk-adjusted returns, despite its mediocre absolute return profile. The power of Low Volatility has consistently come from its low return dispersion—with smaller drawdowns, the factor has less to gain back after a tough period than a factor with larger drawdowns.

The longer-term return differential between High Beta and Low Volatility is striking (see Exhibit 4). High Beta did indeed have its time in the sun, but the dot-com period of 1998-2000 was relatively brief. The exhibit is truly a testament to the power of compounding and long-term holding discipline. While the Q2 2020 resulted in unexpected returns for many factors, it is the anomalous performance of High Beta and Low Volatility that should give a pause to market players chasing short-term performance.

[1] Cheng, “Why Did Dividend Indices Underperform during the Coronavirus Sell-Off?” 2020

[2] https://en.wikipedia.org/wiki/Capital_asset_pricing_model

The posts on this blog are opinions, not advice. Please read our Disclaimers.

A YTD History of S&P 500® Dividend Increases, Cuts, and Suspensions

Contributor Image
Howard Silverblatt

Senior Index Analyst, Product Management

S&P Dow Jones Indices

Back in mid-February 2020, S&P 500 issues were easily on track to set their ninth annual record for dividend cash payments, as forecasts called for double-digit 2020 returns. By month-end February, 113 issues in the S&P 500, 22% of the index, had increased their dividends, with no cuts (and certainly no suspensions), and Q1 2020 went on to return a record USD 127 billion of cash payments to holders.

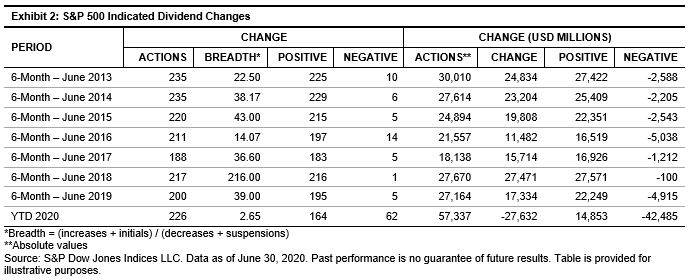
All was good until the word “corona” turned from a beer order into a virus. By the end of June, four months later, the index posted 49 additional increases (with lower increases; the Q2 2020 average increase was 7.50% versus Q1 2020’s 9.01% and Q2 2019’s 11.03%), along with 62 decreases, with 41 of the 62 being suspensions (the last suspension was in 2017 by PG&E). Still, the Q2 2020 payments held up, as companies fulfilled their prior declarations, returning USD 119 billion to holders. The amount was higher on a year-over-year basis (0.3% over Q2 2019), but 6.2% lower than the record Q1 2020 payment. Because of the record Q1 2020 payment, the payment for the first half of 2020 was 5.1% higher on a year-over-year basis.

However, the announcements of Q2 2020 payments that started in March paint a different picture of the second half of 2020. The first half produced USD 14.9 billion in announced increases and USD 42.5 billion in cuts, resulting in a USD 27.6 billion reduction in dividends, with the immediate result of lower declared payments for Q3 and Q4 2020.

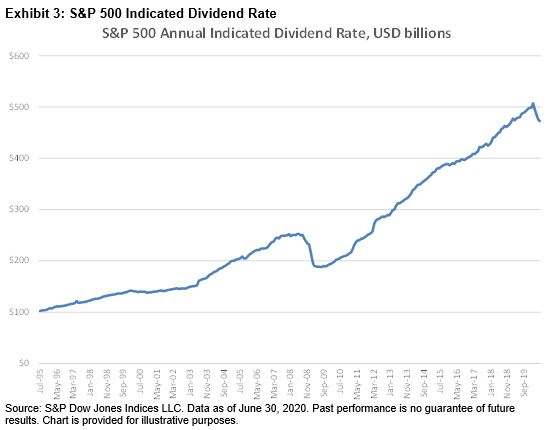
If one thinks of dividends as a paycheck, a 25-year wage growth, compounded using actual cash payments, amounts to 6.4% annualized. The annualized growth from the full recovery from the financial downturn to YTD was higher, at 7.6%. From February 2020, when dividend rates reached an all time high, to now, the drop was equivalent to taking a 6.8% pay cut.

At the moment, the 2020 estimate for payments from S&P 500 issues has improved to a 2% decline in the actual 2020 payment over 2019, compared with May’s decline estimate of a 3%-4% decline. The last down dividend year for the index was in 2009 (-21.07%).

Taken all together, the swift dividend cuts and suspensions have overpowered smaller and fewer increases for S&P 500 companies. Going forward, if the reopening continues to be positive for the economy, the major damage of cuts and suspensions could be behind us. It is worth noting that while the current working estimate for S&P 500 issues has improved, it remains contingent on the reopening.

The posts on this blog are opinions, not advice. Please read our Disclaimers.

Indian Capital Markets Followed Global Trends in the First Half of 2020

Contributor Image
Ved Malla

Associate Director, Client Coverage

S&P Dow Jones Indices

2020 has been overshadowed by the COVID-19 outbreak and the subsequent lockdown across the world. Capital markets have been negatively affected globally as well as locally in India. The lockdown in India began during the third week of March 2020 and has only recently been slightly relaxed. The first half of 2020 was volatile for the capital markets in India. All size indices and most sector indices posted negative returns for the six-month period ending June 2020.

Exhibits 1 and 2 showcase the six-month returns for India’s leading size indices for calendar year 2020.

From Exhibits 1 and 2, we can see that the returns for large-, mid-, and small-cap segments for the first six months of 2020 were negative. The large-cap indices posted the lowest returns among the size indices. The S&P BSE SENSEX, which comprises the 30 largest and most-liquid listed companies in India, provided a negative return of nearly -15% over the first half of 2020. However, after a free fall that lasted until the end of March 2020, we have seen a good recovery in all the size indices. The S&P BSE SmallCap has had a better recovery than the large- and mid-cap indices.

Exhibits 3 and 4 showcase returns for the 11 leading sector indices in India over the past six months.

From Exhibits 3 and 4, we can see that the S&P BSE Healthcare and S&P BSE Telecom posted strong six-month absolute returns of 21.61% and 17.33%, respectively. The S&P BSE Realty, S&P BSE Finance, and S&P BSE Industrials posted the lowest absolute returns of -30.50%, -29.38%, and -19.85, respectively, for the first half of 2020.

To summarize, we can say that the Indian capital markets fell sharply in the first quarter of 2020, especially in the month of March. However, there has been a recovery in the second quarter, although the six-month returns were still negative.

The posts on this blog are opinions, not advice. Please read our Disclaimers.

A Cast of Crude Oil Indices

Contributor Image
Fiona Boal

Managing Director, Global Head of Equities

S&P Dow Jones Indices

Over the past two decades, innovation in futures-based commodity indexing has allowed for the launch of commodity indices beyond broad market beta indices and into more sophisticated strategies with non-traditional roll mechanisms or contract selection.

In that vein, S&P Dow Jones Indices (S&P DJI) offers a wide variety of oil indices that offer exposure at different points along the crude oil futures curve, allowing market participants to select the index that best meets their investment requirements. For example, the S&P GSCI Crude Oil Dynamic Roll employs a flexible monthly futures contract rolling strategy and is designed to meet the demands of investors seeking to alleviate the negative impact of rolling during periods of contango.

Indices based on longer-dated contracts, such as the S&P GSCI Crude Oil 12 Month Forward, can also meet the needs of investors who prefer energy exposure with lower volatility or exposure that better reflects the long-term cost of oil production. Longer-dated indices can also be useful as a benchmark for real asset investments.

Oil indices based on multiple contracts are the newest offerings in commodity indexing. On June 15, 2020, S&P DJI launched the S&P GSCI Crude Oil Multiple Contract 55/30/15 1M/2M/3M. Instead of being represented by only one contract month, the index takes positions in three separate futures contract months. The S&P GSCI WTI crude oil contract production weights are distributed among the three contract months as follows: 55% is assigned to the contract month represented by the 1-month forward index, 30% is assigned to the contract month represented by the 2-month forward index, and 15% is assigned to the contract month represented by the 3-month forward index.

Multiple contract indices can add to or detract from index performance depending on the shape of the futures curve. During periods of contango, the indices benefit compared to the strategy that invests in rolling front-month futures contracts, but the reverse would take place during periods of backwardation. In light of the ongoing discussions among regulators, futures exchanges, and sponsors of financial products regarding position limits in commodity futures, financial products that are based on multiple contract indices may also find it easier to manage risk.

There are energy indices based on a broader range of petroleum products, ranging from Brent crude oil to oil products such as gasoline and heating oil. While crude oil product markets can be less liquid than crude oil, periods of deep structural contango generally occur less often in these markets, which may make indices based on these commodities more appealing to long-only investors with extended investment time horizons.

A broad range of energy indices exist today in the market, each tracking the performance of the oil market across different market segments and across the futures curve.

The posts on this blog are opinions, not advice. Please read our Disclaimers.