Get Indexology® Blog updates via email.

In This List

Is Alpha Generation a Zero-Sum Game in Indian Large-Cap Equities?

Do Management Fees Outweigh the Alpha Generated in Indian Equity Large-Cap Funds?

Market Dynamics Amid CARES Act Influx

Q1 2020 Australia SPIVA® Results – Outperformance Still Prevalent Despite Market Volatility

Move over Millennials: ESG Investing Is a Multigenerational Conversation

Is Alpha Generation a Zero-Sum Game in Indian Large-Cap Equities?

Contributor Image
Akash Jain

Director, Global Research & Design

S&P BSE Indices

Globally, as markets have matured, we have seen the institutional share of public equity increasing.[1] Professional managers are continuing to enter the investment management industry, resulting in market research becoming more institutionalized. Hence, more and more industry research analysts are competing against each other and chasing the same set of stocks to generate alpha (or excess returns over the benchmark). This has been one of the factors impeding active fund manager’s ability to exploit information asymmetry to generate alpha. A similar scenario seems to be unfolding in the Indian Equity Large-Cap category, where generating alpha is becoming increasingly difficult for active fund managers, as seen in the SPIVA India Scorecards over the years.

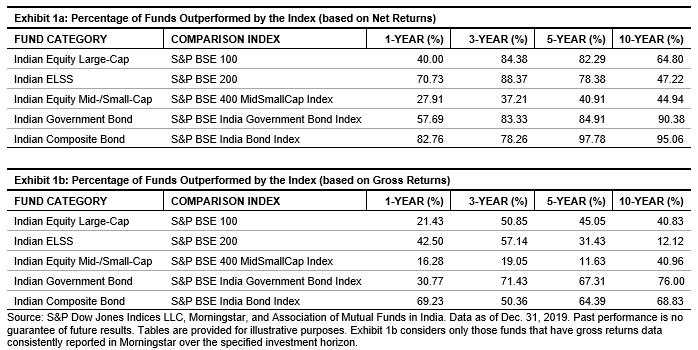
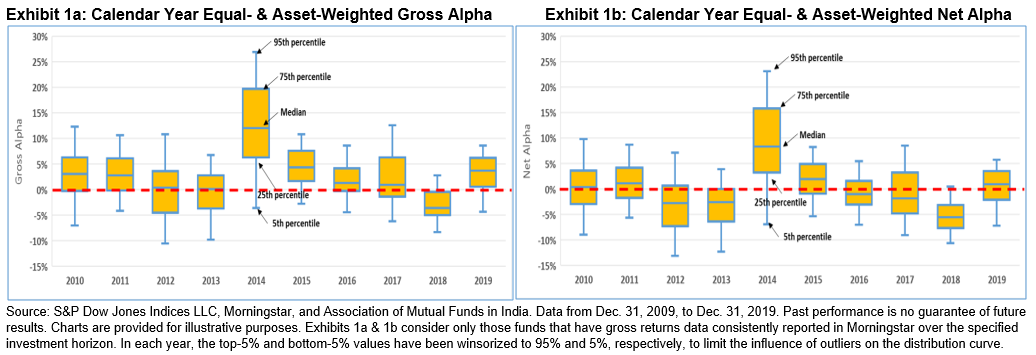
Each box in Exhibits 1a and 1b showcases the spread in alpha[2] generated by Indian Large-Cap Equity active funds in a calendar year. Exhibit 1a calculates alpha based on gross returns minus the S&P BSE 100 (TR) returns (benchmark for large-Cap funds in India), whereas Exhibit 1b is based on excess net-of-fees returns over the benchmark. The exhibits show that there is a wide spread in alpha generated by funds. Exhibit 1a shows that in each calendar year, a fairly large proportion of active fund managers failed to beat the S&P BSE 100 benchmark on a gross-returns basis, i.e., even without deducting management fees. The story looks even more dismal when we look at net alpha (Exhibit 1b), where the median active fund beats the benchmark in only 5 of 10 years.

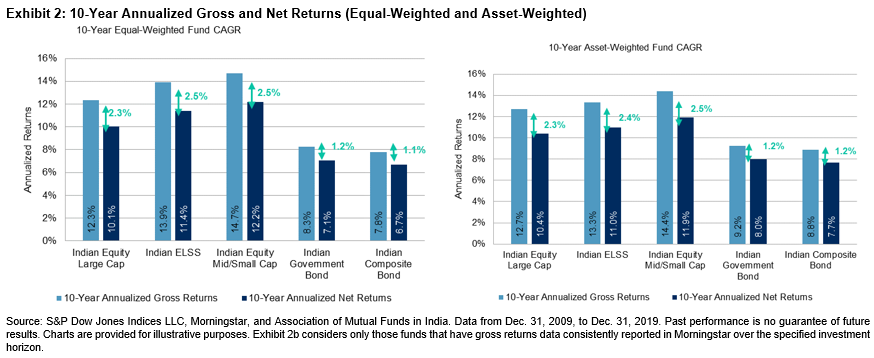
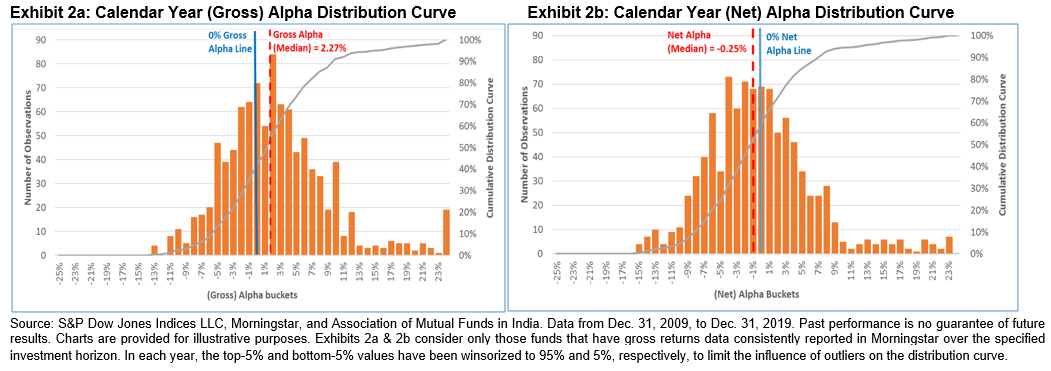
Each observation in Exhibit 2a shows the distribution of yearly gross alpha for the large-cap category funds for each calendar year from 2010 to 2019,[3] and the gray line is the cumulative distribution curve of all the observations. Exhibit 2b shows the same based on net alpha. According to the gross return distribution in Exhibit 2a, almost 35% of the observations lie to the left of the vertical line that represents the “0% gross alpha.” In other words, 35% of the observations had negative gross returns. When we generate the same chart for net alpha, the distribution curve shifts to the left, with nearly 52% of the observations that lie to the left of the vertical line representing “0% net alpha.” Both charts show that alpha distribution is skewed to the right with a few outlier observations pulling the return alpha average values to the right, while the median values lie to the left of the mean values.

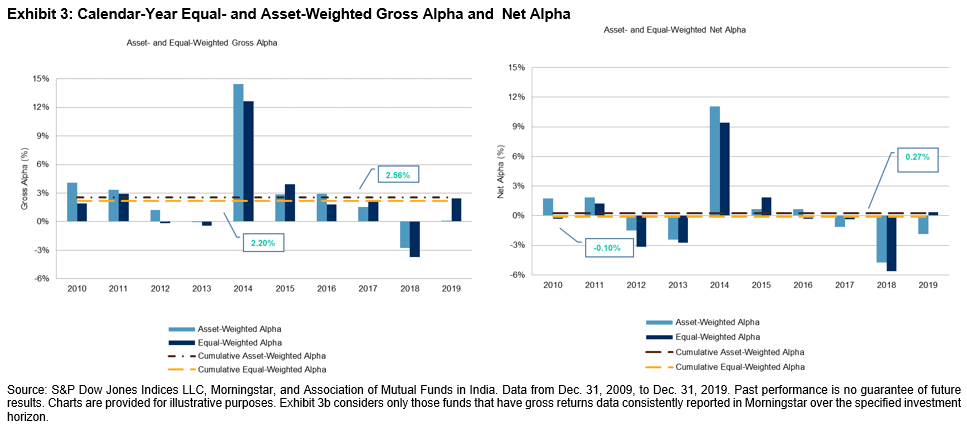
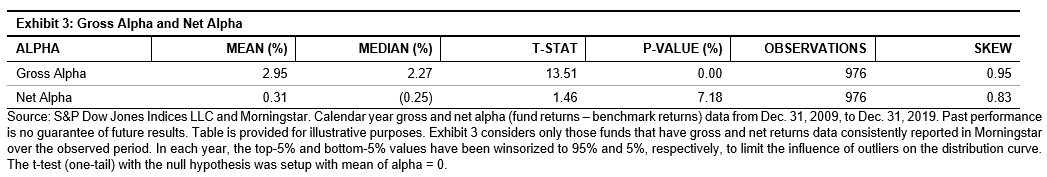
We also conducted a t-test (one-tail) to investigate if the gross alpha and net alpha are significantly greater than 0. Exhibit 3 shows that at a 95% confidence level, gross alpha is significantly greater than 0%. However, the same does not hold true for net alpha. In addition, the mean values exceed the median values for both the gross and net alpha, indicating the gross and net alphas are skewed positively by a few high return funds in the large-cap fund category. These results show the challenges of fishing for outperforming active large-cap funds over the long term.

The short answer to the question in the title of the blog is: quite nearly. With vanishing alpha, it may have long lasting implications for the active management industry where the most skilled managers survive and the funds that lie consistently on the left tail of the curve in Exhibit 2 would face strong challenge to grow or survive for long periods. Based on our SPIVA India Year-End 2019 Scorecard, 68.8% of funds in this category did not survive for the 10-year period ending in December 2019. With the competition that the increasing number of passive investment products brings, active fund managers may find themselves under pressure to generate higher gross alpha over the benchmark or to moderate costs and fees in an attempt to offer enhanced (net) alpha to investors.[4]

[1] https://www.oecd.org/corporate/Owners-of-the-Worlds-Listed-Companies.pdf

[2] Gross alpha = gross returns – benchmark returns; net alpha = net returns – benchmark returns; net returns = gross returns – management fees

[3] Therefore each large-cap fund (that survives and reports during the period from 2010 to 2019) will contribute 10 observations to the histogram. Only funds that survived and reported returns during the entire calendar year were considered for alpha calculations.

[4] This is analysis is inspired from an earlier research carried out by Vanguard for mutual funds domiciled in the U.S. https://personal.vanguard.com/pdf/ISGZSG.pdf

The posts on this blog are opinions, not advice. Please read our Disclaimers.

Do Management Fees Outweigh the Alpha Generated in Indian Equity Large-Cap Funds?

Contributor Image
Akash Jain

Director, Global Research & Design

S&P BSE Indices

Without Fees, Do Active Managers Outperform their Benchmarks?

The SPIVA® India Year-End 2019 Scorecard shows that, over longer horizons, a large proportion of active funds underperform their respective category benchmarks (see Exhibit 1a). The SPIVA India Year-End 2019 Scorecard evaluates the performance based on net-of-fees returns (i.e., gross returns less the management fees). But do active fund managers fare better when evaluated based on gross returns? In this blog, we have evaluated the results of the SPIVA India Year-End 2019 Scorecard on a gross-return basis (see Exhibit 1b). One can notice that in most categories, even without the deduction of management fees, still a fairly large percentage of active funds failed to beat their benchmarks. For example, over the 10-year horizon, more than 40% of active funds in the large-cap and mid-/small-cap categories underperformed the S&P BSE 100 and S&P BSE 400 MidSmallCap Index, respectively (see Exhibit 1b). Even the government and composite bond categories had over 65% of their funds underperform their respective benchmarks based on gross returns. An investor may therefore be wary of paying a management fee in return for worse-than-benchmark fund returns even on a gross-return basis.

Estimating Expense Ratios for Each Fund Category

Exhibit 2 shows the 10-year annualized gross and net-of-fees returns for each category on an equal-weighted basis, while Exhibit 2b shows the same but based on an asset-weighted basis (i.e., returns are weighted by funds’ AUM); Exhibit 2 reflects the returns for every dollar amount invested in that category. The difference between the gross CAGR and net CAGR is a proxy of the annualized management fees paid by investors during the 10-year period from Dec. 31, 2009, to Dec. 31, 2019. With this estimation, investors, on average, paid 230 bps annually in management fees in the Indian Equity Large-Cap category over the 10-year period. In the ELSS and mid-/small-cap categories, investors paid higher expenses to the tune of approximately 250 bps per year over the same period.

Does Alpha Generation Outpace the Management Fees Charged in Indian Equity Large Cap Active Funds?

To analyze if the alpha[1] generation of fund returns over the benchmark was consistent over the years for the Indian Equity Large-Cap category, we dissect the asset- and equal-weighted gross and net fund returns into calendar year performance. Exhibit 3 shows the calendar-year gross alpha (evaluated both on equal- and asset-weighted returns) for the Indian Equity Large-Cap category versus the benchmark S&P BSE 100. We see that on an average gross-return basis, fund managers delivered positive alpha for the majority of the years, though not consistently throughout history, with the worst relative performance seen in 2012, 2013, and 2018 (see Exhibit 3). Also in an earlier blog, we had evaluated in which phases of the market cycles it is more probable for fund managers to generate alpha and under which conditions they typically underperform.

The annualized gross return alpha in the Indian Equity Large-Cap category was around 256 bps and 220 bps on an asset-weighted and equal-weighted basis, respectively (see Exhibit 3). However, these return alphas would be eroded by the annualized management fee of 230 bps (as estimated earlier in this blog), and an average large-cap fund investor would be left with a net return alpha of only 27 bps and -10bps per year on an asset-weighted and equal-weighted basis, respectively.

In conclusion, the alpha generation by fund managers in the Indian Large-Cap Equity category were largely eroded by the fees they charged, resulting in marginal or even negative average net excess return over the long-term investment horizon compared to the benchmark. Even on a gross-return basis, a significant proportion of funds underperformed the benchmark, posing challenges on fund selection and investment style changes. As an outcome, we have seen growing assets in passive investment products, which tend to be more style consistent and cost effective.

[1] Gross alpha = gross returns – benchmark returns; net alpha = net returns – benchmark returns; net returns = gross returns – management fees.

The posts on this blog are opinions, not advice. Please read our Disclaimers.

Market Dynamics Amid CARES Act Influx

How is COVID-19 relief impacting U.S. market segments? S&P DJI’s Gaurav Sinha takes a closer look at fixed income spreads, small- and mid-cap equities, and a potential role for the quality factor moving forward.


The posts on this blog are opinions, not advice. Please read our Disclaimers.

Q1 2020 Australia SPIVA® Results – Outperformance Still Prevalent Despite Market Volatility

Contributor Image
Stuart Magrath

Former Senior Director, Channel Management, Australia and New Zealand

S&P Dow Jones Indices

In early March 2020, S&P Dow Jones Indices released the SPIVA Australia Year-End 2019 Scorecard. With the market gyrations in late February and March due to the COVID-19 pandemic spreading across the globe, we decided to provide a “mid-term” SPIVA update to include data up to March 31, 2020, and to share the timely results through the webinar, Harnessing Active Vs. Passive Findings During Times of Market Turbulence. So, what did we find?

Q1 2020 Market Performance

With the exception of Australian bonds, all asset classes suffered drawdowns, with the S&P/ASX 200 seeing a drawdown of 23%. The S&P/ASX 200 A-REIT experienced a drawdown of 34.4%.

Q1 2020 Fund Performance

As Exhibit 2 shows, for the three-month period ending March 31, 2020, 61.2% of funds in the Australian Equity General category were outperformed by the S&P/ASX 200. This was more or less in line with the results as of Dec. 31, 2019. What becomes more interesting is when we look at the results on a month-by-month basis, we saw a steady improvement in the performance of funds in that category across the three-month period, with the number of funds outperformed by the benchmark decreasing from 78.4% to 50.8%. To put this another way, in January 2020, 21.6% of funds outperformed the benchmark, in February 2020, this increased to 41.5%, and in March 2020, it increased to 49.2%. The volatile market appears to have provided active fund managers opportunities to outperform the benchmark, although the benchmark still outperformed greater than 50% of funds.

Other fund categories were also not able to beat the benchmark in Q1 2020, with the exception of A-REITs. For the three-month period, 39.3% of A-REIT funds were outperformed by the benchmark.

While opportunities for outperformance by active fund managers may have increased in Q1 2020, most continued to underperform their relevant benchmarks. The challenge remains. How can investors, or financial advisors, select outperforming funds in advance? 2020 hindsight continues to prevail in 2020.

How Does SPIVA Assist Financial Advisors?

David Haintz of Global Adviser Alpha joined our mid-term SPIVA results webinar and provided a wealth of advice for financial advisors. David’s advice can be heard starting at minute 23:45. A couple of key takeaways from his advice include the following.

  • Rather than using the terms active and passive for investing, David suggests using the terms forecasting (active investing) and non-forecasting (passive investing). He is an advocate for non-forecasting, as when put to the test, the forecasters have not been able to demonstrate an ability to pick stocks, market timings, or active managers so that they consistently outperform relevant benchmarks. SPIVA has been a key tool in supporting a non-forecasting approach.
  • When adopting a non-forecasting approach to investing, David suggests advisors take a three-step approach.
    1. Understand: Gather data and understand whether options available to clients add value or subtract value. SPIVA is a great resource to aid in your understanding;
    2. Believe: Look at the available alternatives and start to believe in what will be the best possible option for your clients; and
    3. Articulate: Once an advisor understands and believes in a non-forecasting approach, the articulation of that proposition is easy, as there is so much evidence for non-forecasting that your passion for this approach will naturally flow as you talk to your clients.
  • Finally, when adopting a non-forecasting approach, be aware that this does not inoculate clients from negative markets. Keep your conversations with clients focused on their goals and aspirations, rather than on returns over 1, 3, or 12 months.


The posts on this blog are opinions, not advice. Please read our Disclaimers.

Move over Millennials: ESG Investing Is a Multigenerational Conversation

Contributor Image
Margaret Dorn

Senior Director, Head of ESG Indices, North America

S&P Dow Jones Indices

The COVID-19 pandemic has shaken financial markets and led many market participants to take a closer look at their investments. While emotionally and psychologically challenging, these selloffs can create opportunities to enhance long-term portfolio objectives. In this environment, advisors can demonstrate their value by helping clients invest in strategies they find meaningful and motivating.

Investors are reimagining the future state of investing in the aftermath of the pandemic, and record flows into environmental, social, and governance (ESG) ETFs undoubtedly reflect that mindset (see Exhibit 1). Assets in ESG ETFs and ETPs listed globally increased by 4.93% at the end of February 2020, to a new record of USD 67.99 billion.[1]

The recent surge of ESG ETF asset growth raises the question of who is investing in ESG-focused funds.

For years, ESG adoption has focused on millennials and their influence on sustainable investing. What has been consistently ignored, however, is that investors from all generations want to learn more about ESG investing and how best to put their values into action. Surprising to some, this includes the baby boomer generation. Let us not forget that many millennials inherited their core values from their baby boomer parents, whose activism and strong voices led to the establishment of the first sustainable funds in the 1970s. A recent report found that “baby boomers are more likely than millennials and Gen Xers to say that the reason they want to participate in ESG investing is to encourage companies to be good corporate citizens,”[2] which is an inspiring perspective, especially in the current environment.

It is increasingly evident that all generations wish to educate themselves on how to make ESG investment decisions and how to best align their investment objectives with their values. However, an additional objective shared by baby boomers, Gen Xers, and millennials alike is that aligning investments with their values not come at the cost of investment performance.

The S&P 500® ESG Index helps dispel the myth that a trade-off must exist between ESG principles and performance. Rather than detract from performance, ESG data can enhance visibility into financially material metrics that have not always been captured by traditional regulatory filings and standard financial analysis. In the past year, the S&P 500 ESG Index has provided a sustainable alternative to the iconic S&P 500, with similar risk and return, but with an additional lens into the constituents’ ESG principles (see Exhibit 2). While the recent outperformance is a welcomed result, it is important to note that the S&P 500 ESG Index does not aim to outperform its S&P 500 benchmark. It does, however, aim to achieve a considerable improvement in overall ESG performance by retaining companies with notable positive impacts such as an increase in female representation across management positions, a reduction in greenhouse gas emissions, and effective promotion of a risk culture.[3]

While indices like the S&P 500 ESG Index have continued to push the often marginalized conversation around sustainable investing into the mainstream, there remains boundless opportunity for financial professionals to educate all their clients on the reality of ESG investing. Advisors taking a proactive approach by initiating the ESG conversation are likely to be surprised by the openness of clients of all ages to engage around the topic in the current environment and beyond.

[1]   ETFGI reports ESG ETFs and ETPs listed globally gathered USD 7.54 billion in net inflows during Feb. 28, 2020. https://etfgi.com/news/press-releases/2020/03/etfgi-reports-environmental-social-and-governance-esg-etfs-and-etps

[2]   Allianz Global Investors, Socially Responsible Investing and ESG: It’s Not just a Millennial Trend. August 2019. https://www.allianzlife.com/about/newsroom/2019-press-releases/socially-responsible-investing-and-esg

[3]   For more information on the S&P 500 ESG Index, visit www.spdji.com.

The posts on this blog are opinions, not advice. Please read our Disclaimers.