Get Indexology® Blog updates via email.

In This List

Integrating Low-Carbon with Single Factors in Asia

Should Green Benchmarks Include Fossil Fuel Stocks?

The Performance of Carbon-Efficient Portfolios in Asian Markets

A Noble Metal Idea

SPIVA® U.S. Mid-Year 2019 Highlights

Integrating Low-Carbon with Single Factors in Asia

Contributor Image
Akash Jain

Director, Global Research & Design

S&P BSE Indices

Factor investing in Asia has grown at a rapid pace, with smart beta passive AUM growing at a 42% compound annual growth rate over the past five years, albeit from a relatively lower base.[1] With increasing awareness of climate change and related risks, investors may look to integrate carbon screening into their factor portfolios.

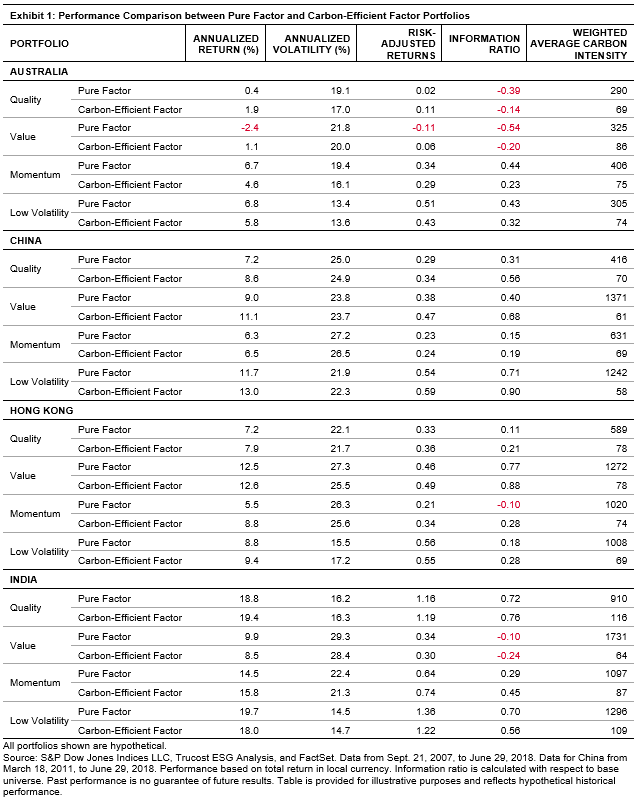
In our research paper, Integrating Low-Carbon and Factor Strategies in Asia, we constructed pure factor portfolios (momentum, value, quality, and low volatility) and studied the impact of carbon screening on these portfolios in seven Asian markets—Australia, China, Hong Kong, India, Japan, South Korea, and Taiwan. The pure factor portfolios were constructed by selecting the top quintile of stocks by factor scores from each market from their respective base universe. The carbon-efficient factor portfolios included the same number of stocks as in their respective pure factor portfolios, but were selected from the carbon-screened universe, from which the 33% of stocks with the highest carbon intensity scores were removed. The pure factor and carbon-efficient portfolios were unconstrained by sectors and were equally weighted. The carbon-efficient screening affected the performance and carbon intensity of each factor portfolio differently (see Exhibit 1).

Overall, the carbon screening resulted in higher carbon intensity reductions to the low volatility and value factors than to the quality and momentum factors across Asian markets. Carbon-efficient screening also improved risk-adjusted returns for the quality, value, and momentum portfolios. In contrast, low volatility factor performance was adversely affected by the carbon-efficient screening.

Additionally, carbon screening resulted in different sector exposures when compared with the pure factor portfolios. For example, compared with the pure quality portfolios, the carbon-screened quality portfolios tended to overweight Financials and Information Technology and underweight Materials and Consumer Staples (except in Australia). On the other hand, compared with the pure value portfolios, the carbon-screened value portfolios tended to overweight Financials and Consumer Discretionary and underweight Materials and Energy. For the momentum and low volatility factors, carbon-efficient factor portfolios tended to overweight Financials and Consumer Discretionary and underweight Materials with respect to pure factor portfolios.

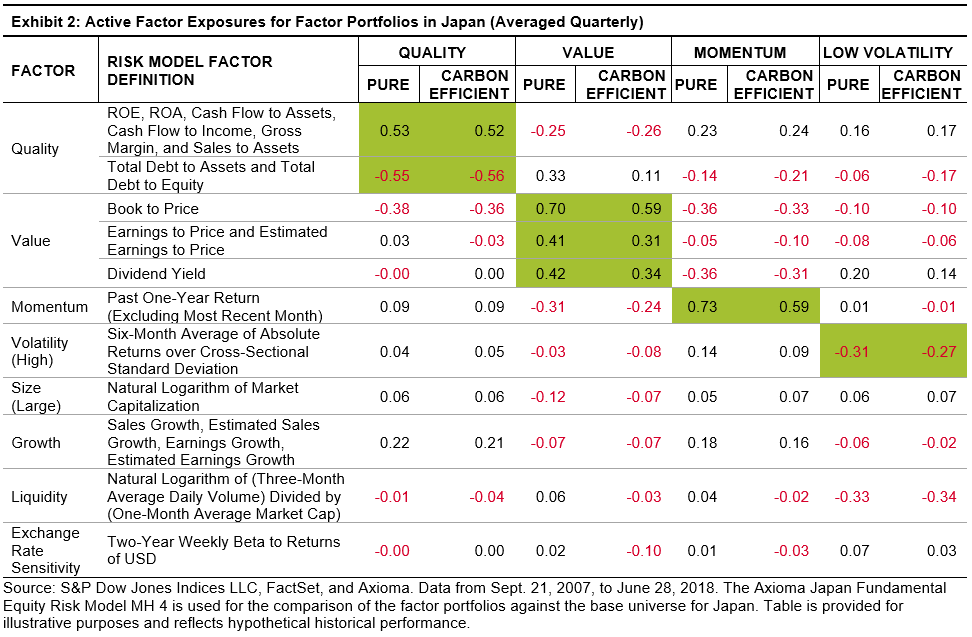
Exhibit 2 shows the active factor exposures (in terms of the number of standard deviations) of the carbon-efficient factor portfolios versus their respective pure factor portfolios in Japan. In most cases, the impact of carbon-efficient screening was modest on the targeted factor exposures. Similar observations were made in other Asian markets. We can conclude from these results that carbon-efficient screening did not result in the loss of targeted active factor exposure.

[1]   Banerjee, Alka, “ETFs and the Factor-Based Investing Landscape,” Forum Views: One World One BBF, Vol. 8, Issue 1, pp. 154-156, April 2019.

The posts on this blog are opinions, not advice. Please read our Disclaimers.

Should Green Benchmarks Include Fossil Fuel Stocks?

Contributor Image
Mona Naqvi

Global Head of ESG Capital Markets Strategy

S&P Global Sustainable1

As green investing becomes ever more mainstream, there is greater scrutiny of the myriad “environmentally friendly” investment products that have emerged. Several green-labeled benchmarks have been criticized for including oil and gas stocks, for instance, sparking some controversy within the sustainable investment community. However, while efforts to make financial products more transparent are laudable, not all arguments favoring divestment depict a complete and accurate picture. More often than not, divestment is more principled than practical when it comes to achieving the low-carbon transition.

As an independent index provider, S&P Dow Jones Indices has the responsibility of being transparent with its methodologies and marketing. Educating stakeholders, including investors, policymakers, and the media, is key to bridging expectations with the financial jargon that often plagues lengthy methodology documents. This is especially relevant in climate finance, for which the threat of “greenwashing” looms large. But divesting from fossil fuels is just one approach—and not all “green” products necessarily ought to do so. Indeed, the climate-conscious investor has two options.

  1. Divest: To align one’s investments with one’s values and send a reputation-hitting signal that potentially reduces a firm or industry’s license to operate.
  1. Engage: To retain a seat at the table to influence company behavior, drive industry change, or advance a particular cause.

The divestment movement does not argue that divesting will necessarily decrease a company’s value—it is primarily an expression of values for the principled investor. Engagement, on the other hand, is a tool for effecting a particular change. That said, more than 1,000 institutional investors with USD 11 trillion in assets are divesting from fossil fuels,[1] with some citing motives such as the avoidance of stranded-asset risk. Many banks and insurers have also committed to neither finance nor underwrite fossil fuel projects, inevitably slowing the industry’s expansion. However, divestment will not likely move a company’s stock price so long as there continue to be many investors who do not share the same moral virtues.[2] Ultimately, both approaches are valid, depending on the objectives of the individual investor.

This dichotomy is well understood in the active space, given shareholder advocacy, but there are parallels with passive investing too. If engagement is any strategy that influences company behavior, then benchmarks can also be an effective tool for engagement. Take the S&P Carbon Efficient Index Series, for instance (see Exhibit 1).

By excluding any of the world’s 100 biggest carbon emitters who don’t disclose, and retaining reweighted exposure to all other companies—including fossil fuel stocks—the S&P Carbon Efficient Index Series reduces the carbon footprint by as much as 20%-45%, while uniquely encouraging:

  1. Greater transparency, by rewarding companies that disclose emissions with a 10% higher index weight; and critically,
  1. The transition of business models toward low-carbon alternatives over the long term, as companies seek to improve their standing in the index.

Our novel methodology sorts companies into deciles by carbon intensity within GICS® industry groups and reweights them accordingly. However, since some industries are inherently more greenhouse gas-emitting than others, we consider the spread of industry group emissions and adjust weights by a greater or lesser extent, depending on how much a company can feasibly improve given available technologies (see Exhibit 2).[3] Companies are thereby incentivized to disclose and decarbonize to boost their overall standing. So although fossil fuel-free strategies tick certain boxes, they typically achieve less in terms of decarbonizing prowess.

Thus, so long as a methodology is transparent with its aims, it may make sense to include fossil fuel stocks in green indices. Naysayers may want to look closer at whether a strategy intends to divest or engage, because while both are green, only one is actually “greening.”

[1]   Source: https://www.ft.com/content/4dec2ce0-d0fc-11e9-99a4-b5ded7a7fe3f

[2]   See https://www.newyorker.com/business/currency/does-divestment-work for an explanation for why divestment requires a critical mass of adopters to have any real impact on stock prices.

[3]   Click here to learn more about the S&P Carbon Efficient Index Series and Industry Group Impact Factor Weights.

The posts on this blog are opinions, not advice. Please read our Disclaimers.

The Performance of Carbon-Efficient Portfolios in Asian Markets

Contributor Image
Akash Jain

Director, Global Research & Design

S&P BSE Indices

In recent years, governments have become increasingly aware of the perils of greenhouse gases and have aimed to penalize the source of pollution while looking to incentivize low-carbon technologies. In addition, investors are now considering an organization’s future financial position to discount potential write-downs of assets and the effect on revenues, costs, cash flows, and capital expenditure associated with adhering to policy changes that factor in climate risks. The global market for environmental, social, and governance (ESG) exchange-traded funds (ETFs) alone is expected to expand from USD 25 billion to more than USD 400 billion within a decade.[1] In Japan, sustainable investments grew fourfold between 2016 and 2018.[2]

In our recently published research paper, Integrating Low Carbon and Factor Strategies in Asia, we studied the performance of carbon-efficient and carbon-inefficient portfolios with sector-neutral and unconstrained approaches in seven Asian markets—Australia, China, Hong Kong, India, Japan, South Korea, and Taiwan. In each market, we ranked all companies in the base universe by their carbon intensity scores. The tertile (one-third) of the base universe with the lowest and highest carbon intensity scores constituted the unconstrained carbon-efficient and carbon-inefficient portfolios, respectively. Similarly, in the sector-neutral approach, carbon-efficient and carbon-inefficient portfolios were composed of the tertile of stocks with the lowest and highest carbon intensity scores from each sector, respectively.[3] We analyzed the performance of equal-weighted (see Exhibit 1) and float-market-cap-weighted baskets (see Appendix E of the research paper).

In the paper, we concluded that carbon-efficient portfolios resulted in a significant reduction to weighted average carbon intensity scores without sacrificing returns across Asian markets over long time horizons. We also observed that the carbon-efficient portfolios outperformed their respective carbon-inefficient portfolios across the seven markets on absolute and risk-adjusted bases over the entire studied period (see Exhibit 1).

In the unconstrained approach, the carbon-efficient portfolios had much lower weighted average carbon intensity scores than their respective carbon-inefficient portfolios, with carbon intensity reductions between 95.6% and 99.5% across all markets. The highest return spreads and volatility reductions were seen in China, Australia, and Hong Kong.

With sector constraints in place, the weighted average carbon intensity score reductions between the carbon-efficient and carbon-inefficient portfolios ranged from 84.3% to 95.8% across markets. China, Japan, and Hong Kong recorded the highest excess return spreads and reductions in volatility.

Furthermore, compared with the base universe, the carbon-efficient portfolios tended to deliver positive information ratios, while the carbon-inefficient portfolios had negative information ratios in most markets in the unconstrained and sector-neutral approaches.

As expected, the differences in carbon intensity scores, the return spread, and volatility reduction between the carbon efficient and carbon-inefficient portfolios were much more pronounced in the unconstrained approach. The tracking error of unconstrained carbon-efficient portfolios was relatively higher (4.6%-8.0%). However, in the sector-neutral approach, the tracking error of the carbon-efficient portfolios tended to be much lower (3.0%-5.9%).

[1]   Thuard, Johan, Harvey Koh, Anand Agarwal, and Riya Garg, “Financing the Future of Asia: Innovations in Sustainable Finance,” April 2019.

[2]   Kodaira, Ryushiro and Matsumoto, Hiroko, “After fending off eco-warriors, Asia Inc find ‘ESG’ investors hard to ignore,” Nikkei Asian Review, June 12, 2019.

[3]  For a detailed methodology of the research, please refer to Integrating Low Carbon & Factor Strategies in Asia.


The posts on this blog are opinions, not advice. Please read our Disclaimers.

A Noble Metal Idea

Contributor Image
Jim Wiederhold

Former Director, Commodities and Real Assets

S&P Dow Jones Indices

S&P Dow Jones Indices, the world’s leading index provider, launched the S&P GSCI Gold Dynamic Roll 70/30 Futures/Equity Blend in November 2019. It is the first single-commodity-focused futures/equities blended index of its kind in the gold market. In the current environment where investors are looking to diversify, this product is designed to provide a reliable and publicly available benchmark for the gold industry. It offers a new and unique way to track what is currently a popular commodity investment theme. This index is designed to measure the performance of a gold-focused, multi-asset allocation with exposure to both futures and equities returns. Commodities and equities tend to perform well at different points in the business cycle; for example, commodities tend to perform well during late phases of the business cycle, a time when equity returns tend to disappoint.

Over the past 10 years, gold-producing equities underperformed gold futures by a significant margin. However, 2019 has been different; the S&P Commodity Producers Gold Index outperformed the futures-based S&P GSCI Gold Dynamic Roll YTD as of October 2019. By combining gold futures with gold equities, market participants can partake in potential gold upside regardless of the instrument (asset class) the market uses to get there. Gold equities offer investors an underlying beta to the broad equities market as well as specific gold-related returns. Gold equities could also benefit from corporate actions such as M&A activity, specific company developments, and dividends. With managed money net positioning in CME gold futures at 10-year seasonal highs, there may be potential for a catch-up trade in gold equities. While gold equities could offer additional return streams over and above the underlying change in gold prices, they could also add new risks to a portfolio ranging from individual company hedging activities to mine disruptions.

Allocating to gold equities and gold futures via the S&P GSCI Gold Dynamic Roll 70/30 Futures/Equity Blend could offer a less volatile way for investors to allocate risk to the gold market.

The posts on this blog are opinions, not advice. Please read our Disclaimers.

SPIVA® U.S. Mid-Year 2019 Highlights

Contributor Image
Berlinda Liu

Former Director, Multi-Asset Indices

S&P Dow Jones Indices

The SPIVA U.S. Mid-Year 2019 Scorecard was published recently. The report shows that the strong rally in the domestic equities market in the first half of 2019 did not necessarily translate into success for active managers.

Active managers’ performance relative to the benchmark indices showed significant discrepancies in different market segments. For the one-year period ending in June 2019, 71% of domestic equity funds underperformed the S&P Composite 1500®, slightly more than the SPIVA U.S. Year-End 2018 report’s 69%. The majority of large-cap funds lagged their benchmarks, while mid-cap and small-cap active funds performed relatively better.

The outsized success of the mid- and small-cap funds may be explained by the performance divergence of the benchmarks. For the 12-month period ending in June 2019, the S&P 500® was up 10.4% and the S&P MidCap 400® gained a modest 1.4%, while the S&P SmallCap 600® fell 4.9%. Active managers in the two smaller-cap categories may have sized up into larger-cap securities in order to boost returns.

Performance discrepancy was even more prominent for growth managers. While most domestic large-cap growth managers were unable to keep up with the performance of the S&P 500 Growth (up 12%), more than 80% of mid- and small-cap growth managers beat their benchmarks for the one-year period ending in June 2019. Exhibit 2 shows that these two categories underperformed relative to large-cap growth.

The majority of fixed income active funds underperformed their benchmarks over the studied period, with the exception of global income funds. Of particular note, all government long funds and loan participation funds underperformed their respective benchmarks over the one-year horizon. This was in stark contrast to results from the SPIVA U.S. Year-End 2018 scorecard , when just 17% of government long funds and 57% of loan participation funds underperformed.

The posts on this blog are opinions, not advice. Please read our Disclaimers.