


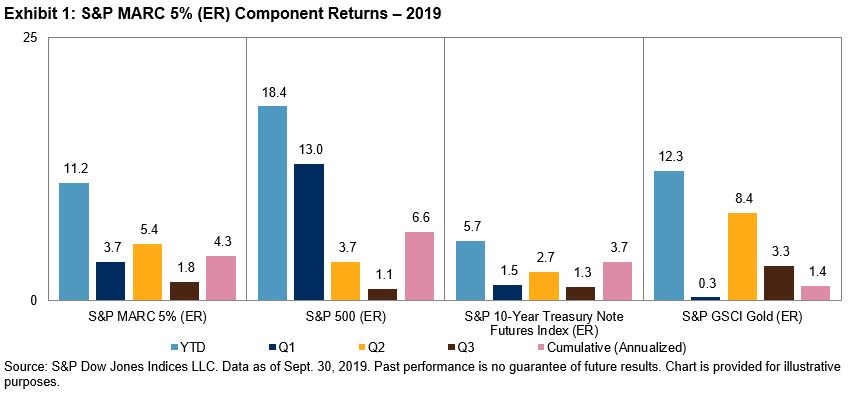
Despite still ending the quarter higher, Q3 2019 was relatively subdued across asset classes when compared to the stellar performance we saw in equities in Q1 and Treasuries and gold in Q2. Exhibit 1 shows that the gains captured in Q1 and Q2 continued to compound in Q3, with the YTD performance of the S&P MARC 5% (ER) reaching 11.2%. As of Q3’s end, all components of the S&P MARC 5% ended in positive territory for each of the three quarters of 2019.
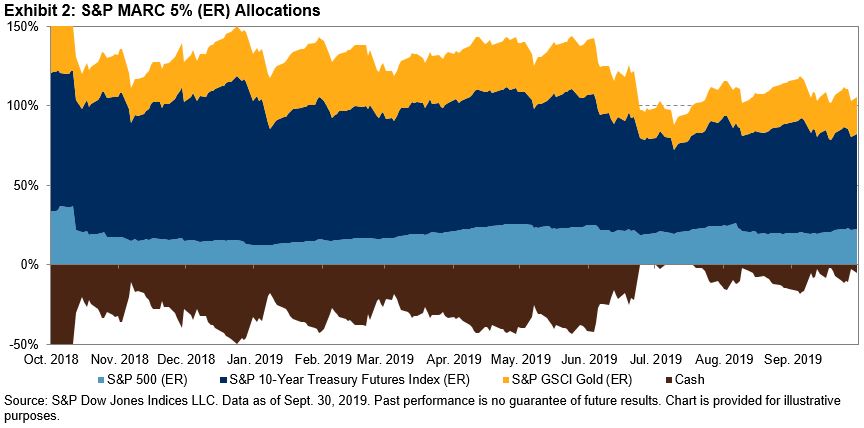
Looking at the index allocations from the beginning of Q3 2018 to the end of Q3 2019 (see Exhibit 2) we see that, while the mix of assets has changed significantly throughout this time, with equities taking a less prominent role due to the volatility seen at year-end 2018, the index continued to be over 100% allocated across the various asset classes at least 95% of the time. Despite Q4 2018’s volatility, the index only dropped below 100% on 15 days over the past year, keeping the strategy allocated to its underlying asset classes and not cash.
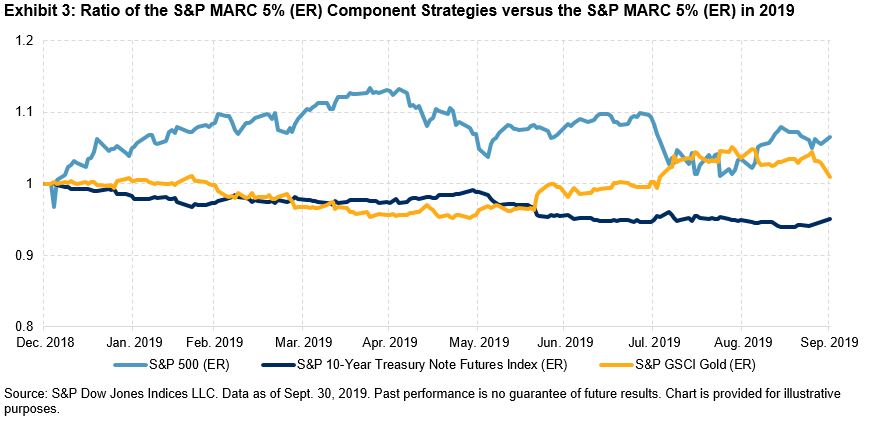
When looking at the relative performance of the S&P MARC 5% (ER) components versus the S&P MARC 5% (ER) itself, one can see that for the first half of the year, the gold and fixed income components actually lagged in performance. This changed toward the end of Q2 through mid-Q3, when gold also joined equities in outperforming the S&P MARC 5% (ER) on a relative return basis. The strength of the components allowed the S&P MARC 5% to start Q4 with a strong YTD performance, while still capturing the diversification built into the index.
During the 64 days in Q3 2019, we can see that for any of the rolling 252-day periods, the return of the S&P MARC 5% (ER) would have been positive despite the inconsistency of returns in most of its components. It’s also worth noting that across this period of time, the lowest rolling 252-day return for the S&P MARC 5% (ER) was 8.6% and the highest return was 13.4%—with an average return of 11.4%.


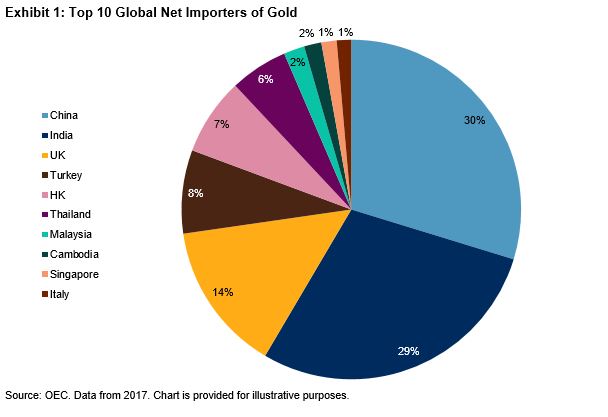
 The consumption of gold during the Diwali festival and peak wedding season running from August to December is unlike anywhere else in the world. This year, Diwali demand will compete directly with a favorable cyclical environment for gold investment. Gold has been one of the best-performing commodities this year. As of Sept. 30, 2019, the

