The S&P/TSX 60 gained 15.5% YTD[i] and many companies included in the index have benefitted from business prospects in the U.S. While nearly all stocks in the index are domiciled in Canada, 49%[ii] of combined revenues come from within Canada’s borders, while another 30% are sourced in the U.S. As shown in Exhibit 1, stocks with significant U.S. exposure have outperformed, contributing to gains of the S&P/TSX 60.

The S&P/TSX 60 U.S. Revenue Exposure Index, which is designed to measure companies from the S&P/TSX 60 with higher than average exposure to the U.S., outperformed the benchmark by 5.8 percentage points YTD. Meanwhile, the S&P/TSX 60 Canada Revenue Exposure Index, which is designed to measure companies from the S&P/TSX 60 with higher than average exposure to Canada, underperformed by 1.5 percentage points as of May 27, 2019.
Sector weight variations of each index, as shown in Exhibit 2, help explain the recent performance differences. Canadian Financials and Communication Services companies tend to gain a larger proportion of revenues from domestic sources. Energy and Information Technology companies, meanwhile, gain greater revenues outside of Canada.

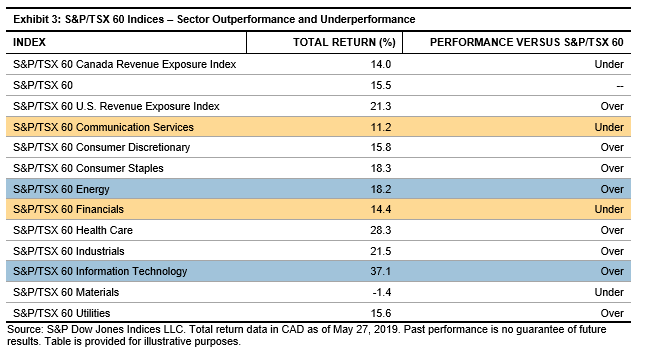
Greater domestic focus of Communication Services and Financials sectors—shown in Exhibit 3—have been a hindrance to the S&P/TSX 60 Canada Revenue Exposure Index in 2019. Meanwhile, the outperformance of Energy and Information Technology companies have led to the improved returns of the S&P/TSX 60 U.S. Revenue Exposure Index.
While the S&P/TSX 60 comprises top companies in leading Canadian industries, over half of combined revenues are sourced from outside the country. Those companies earning significant revenues outside of Canada have boosted the YTD gains of the flagship index.
[i] Source: S&P Dow Jones Indices LLC, total return data in CAD as of May 27, 2019.
[ii] Source: Revenue exposure data from Factset, LLC, data as of May 27, 2019.
The posts on this blog are opinions, not advice. Please read our Disclaimers.