Get Indexology® Blog updates via email.

In This List

Factor Use is Growing Among Financial Advisors and Institutional Investors

2018 Mid-Year SPIVA® Canada Scorecard – Challenging Times for Active Equity Managers

The Case for Emerging Market Stocks

The IMF Comment May Push South Africans to Sovereigns

Shelter from the Storm

Factor Use is Growing Among Financial Advisors and Institutional Investors

Contributor Image
Vincent de Martel

Solutions Strategist

Invesco

Factor investing is growing rapidly — not only are more investors adopting factor strategies, but as investors gain experience, they increase their use of them. This is one of the key findings from our recent Global Factor Investing Study, which is based on face-to-face interviews and discussions with more than 300 institutional and wholesale factor investors around the world — including financial advisors, pension funds, private banks and insurance companies.

Investors are adopting more factor strategies, but still in small doses
Factors are measurable characteristics of a security that help explain its performance. Our study found that while an asset owner often commences their factor journey with a single strategy, it is uncommon for them to stop there. The institutional and wholesale investors surveyed in the study have gone on to implement from two to four factor strategies on average.

However, factor allocations generally represent a small proportion of the asset classes they are being applied to. In the vast majority of cases (looking at equities and fixed income), allocations to factor strategies remain in the 0% to 20% range. This means that even for factor adopters, most still have over 80% of their equity and fixed income allocations in traditional active and/or market-cap-weighted passive strategies.

For those institutional investors who described themselves as “sophisticated” factor users, this segment reported nearly double the average allocation to factor strategies than the less sophisticated segment, at nearly 20%. This trend also applies to wholesale investors, where the more sophisticated users reported average factor allocations of 15%.

Which factor is the most used?
Our study found that Value continues to be the most commonly utilized style factor in portfolios and is particularly ubiquitous in institutional portfolios — which is notable given the extended underperformance of equity value strategies in recent years. Other key style factors include Low Volatility, Momentum, Size and Quality.

Respondents noted that they tend to start their factor journey with equities, and look to extend into fixed income and multi-asset applications.

Single or multi-factor?
When it comes to applying a single or multi-factor approach, our study found that equity single factors are the most common approach, closely followed by equity multi-factor. Some distance behind are multi-asset approaches, followed by single- and multi-factor fixed income.

The reasons behind these choices are relatively clear and rational.

  • For institutions, single factor approaches are driven by the desire to reduce or minimize complexity and to keep costs low. This is particularly relevant for newer factor investors and smaller institutions with limited internal resources.
  • Institutions favoring multi-factor approaches have different motivations — control of risk, factor tilting and enhancement of performance were cited by respondents as much more important than costs. Multi-factor strategies tend to be deployed by larger investors that have significant scale and lower cost ratios.
  • For wholesale investors, the drivers are very similar, with lower costs cited as an even stronger driver for single factor usage.

Learn more about how institutions and wholesale investors are using factor strategies.

The posts on this blog are opinions, not advice. Please read our Disclaimers.

2018 Mid-Year SPIVA® Canada Scorecard – Challenging Times for Active Equity Managers

Contributor Image
Hamish Preston

Head of U.S. Equities

S&P Dow Jones Indices

The latest Canada SPIVA® scorecard landed recently.  While data up to the end of June 2018 was consistent with results from previous SPIVA Canada scorecards – active management once again found it challenging to beat the passive benchmarks – there were pockets of success.  Here are a few highlights.

Active managers found it difficult to beat the Canadian equity benchmark.

Although trade tensions and concerns over global economic growth threatened the upward trajectory of the Canadian equity benchmark S&P/TSX Composite earlier this year, an accompanied rise in dispersion did not lead to an improvement in relative performance by active Canadian equity funds.  A chunky 93.22% of Canadian equity funds underperformed the S&P/TSX Composite’s 10.41% rise in the 12-month period ending in June 2018.  As exhibit 1 makes clear, such underperformance was unrivalled across other regions globally.

Exhibit 1: Percentage of Funds that underperformed their respective benchmarks.

Source: S&P Dow Jones Indices.  Data as of June 30, 2018.  Chart shown for illustrative purposes only.  Past performance is no guarantee of future results.

Canadian managers did not fare well in international equities either.

In further signs that active managers may have found it difficult to navigate the impacts of trade tensions and concerns over a global economic slowdown, International Equity funds recorded a notable increase in underperformance over the last 12- months.  Nearly 90% of category’s funds lagged the S&P EPAC LargeMidCap (versus 73.08% reported in our year-end Canada SPIVA scorecard).  Underperformance also rose among funds investing in U.S. equities: only 27.59% of managers beat the S&P 500 (CAD) over a one-year horizon, compared to 30.59% from our year-end 2017 scorecard.

Dividend-focused active equity funds yielded better results.

Although the majority of funds in six of our seven categories lagged their respective benchmarks since the end of June 2017, Canadian Dividend & Income Equity Funds offered the exception.  Perhaps helped by avoiding sizeable negative contributions from a handful of S&P/TSX Canadian Dividend Aristocrats® constituents, an impressive 67.57% of active funds beat the benchmark.  But we will have to wait and see if this pattern continues: 100% of the category’s funds lagged the benchmark over a ten-year horizon, demonstrating that performance can vary from year-to-year.

Exhibit 2: The majority of fund categories lagged their respective benchmarks

As a result, while some market participants may hope that the future holds better prospects for active management, our SPIVA scorecards continue to show how difficult it can be to (persistently) beat passive benchmarks.

The posts on this blog are opinions, not advice. Please read our Disclaimers.

The Case for Emerging Market Stocks

Contributor Image
Philip Murphy

Former Managing Director, Global Head of Index Governance

S&P Dow Jones Indices

Despite looming threats to global trade, emerging market stocks are a staple of diversified equity portfolios. Emerging countries are a diverse group, accounting for about 28.8% of real world GDP (measured in 2005 U.S. dollars) as of Nov. 12, 2018, according to FactSet. The comparable figure for U.S. production is 25.4%. Year-over-year growth in real GDP was 5.1% for emerging countries and 3.0% for the U.S. Extrapolating these figures 20 years into the future would increase the share of global GDP from emerging countries to about 42%, while the U.S. would remain at approximately 25%.

In spite of their economic footprint, emerging countries’ stocks account for about 10% of global market capitalization, while U.S. stocks account for about 54%. That said, U.S. market value is fully represented in benchmarks, while that of emerging countries is not. Inclusion of emerging market equities is constrained by foreign ownership limits and a lack of complete access. China is the most significant case, but index providers are generally moving toward inclusion of locally listed Chinese shares over time as foreign access opens up. As a result, available emerging market capitalization is set to increase, enhancing diversification and expanding the global investment opportunity set. U.S. investors who ignore this trend will implicitly accept greater drift from the global investment opportunity set over time.

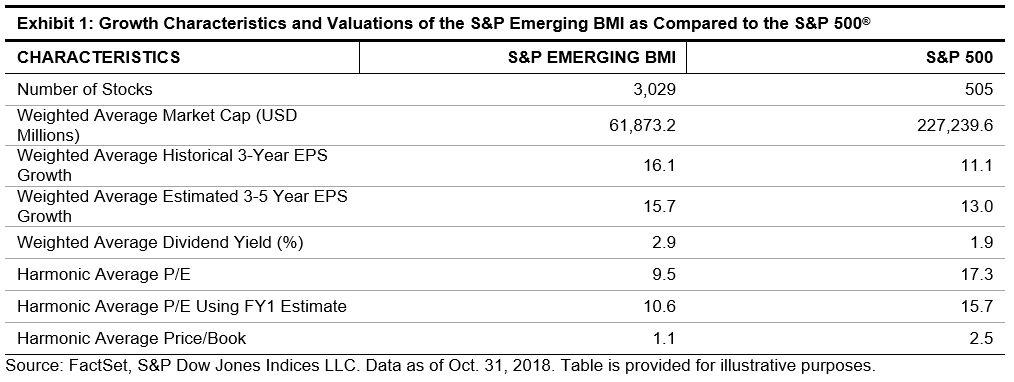
In addition to being a growing proportion of the investment opportunity set, emerging equities may offer compelling growth and value. As shown in Exhibit 1, relative to U.S. stocks, emerging market stocks offer higher earnings growth and dividend yield, coupled with lower valuation ratios.

For USD investors, value may also be present in emerging market currencies. In the long run, the growing economic significance of emerging market countries is consistent with potential currency appreciation. Yet currency market participants react to short-term risks just as they do in other markets. Recent currency weakness detracted from the returns of the S&P Emerging BMI (USD) versus the same index hedged to USD (see Exhibit 2).

To be sure, uncertainties abound in emerging market equities, including political risk, market risk, and currency risk. However, bearing such hazards may be the cost of earning a long-term return premium. Taking account of the expanding global investment opportunity set and relative attractiveness of emerging markets, in terms of growth potential and valuation, suggests that U.S. market participants who seek exposure to the equity risk premium could be disadvantaged if they under-allocate to emerging market stocks.

The posts on this blog are opinions, not advice. Please read our Disclaimers.

The IMF Comment May Push South Africans to Sovereigns

Contributor Image
Kevin Horan

Former Director, Fixed Income Indices

S&P Dow Jones Indices

The South African economy, Africa’s second-largest economy after Nigeria, may be helped by reforms put in place by President Cyril Ramaphosa. Earlier this year, South Africa suffered a setback, as data showed the economy dipping into a recession, but Ramophosa has since unveiled a stimulus and recovery plan to try and get it back on track. The stimulus package encouraged investors by giving more certainty on mining and visa rules and by emphasizing skill development and education.

As the debate continues, the IMF has publicly stated, “Some of the initial optimism has dissipated as growth remains stuck in low gear and reform implementation has faced constraints.”[1]

Concerns over the economy tend to push local investors to the most secure investments and entice international investors to attractive yields. The performance of the South African sovereign market can be quickly reviewed with the S&P South Africa Sovereign Bond 1+ Year Index, which seeks to track the performance of local currency-denominated sovereign debt publicly issued by the government of South Africa in its domestic market, with maturities of one year or more.

Year-to-date, the index returned 5.55% as of Nov. 16, 2018. As mentioned above, the index history shows that, as the South African economy suffered a setback, risk-off trading led to an increased demand for sovereign bonds, and the yield to worst of the index reached a low of 8.29% on March 27, 2018. Since March, yields have increased and are currently ranging between 9.4% and 9.8% (see Exhibit 1).

Looking at the structure of the index, the universe of bonds currently includes 14 securities, with a market value of ZAR 1.4 trillion. The duration of the index is 7.2 years, with 9 of the 14 securities having a duration greater than the aggregate level.

The 2-year sovereign South African bond (7.25% on Jan. 15, 2020) began the year with a weight of 4.4% in the index but currently only holds 2%, as longer issues have increased in weight. As seen in Exhibit 2, the yield of the 2-year sovereign bond has tightened, while the 5-, 10-, and 30-year sovereign bonds have moved laterally. Since the beginning of September 2018, the 2-year sovereign bond bid yield has gone from a YTD high of 7.88% to 6.35%.


Some investors are skittish, as Africa’s most industrialized economy struggles with rising debt, though the government is working hard to improve the investment climate for both domestic and international investors, according to the minister of trade and industry.

For more information on the S&P South Africa Sovereign Bond Index and the S&P South Africa Inflation-Linked Bond Index, please go to www.spdji.com or follow these links.

S&P South Africa Sovereign Bond Index

S&P South Africa Sovereign Bond 1+ Year Index

S&P South Africa Sovereign Inflation-Linked Bond Index

S&P South Africa Sovereign Inflation-Linked Bond 1+ Year Index

[1] Toyana, Mfuneko. “IMF says optimism in South Africa’s economic recovery fading.” Reuters. Nov. 19, 2018.

The posts on this blog are opinions, not advice. Please read our Disclaimers.

Shelter from the Storm

Contributor Image
Anu Ganti

U.S. Head of Index Investment Strategy

S&P Dow Jones Indices

As we approach the final month of a rollercoaster year in the markets, adding a factor lens can provide perspective, especially when it comes to low volatility.

The goal of low volatility strategies is to provide investors with protection in falling markets and participation in rising markets. The need for protection has become more relevant as a result of recent market declines in the U.S. and prolonged weakness overseas.

Through September, low volatility in the U.S. was the ugly duckling of factor strategies, underperforming the S&P 500® and lagging far behind the then-ascendant growth and momentum strategies. However, the tide turned in October, which was a rough month (to say the least) for U.S. equities. As seen in Exhibit 1, the S&P 500 lost 7%, while the S&P 500 Low Volatility Index outperformed by 4%, providing a much needed protective cushion. Exhibit 2 shows that the most important component of low volatility’s success was the strong relative performance of Utilities, where low volatility has a substantial overweight.

Low volatility’s success was not unique to the U.S. Exhibits 3 and 4 show that similar trends occurred globally, particularly in the emerging markets and Asia, regions that have experienced turmoil for most of this year. The S&P Pan Asia Low Volatility Index and S&P BMI Emerging Markets Low Volatility Index outperformed their benchmarks by 12% and 11%, respectively, for the one-year period ending October 2018.

Low volatility strategies have been successful across regions and time horizons in providing protection during market declines.

The posts on this blog are opinions, not advice. Please read our Disclaimers.