Get Indexology® Blog updates via email.

In This List

A Primer on Country Classification in the Context of Saudi Arabia’s Upgrade to Emerging Market Status

Return Efficacy of Profitability Metrics in International Small-Cap Equity

Indexing With Large Caps at the Core

Exploring Commodity Equity and Futures

The S&P 500 Equal Weight Index: A Supplementary Benchmark for Large-Cap Managers’ Performance Evaluation? – Part II

A Primer on Country Classification in the Context of Saudi Arabia’s Upgrade to Emerging Market Status

Contributor Image
Michael Orzano

Head of Global Exchanges Product Management

S&P Dow Jones Indices

Given our recent announcement upgrading Saudi Arabia to emerging market status, it seemed like an apt time to delve a little deeper into the index country classification process and the criteria used to evaluate the status of markets here at S&P Dow Jones Indices (S&P DJI). At the risk of stating the obvious, country classification is perhaps the most fundamental aspect of global benchmark construction, given that country (and related currency) exposures have historically been the most important drivers of risk and return in global equity portfolios. In other words, the countries that are included in your benchmark matter a lot, so it’s critical to understand how country classification decisions are made, as well as any differences that exist between indices published by different providers.

An Overview of S&P DJI’s Country Classification Process and Evaluation Criteria
On an annual basis, S&P DJI conducts a complete review of all countries included in its global equity benchmarks. As described in detail in our country classification methodology, we initially review a series of criteria for each market that covers such areas as macroeconomic conditions, political stability, market size and liquidity, trading and settlement procedures, and the presence of foreign ownership restrictions. Countries must meet certain minimum criteria to be eligible for frontier market status, must pass higher standards for emerging market status, and must pass the most stringent criteria to be considered for developed market status.

In cases where this review indicates a possible change in classification, S&P DJI conducts an in-depth, public consultation requesting feedback from a wide range of market participants. This consultation process is an integral component of the overall country classification decision since core issues under review, such as market accessibility and the efficiency of transacting in local markets, are highly nuanced and may even vary among different types of market participants. S&P DJI typically publishes this annual consultation during the second quarter and it remains open for comment for about three months, with the results announced in the fourth quarter. In order to provide market participants with sufficient time to prepare for country changes, implementation of any changes typically happens at the following year’s September rebalancing.

In addition to the annual consultation, we sometimes conduct “off-cycle” reviews when warranted by changes in market conditions. Our consultation on Saudi Arabia is a recent example of this; the S&P DJI global equity index committee determined that market reforms implemented following our 2017 consultation period warranted a more timely review of the market.

Changes in classification are infrequent, given the index turnover and the associated trading costs borne by asset managers stemming from these large changes. Because of this, country changes are only made when there is a strong consensus among market participants for the change and the conditions supporting the change are seen as extremely unlikely to reverse.

Key Classification Differences
While classification of countries is largely consistent across the largest index providers (e.g., S&P DJI, MSCI, and FTSE Russell each have announced upgrades of Saudi Arabia this year), there are some notable differences to be aware of. Probably the most meaningful involves South Korea, which S&P DJI has classified as a developed market since 2001, but MSCI continues to classify as an emerging market. This difference is important, given that South Korea is the second-largest country in the MSCI Emerging Markets Index at a roughly 15% weight, potentially crowding out less-developed markets from the benchmark.

Another notable distinction to be aware of is that MSCI initiated a partial inclusion of China A-shares in its benchmarks as of June 1, 2018, whereas S&P DJI and FTSE Russell currently have China A-shares under review for inclusion in emerging market indices. Although MSCI’s inclusion of China A-shares has garnered significant attention, it should be noted that the partial inclusion process undertaken by MSCI means that China A-shares currently represent less than 1% of the emerging markets index.

Finally, our 2018 Country Classification Consultation is open for comment until Oct. 15, 2018. In addition to China A-shares, Argentina and Kuwait are under review for reclassification from frontier to emerging market status.

The posts on this blog are opinions, not advice. Please read our Disclaimers.

Return Efficacy of Profitability Metrics in International Small-Cap Equity

Contributor Image
Rachel Du

Senior Analyst, Global Research & Design

S&P Dow Jones Indices

Despite both indices representing the U.S. small-cap market, the S&P SmallCap 600® has outperformed the Russell 2000 Index in 16 out of 24 calendar years, with an annualized excess return of 1.81%.[1] Prior research by S&P Dow Jones Indices[2] found that inherent differences in index construction drove the historical return differential. Notably, the profitability inclusion requirement for the S&P SmallCap 600 explains a substantial amount of the difference. Based on the conclusions found in the paper, we investigated whether similar findings exist in the international small-cap space.

In our study, we explored six widely accepted indicators of profitability by comparing the future returns of positive (or higher) profitable companies to negative (or lower) profitable companies: earnings per share (EPS),[3] asset turnover, gross profit margin, gross profitability, return on assets (ROA), and return on equity (ROE).[4]

In order to determine if differences in geographic regions or economic status lead to return differences, we tested four different regions including Global, Global Ex-U.S., Developed Ex-U.S., and Emerging Markets.

On a monthly basis, we ranked companies in each universe and grouped them into quintiles, with the most profitable (highest) companies placed into the Quintile 1 and least profitable (lowest) companies placed into Quintile 5. For EPS, we placed companies in only two groups, with Group 1 representing profitable companies and Group 2 representing negative earnings companies. We equally weighted each group to avoid size bias, with returns calculated in local currency to avoid any currency effects. Exhibit 1 shows the average of the forward one-month returns for each group within each metric, beginning in 1999.

Exhibit 1 shows that the higher-ranked groups generally delivered higher future returns relative to the lower-ranked groups across all four universes and all six metrics. In addition, the return differential between Quintile 1 and Quintile 5 (or Group 1 minus Group 2 for EPS) is shown at the bottom of each universe. Based on the results, we concluded that, irrespective of the metric used to measure profitability, more profitable companies on average outperformed less profitable ones.

To determine if the excess returns between the Quintile 1 and Quintile 5 were statistically significant, and if there was any time variation (especially over longer periods), Exhibit 2 shows the information coefficient (IC) and t-statistic for 1-, 3-, 6-, and 12-month periods for the Global Ex-U.S. universe.

The positive ICs indicated the potential predictive power of profitability metrics on subsequent excess returns. Additionally, the t-statistics showed statistical significance for the majority of the figures. The results give credence to the notion that having a profitability requirement—even something as simple as screening out unprofitable companies using EPS—could potentially have a positive effect on returns for an international small-cap benchmark.

[1]   Source: S&P Dow Jones Indices LLC, FactSet. Total returns from December 1993 to March 2018.

[2]   Brzenk, P. and Aye Soe.  “A Tale of Two Benchmarks: Five Years Later.” S&P DJI Research, March 2015.

[3]   For real estate investment trusts (REITs), funds from operations were used in place of net income when available.

[4]   Ratio Definitions: EPS is the last fiscal year net income divided by shares outstanding; asset turnover is net sales divided by the average of total assets; gross profit margin is gross income divided by net sales; gross profitability is gross income divided by total assets; ROA is gross income divided by the last two fiscal periods’ average of total assets; and ROE is the trailing 12-month EPS divided by book value per share.


The posts on this blog are opinions, not advice. Please read our Disclaimers.

Indexing With Large Caps at the Core

Contributor Image
Koel Ghosh

Former Head of South Asia

S&P Dow Jones Indices

The end of May 2018 marked another milestone in the history of ETF growth in global markets, with the total assets in ETFs crossing USD 5 trillion. Indian ETF markets are also growing significantly. The support from the Indian government via the Employees’ Provident Fund Organisation and Department of Investment and Public Asset Management, which are promoting investment in ETFs, has helped with the acceptance and adoption of passive investing.

However, with every investment decision comes planning and strategy. Asset allocation is important for a sound portfolio strategy. A core satellite approach has been adopted by many to achieve the necessary portfolio targets. In Indian markets, as active is a well-established strategy and passive is slowly getting a foothold, a combination of the two via core satellite can allow both strategies to be at play.

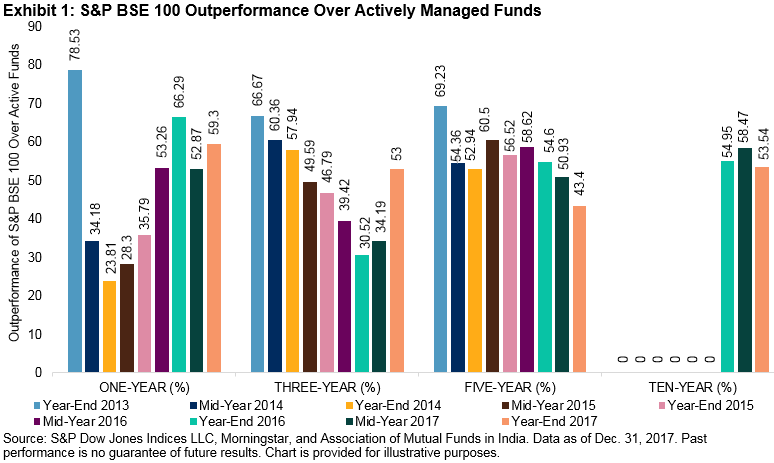
The large-cap space has long been established to contain companies with large market capitalization and stronger financials, which are understood to be stable and sometimes referred to as blue chip. The benchmark S&P BSE SENSEX consists of large-cap companies and many passive strategies and investment are linked to it today. The Indian market also hosts a wide range of active funds in this space. However, the SPIVA® India Scorecard has highlighted how the benchmark, in this case the S&P BSE 100, has outperformed active funds. It does make one wonder if, rather than going through the effort and spending time sorting through and picking an active strategy, isn’t it may be easier to replicate an index or follow an index fund or ETF?

Exhibit 1 is an example of the outperformance of the S&P BSE 100 over active funds in the past few years. The trend could compel one to think that it may be easier to take a low-cost, diversified, transparent, and flexible option.

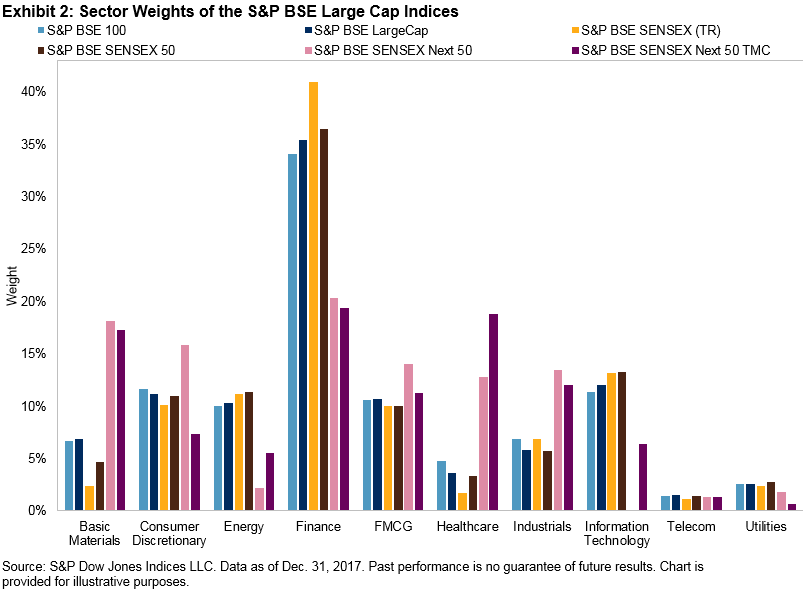
An advantage of index-based investing is low concentration risk. For example, the S&P BSE 100 spreads across a broad basket of 100 securities diversified across sectors. For a more concentrated basket, the S&P BSE SENSEX 50 seeks to measure a group of 50 stocks, while the S&P BSE SENSEX seeks to track a set of 30 stocks. The S&P BSE SENSEX Next 50 is designed to measure the next 50 stocks from the same large-cap space beyond just the top 50 large caps.

Diversification can help with efficient risk management, as the exposure is not concentrated. An index measures a basket of securities, rather than a single stock, with an additional benefit of a wide sectoral exposure. Each of the S&P BSE LargeCap Indices provides exposure across 10 sectors, as per BSE sectoral classification, with various weights. Exhibit 2 demonstrates the sector weights of the S&P BSE LargeCap Indices, which are led by finance at over 30%, consumer discretionary and fast moving consumer goods (FMCG) at over 10%, and basic materials, industrials, and information technology with good shares as well.

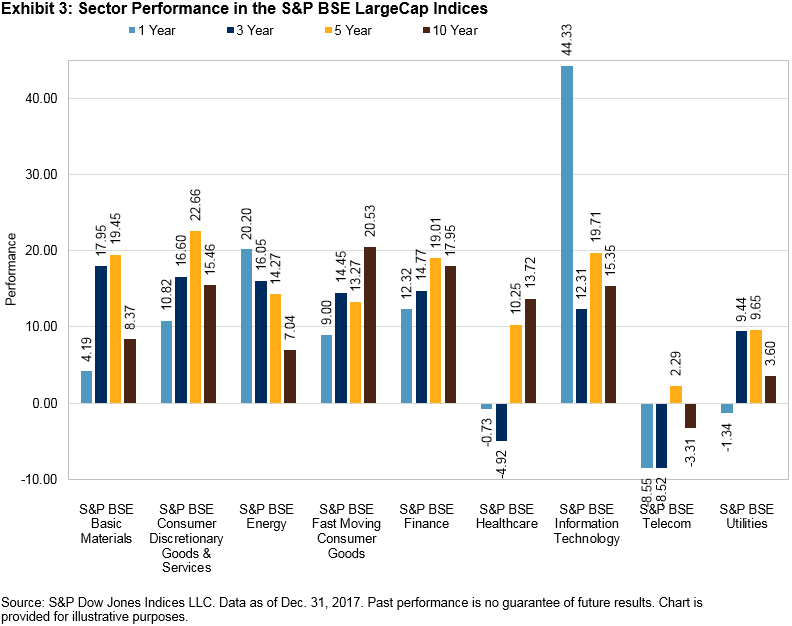
Given that there is a variance in the sectoral balance in each of the large-cap indices, the performance of the indices varies and can provide options with different risk/return profiles. A look at the performance of the sectors in the last few years can help provide a perspective as to how the different sectoral exposures aggregate to a performance characteristic for the indices. Exhibit 3 demonstrates that while information technology was the outperforming sector in the one-year annualized return category, followed by energy, FMCG and finance were the leaders over the long term (i.e., 10 years).

Hence, using indices to measure market segments could provide a cross-sectoral exposure that enables strategies to benefit from diversification.

The indexing route is more diversified than single-stock approaches. Compared with active investing, the methodological approach to index design and consistency helps protect against fund manager bias. The exposure to the large-cap space via indexing as a core strategy offers a portfolio with risk/return characteristics similar to those of the indices.

Exhibit 4: Risk and Risk-Adjusted Returns of S&P BSE Indices
INDEX ANNUALIZED RISK (%) ANNUALIZED RISK-ADJUSTED RETURNS
3-YEAR 5-YEAR 10-YEAR 3-YEAR 5-YEAR 10-YEAR
S&P BSE SENSEX (TR) 13.56% 13.51% 20.83% 0.73 1.06 0.57
S&P BSE SENSEX 50 (TR) 13.44% 13.60% 21.26% 0.80 1.10 0.57
S&P BSE SENSEX 50 TMC (TR) 16.76% 18.20% 23.95% 0.81 1.00 0.64
S&P BSE SENSEX Next 50 (TR) 17.32% 18.32% 24.66% 0.57 0.96 0.51
S&P BSE 100 (TR) 13.71% 14.04% 21.84% 0.77 1.08 0.55
S&P BSE LargeCap (TR) 13.55% 13.80% 21.16% 0.75 1.06 0.56

Source: AIPL. Data as on June 29, 2018. Past performance is no guarantee of future results. Table is provided for illustrative purposes and reflects hypothetical historical performance. The S&P BSE SENSEX 50 was launched on Dec. 6, 2016. The S&P BSE SENSEX Next 50 was launched on Feb. 27, 2017. The S&P BSE SENSEX NEXT 50 TMC was launched on Apr 18, 2018.

Exhibit 5: Annualized Returns of S&P BSE Indices
INDEX ANNUALIZED RETURNS (%)
1-YEAR 3-YEAR 5-YEAR 10-YEAR
S&P BSE SENSEX (TR) 15.96 9.9 14.37 11.77
S&P BSE SENSEX 50 (TR) 15.1 10.75 15 12.22
S&P BSE SENSEX Next 50 (TR) 1.77 9.88 17.65 12.49
S&P BSE SENSEX Next 50 TMC (TR) 6.32 13.5 18.14 15.44
S&P BSE 100 (TR) 12.94 10.58 15.21 12
S&P BSE LargeCap (TR) 13.24 10.14 14.69 11.79

Source: AIPL. Data as on June 29, 2018, 2018. Past performance is no guarantee of future results. Table is provided for illustrative purposes and reflects hypothetical historical performance. The S&P BSE SENSEX 50 was launched on Dec. 6, 2016. The S&P BSE SENSEX Next 50 was launched on Feb. 27, 2017.The S&P BSE SENSEX NEXT 50 TMC was launched on Apr 18, 2018.

The posts on this blog are opinions, not advice. Please read our Disclaimers.

Exploring Commodity Equity and Futures

Contributor Image
Marya Alsati

Former Product Manager, Commodities, Home Prices, and Real Assets

S&P Dow Jones Indices

In April 2017, S&P Dow Jones Indices launched the S&P GSCI Dynamic Roll Reduced Energy 70/30 Futures/Equity Blend. This index is designed to measure the performance of a multi-asset allocation strategy that consists of a futures-based commodities index and an equity index that is based on various commodity-related GICS® subsectors.

The futures portion is represented by the S&P GSCI Dynamic Roll Reduced Energy, which reduces the weight of energy relative to the other commodities in the index, compared with the production-weighted benchmark. It also utilizes a flexible futures contract rolling strategy based on the shape of the forward curve to alleviate the negative impact of rolling into contango and potentially limiting volatility exposure to the commodity market. The futures included in the index cover agriculture, energy, livestock, and industrial and precious metals.

The equity portion is represented by the S&P GSCI Sector Equities, which is designed to measure the performance of companies involved in agriculture and livestock, the exploration and production of industrial and precious metals, and the exploration and production of coal, gas, and oil.

In the past year, commodity futures and equities posted double-digit gains, with the S&P GSCI Sector Equities up 25.8%, the S&P GSCI Dynamic Roll Reduced Energy up 16.3%, and the blend up 19.1% (see Exhibit 1).

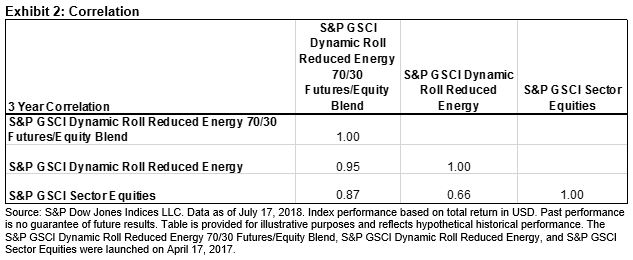
An index that includes both commodity equity and futures can provide more diversification than an index composed of only one asset class. As seen in Exhibit 2, the correlation between the assets was relatively low.

In terms of risk/return analysis, looking at the three-year period, the blended portfolio outperformed the commodity futures index, returning 1.7% compared with -1.5%. It also had a lower annualized risk, at 11.3%, compared with the 16.5% of the equity-only portion (see Exhibit 3).

Analysis of the indices’ inflation beta, which measures the sensitivity of an asset’s nominal prices to changes in inflation levels, showed that commodity futures and producers provided significant inflation protection. The futures-only index provided an inflation beta of 12.0, which indicated that the index historically increased 12% on average for a 1% increase in inflation. The commodity equity index’s inflation beta was 10.4, while the blend’s was 11.6%.

The posts on this blog are opinions, not advice. Please read our Disclaimers.

The S&P 500 Equal Weight Index: A Supplementary Benchmark for Large-Cap Managers’ Performance Evaluation? – Part II

Contributor Image
Aye Soe

Former Managing Director, Global Head of Core and Multi-Asset Product Management

S&P Dow Jones Indices

In a prior blog, we demonstrated that the S&P 500® Equal Weight Index was a more difficult benchmark to outperform than the S&P 500 over intermediate- to long-term investment horizons. In this blog post, we examine the underlying factor exposures of the S&P 500 Equal Weight Index to evaluate the performance of large-cap managers.

As a starting point, we should note that by deviating from market-cap weighting, an equal-weight index generally displays a small-cap bias, value tilt, and higher portfolio volatility than a broad market-cap-weighted index. For example, the annualized volatility of the S&P 500 Equal Weight Index was 15.81% versus that of the S&P 500 at 14.18%.[1]

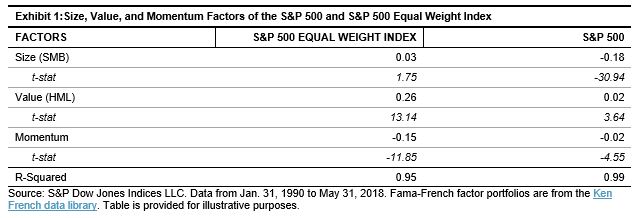
Next, to determine the underlying factor exposures of the indices, we regress the monthly returns of the two indices against the Fama-French factors’ returns, specifically the size, value, and momentum factors. We can see that the S&P 500 Equal Weight Index had higher exposure to the size and value factors and higher negative exposure to the momentum factor (see Exhibit 1) compared with its market-cap-weighted counterpart, the S&P 500.

All the factor coefficients were statistically significant at a 95% confidence level, with the exception of the size factor. These findings were not surprising, as several studies have noted similar results. A research paper by S&P Dow Jones Indices reached a comparable conclusion where the size and momentum factors acted as key drivers of the S&P 500 Equal Weight’s excess returns.[2]

Understanding the factor exposures of the S&P 500 Equal Weight Index allows us to consider a possible framework in which we can potentially evaluate the performance of large-cap active managers on a style-adjusted basis. To be fair, actively managed large-cap funds in our study generally benchmarked themselves against a market-cap-weighted large-cap index, such as the S&P 500 or the Russell 1000. Therefore, one can argue that the S&P 500 Equal Weight Index is not a natural benchmark for these managers, and that they are not managing their portfolios to deliver excess returns over the S&P 500 Equal Weight Index.

However, to the extent that a large-cap manager has an investment process to seek value exposure (or avoid overpaying in general) and to construct a well-diversified portfolio that reduces concentration risk, the underlying risk properties of the S&P 500 Equal Weight Index can be matched up against his/her portfolio. Therefore, we propose that the S&P 500 Equal Weight can serve as a secondary or a supplementary benchmark to the market-cap-weighted S&P 500 to measure the effectiveness of the strategy.

[1]   The annualized volatility is from Jan. 31, 1990 to May 31, 2018.

[2]   Edwards, T., Lazzara, C., Preston, H., and Pestalozzi, O. “Outperformance in Equal-Weight Indices.” S&P Dow Jones Indices LLC. January 2018.

The posts on this blog are opinions, not advice. Please read our Disclaimers.