Get Indexology® Blog updates via email.

In This List

Performance Analysis of Liquidated Funds in Brazil – Part II

The Skill of Champions in Sports & Active Management

Fixed Income Liquidity and ETFs in India

On the Use of Bond ETFs by Insurance Companies

Quality Part I: Defining the Quality Factor

Performance Analysis of Liquidated Funds in Brazil – Part II

Contributor Image
Phillip Brzenk

Managing Director, Global Head of Multi-Asset Indices

S&P Dow Jones Indices

In this blog, we estimate the impact of survivorship bias on the performance of active equity funds in Brazil compared with the benchmark, the S&P Brazil BMI. We do so by replicating the outperformance report from the SPIVA® Year-End 2017 Latin America Scorecard, while removing all the liquidated and merged funds. We noted in a prior blog that as a group, liquidated and merged funds in Brazil underperformed the benchmark by a wider margin than the overall SPIVA active fund universe in Brazil. Consequently, including only surviving funds in the research universe, instead of including all funds that were active at the start of the performance measurement periods, should result in an upward bias in outperformance, which we will demonstrate in this blog.

Exhibit 1 shows the percentage of funds in the Brazil Equity Funds category that outperformed the benchmark for one-, three-, and five-year periods as of year-end 2017. Two groups of funds were formed; the first group was the universe used in the SPIVA scorecard and the second group included SPIVA universe-eligible funds after removing the liquidated and merged funds.

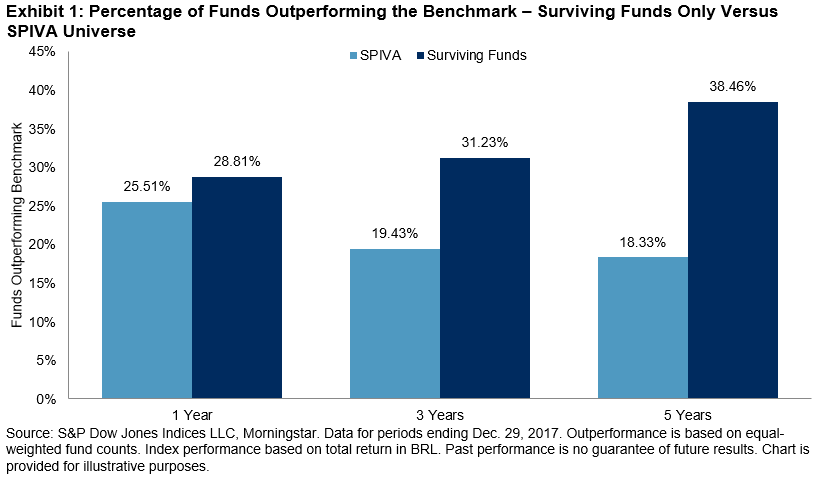
We observed that surviving funds outperformed the entire fund universe for all three lookback periods. Additionally, the difference in outperformance figures between the two groups increased as the time horizon increased. While the percentage of funds outperforming the benchmark for the one-year period was not significantly different, for the five-year period 38% of surviving funds outperformed the benchmark, compared with just 18% for the SPIVA universe. This highlights the importance of correcting for survivorship bias, as the success of funds in the category looked materially different when only the surviving funds were included in the analysis.

The posts on this blog are opinions, not advice. Please read our Disclaimers.

The Skill of Champions in Sports & Active Management

Contributor Image
Hamish Preston

Head of U.S. Equities

S&P Dow Jones Indices

The last few days have been a feast of entertainment for the sporting enthusiast; the Champions League Final, the Monaco Grand Prix, and the NBA Conference Finals were all on the menu.  While the sports represented are distinct, these events have something notable in common: the persistence of their participants.  The same two teams reached the NBA Finals for the fourth consecutive year, the Champions League was won by the same team for the third year in a row, and the Monaco Grand Prix title went to a driver from a team that has regularly featured in the upper echelons of the sport.  In other words, in the sporting world, past performance has been a reasonable guide to future results.

One possible explanation for this persistence is that championship teams possess more skill than their competitors, and that, at the highest level of athletic competition, success depends importantly on skill.  Indeed, we might take the persistence among winners in football, basketball and motor racing as evidence that these activities reward – and are dependent upon – the skill of the participants.  (This very question – the relative importance of skill vs. luck in sporting outcomes – has actually been litigated for darts, pinball, and poker.)

In the popular imagination, active investment management mimics the engaging combination of luck and skill that sport can provide.  Certainly, the fame and fortunes accrued by the most skillful athletes are comparable to those of the most successful active managers.  But has the performance of active managers shown a similar degree of stability?

Over the last few years, S&P Dow Jones Indices has published a series of “Persistence Scorecards”.  Initially focused on the persistence of returns of domestic U.S. equity and fixed income managers, these scorecards have been extended to cover Australia and, most recently,  Latin America.  The results in each of these markets are clear; active managers have found it extremely difficult to consistently outperform their peers.  For example, Exhibit 1 shows that only 3.56% of the 1151 domestic U.S. equity funds whose returns were above the majority of their peers in the 12 months ending September 2013 could boast of a similar achievement at each September in the four consecutive years.  For context, the probability of flipping a coin and getting four consecutive heads is 6.25%.

Exhibit 1: Performance Persistence of Domestic U.S. Equity Funds.

This is by no means the first time that sports and the investment management industry have been considered side by side – Charles Ellis’ brilliant analysis is required reading in this regard.  While skill appears to be rewarded in sports, the evidence suggests luck dominates in the investment management industry.  Hence, investors may find it worthwhile to recall the sentence inserted into many a prospectus: “past performance is no guarantee of future results”.


The posts on this blog are opinions, not advice. Please read our Disclaimers.

Fixed Income Liquidity and ETFs in India

Contributor Image
Alka Banerjee

Former Managing Director, Product Management

S&P Dow Jones Indices

The fixed income market has historically been relatively illiquid in India, as well as globally. The Indian bond market is smaller than other Asian markets like China and Korea, but it is more liquid than they are, yet it is still largely inaccessible to retail investors. The nature of trading that is almost entirely over the counter, leading to price opacity, and the large issuance size of the bonds combine to make it out of reach for the average Indian investor. Bond exchange-traded funds (ETFs) may be able to solve these issues, which may be part of the reason bond ETFs have soared in popularity in developed markets recently.

The widespread perception is that bond ETFs help bring liquidity to the market. First, bond ETFs allow institutional and retail investors to partake in a larger pool of fixed income securities than they normally would have easy access to. Multiple bonds can be bought in smaller chunks defined by the ETF price and size, catering to all appetites, offering a solution to the large issuance size problem. In the case of Indian government securities, ETFs provide the smooth rollover benefit, where the most recently issued bond replaces the earlier issue with no costs associated for the investor, proving to be cost-effective for the average retail investor to manage. In addition, corporate bond market ETFs can be designed to capture desired duration and yield, which can make targeted exposure far easier to achieve.

Bond ETFs can offer low execution costs and allow price discovery. Buyers and sellers can offset each other, removing the need for the frequent buying and selling of underlying securities. As bond ETFs increase in popularity, the buying and selling of ETFs can far exceed that of the underlying securities, contributing to an overall increase in market liquidity. Price discovery happens as the price of the ETF should be a reflection of the index underlying it, which in turn is determined by the weighted sum of the underlying securities. In addition, the act of trading on stock exchanges, unlike for underlying securities, brings transparency to an opaque market. While investors can buy and sell ETFs as a single block, they don’t have to trade in the underlying securities. Authorized participants are permitted to trade in the underlying securities of the ETFs, with the ETF sponsor fulfilling the important role of keeping the net asset value of the ETF in line with the value of the underlying securities. Even during times of market stress, a bond ETF would be at least as liquid as the underlying securities. Finally, ETFs mandate the publication of the underlying securities to be made public daily, which makes the investment even more transparent than a bond fund.

The posts on this blog are opinions, not advice. Please read our Disclaimers.

On the Use of Bond ETFs by Insurance Companies

Contributor Image
Raghu Ramachandran

Head of Insurance Asset Channel

S&P Dow Jones Indices

Recently, S&P Dow Jones Indices published an analysis on the use of exchange-traded funds (ETFs) by U.S. insurance companies in their general accounts. This blog post provides additional details on the investments in Bond ETFs by insurance companies.

The original analysis noted that of the USD 27.2 billion insurance companies invested in ETFs, companies invested USD 7.9 billion in Bond ETFs. Insurance companies in every state—except Alaska, Delaware, Maine, and North Dakota—invested in Bond ETFs. However, companies in five states—Massachusetts, Indiana, Illinois, California, and Texas—accounted for 66% of the Bond ETF investments (see Exhibit 1).

As the paper noted, of the assets invested in Bond ETFs, companies chose to use the Systematic Valuation (SV) designation for 37%, or USD 2.9 billion, of the ETFs. SV is a “bond” like accounting treatment that has the potential to reduce volatility in statutory financials. Companies in 17 states accounted for all of the investments designated as SV. The top five states —Indiana, Massachusetts, Alabama, Connecticut, and Illinois— accounted for 86% of the SV investments (see Exhibit 2).

The overall U.S. use of the SV designation was 37%; however, of the Bond ETF investments in these 17 states, 49% had the SV designation. Exhibit 2 shows the distribution of Bond ETF investments in each state that used the SV designation.

Insurance companies decisively selected whether or not to use the SV designation. If they chose to use SV, they tended to use it for all their Bond ETFs. The companies that used SV designated on average  99.1% of their Bond ETF holdings as SV. Indeed, most of the companies designated 100% their Bond ETF holdings as SV.

The companies that used the SV designation also invested more heavily in ETFs.

The posts on this blog are opinions, not advice. Please read our Disclaimers.

Quality Part I: Defining the Quality Factor

Contributor Image
Aye Soe

Former Managing Director, Global Head of Core and Multi-Asset Product Management

S&P Dow Jones Indices

Quality is a factor that is frequently disputed and debated. Academics and practitioners often argue whether quality is a factor at all in the traditional risk factor framework. Often times, the debate stems from the fact that there is no one consistent, overarching definition or metric to measure quality.

For example, some market participants see low accruals (accounting related) or low earnings variability as signs of earnings quality. At the same time, there are market participants who see profitability as a sign of a high-quality company, and they use measures such as gross profit margin, return on equity (ROE), or return on assets (ROA) as quality proxies.

Solvency measures such as the debt-to-assets ratio or debt-to-equity ratio assess the “safeness” and quality of a company.  In recent years, good corporate governance, as part of the greater trend in ESG investing, is viewed as an indicator of quality as well.

As another sign of the academic community recognizing that differences in quality factors lead to differences in stock returns, Nobel Laureate Eugene Fama and fellow researcher Ken French added two new quality factors—profitability and investment—to their asset pricing model in 2015.[1] Therefore, higher-quality companies, regardless of the definition of quality, on average earn higher risk-adjusted returns than lower-quality companies in both cross-sectional and time series analyses.

To demonstrate this point, we used the S&P 500® Quality Index, which is a composite measure of ROE, accruals, and leverage, as an example. We can see that profitability, as measured by ROE, was rewarded over a long-term investment horizon (see Exhibit 1).[2] Quartile 1—which comprised the most profitable securities or those with the highest ROE—earned higher returns than the other quartiles.

Earnings quality is another desirable characteristic, as shown by long-term premium earned by companies with low earnings accrual ratios over those with higher earnings accrual ratios (see Exhibit 2).[3] Low earnings accruals indicate that earnings are representative of the company’s true earnings power, and that they are more likely to persist in the future.

The financial prudence of a company or its use of leverage is another indicator of quality. Unlike other factors, leverage usage does not necessarily have a linear relationship with returns (see Exhibit 3). While highly leveraged companies can potentially result in financial distress, a low leverage ratio can indicate that a firm may be relying too much on equity financing to finance future business opportunities.

Lastly, we formed quartile portfolios ranked by overall quality score.[4] The results show that higher-quality companies outperformed lower-quality companies (see Exhibit 4).

As with all factors, quality goes through performance cycles. Even though higher-quality companies outperformed lower-quality companies over the long-term investment horizon, there may have been periods when lower-quality companies performed better. In upcoming blogs, we will discuss quality rotation in conjunction with market environments when quality premium is positive.

[1]   Profitability is represented by robust minus weak (RMW), which is the average return on the two robust operating profitability portfolios minus the average return on the two weak operating profitability portfolios, as shown by the following equation.

[2]   In our analysis, we ranked all the securities in the S&P 500 universe on a monthly basis by ROE and then divided them into quartiles

[3]   We define accruals as the change in the company’s net operating assets (NOA) over the last year, divided by its average NOA over the last two years, as shown by the following equation.

[4]   We ranked constituents of the S&P 500, the underlying universe, on a monthly basis using the winsorized average z-score and calculated the back-tested returns of the ranked portfolios. For more information on the quality factor calculation, see https://spindices.com/documents/methodologies/methodology-sp-quality-indices.pdf.

The posts on this blog are opinions, not advice. Please read our Disclaimers.