Get Indexology® Blog updates via email.

In This List

ESG Meets Behavioral Finance – Part 3

Visualizing the SPIVA® Europe Scorecard

The Impact of Size on Active Management Performance in 2017: Part 1

The Importance of Understanding your Benchmark

Technology may be de-FANGed, but could the CHANDs leave you hanging?

ESG Meets Behavioral Finance – Part 3

Contributor Image
Lauren Smart

Managing Director, Global Head Financial Institutions Business

Trucost, part of S&P Global

Black Swans and Green Elephants: Time Inconsistency, Salience, and the Tragedy of the Horizon

“When the well is dry, we know the worth of water.”[1] These were Benjamin Franklin’s cautionary words over 250 years ago. March 22, 2018, is World Water Day, and this year the residents of Cape Town will be feeling the poignancy of his words as they approach “Day Zero”—the day the taps will be turned off (July 9, 2018). Their three-year drought has caused households and businesses to take radical measures to reduce water consumption.[2] Cape Town will not be alone, as the UN warns that by 2030, global demand for fresh water will exceed supply by 40%.[3]

Franklin’s words remain as true today as they were then, because we humans are irrational in how we quantify value and risk at different points in time. This is evidenced by behavioral finance experiments in which it was observed that losing something makes us approximately twice as miserable as gaining the same thing makes us happy.[4] However, preserving what we have is also subject to biases, as we tend to undervalue future risks, particularly if there is a short-term “cost.” Humans are prone to temptation, procrastination, and status quo bias, which explains why so many New Year’s resolutions are broken and why vices such as smoking and drinking remain prevalent, despite our knowledge of the negative consequences.

The interplay of value, risk, and time inconsistency presents a problem for the pension industry. Behavioral factors need to be addressed to encourage people to save more for their retirement, and the investment industry itself needs to tackle the structural and behavioral causes of short-termism. Myopic assessments of risk/reward drove the “irrational exuberance” at the heart of many financial bubbles, and they are a key reason why 50% of investors do not take environmental issues into account.[5] Mark Carney, Governor of the Bank of England, calls this “The Tragedy of the Horizon,”[6] which also alludes to the “Tragedy of the Commons,” a term used in environmental economics to describe the inefficient use of seemingly “free” natural resources. Climate change and resource depletion have short-term financial impacts, too—as the tourism and agriculture industries in Cape Town can attest to—but these will intensify and accelerate over time. In order to mitigate the worst impacts, we need efficient allocation of capital that accurately weighs up short-term costs with long-term benefits. The rational man of classical economics would have no problem with this exponential discounting, but human deviation from rationality leads to environmental externalities, misallocation of resources, and market failure. A good example of the latter is water, where the market price is inversely correlated with its scarcity (see Exhibit 1).

Market failures are not our only challenge; the relatively short-term focus of financial models can cause blind spots for investors. The Organisation for Economic Co-operation and Development (OECD) recently argued that modern portfolio theory is inadequate for incorporating ESG issues because it supports short-termism, is not forward looking, and leads to herding.[7]. It also argues it is ill equipped for the types of discontinuous risk associated with climate change. As the NGO the 2 Degrees Investing Initiative eloquently put it, “All swans are black in the dark.”[8] We must also remember that climate impacts will accelerate, so the future will not look like the past, and as Carney states, “The past is not prologue and the catastrophic norms of the future can be seen in the tail risks of today.”[6] This presents particular problems for new funds trying to break the status quo bias and take a forward view on environmental issues, because back-tests are often used to judge their potential future performance.

Salience can make a difference. If an event is recent and emotive, it is easier to recall, and there is a higher probability of it occurring again. In Cape Town right now, the financial and human impact of water shortages will be particularly salient, but let us hope that we do not have to wait for further catastrophic climate events to make us take the true cost of environmental issues into account. As we enter a new era of lower-carbon, more resource-constrained economic development, we would be wise to remember the disclaimer, “past performance is no guarantee of future results.”

If you liked this blog, you may also like part 1, “‘Nudging’ Sustainable Finance Into the Mainstream: How Behavioral Finance Could Transform Capital Flows to ESG,” and part 2, “The Big Green Elephant in the Room: Why Do We Assume That “Green” Investing Means Sacrificing Returns?

[1] Benjamin Franklin (1746), Poor Richard’s Almanac.

[2] Curnier, Benjamin, The Economist Intelligence Unit, (Feb. 28, 2018), “Cape Town’s water crisis shows the reality for cities on the front line of climate change.”

[3] UN World Water Development Report 2015, (2015), Paris: UNESCO Publishing.

[4] Thaler, Richard and Cass Sunstein (2009), “Nudge.” Yale University Press.

[5] The CFA Institute (2017), “ESG Survey 2017.”

[6] Carney, Mark, (Sept. 29, 2015), “Mark Carney: Breaking the tragedy of the horizon – climate change and financial stability

[7] OECD (2017), “Investment governance and the integration of environmental, social and governance factors.”

[8] 2 Degrees Investing Initiative and the Generation Foundation (February 2017) “All Swans are Black in the Dark: How the Short-Term Focus of Financial Analysis Does not Shed Light on Long Term Risks.”

If you enjoyed this content, join us for our Seminar Discover the ESG Advantage in
London on May 17, 2018.

The posts on this blog are opinions, not advice. Please read our Disclaimers.

Visualizing the SPIVA® Europe Scorecard

Contributor Image
Andrew Innes

Head of Global Research & Design

S&P Dow Jones Indices

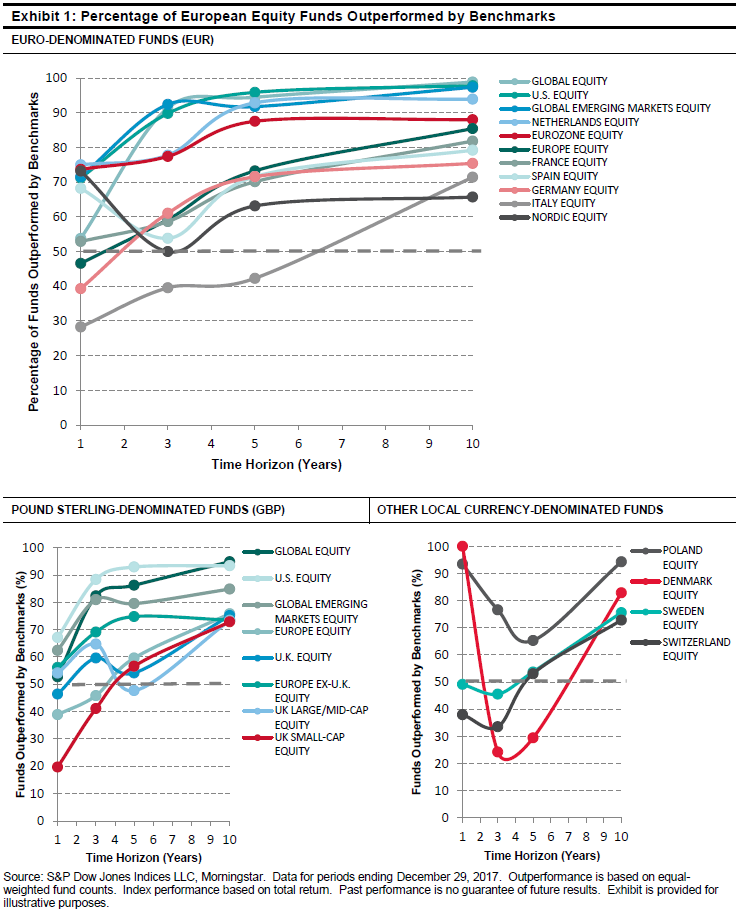
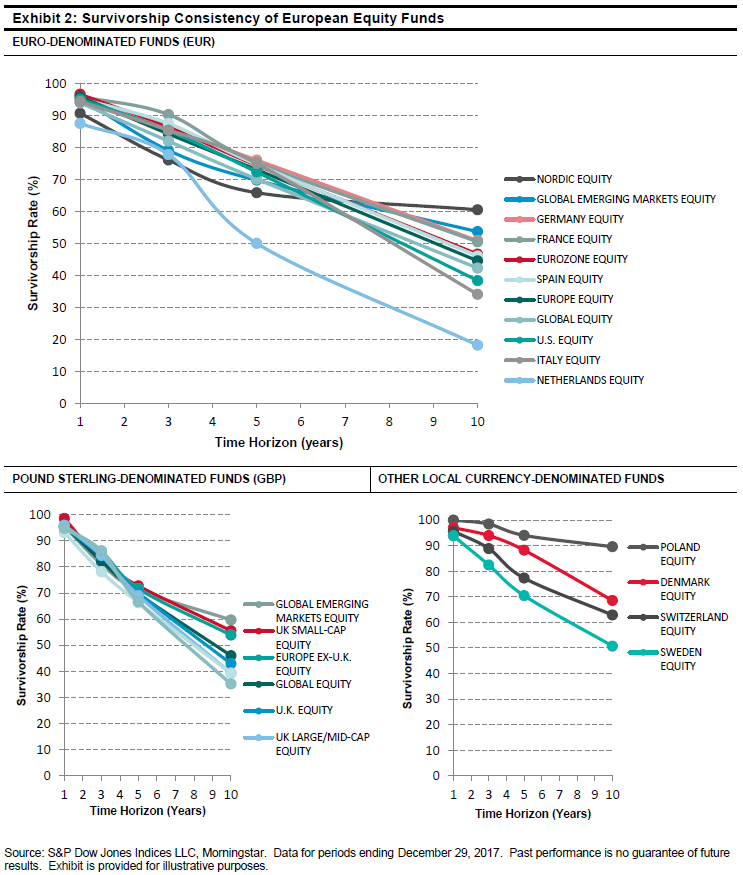
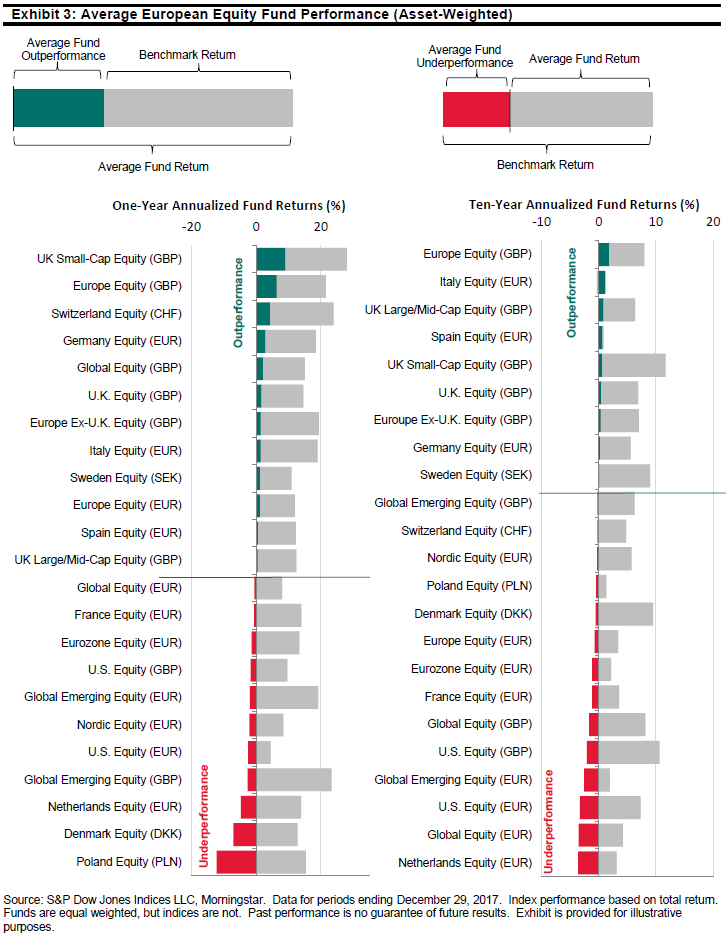
The S&P Indices Versus Active (SPIVA) Europe Year-End 2017 Scorecard is composed of a rich dataset of active fund performance figures and insights for those wishing to participate in the active versus passive debate. The coverage and detail in the report may be extensive, but the conclusions needn’t be complex. By visualizing the data as charts, the findings can be brought to life. Here are three key takeaways that the charts help depict more clearly than numbers ever could.

1. The majority of funds have underperformed their benchmark over long time horizons.

While the percentage of funds that were beaten by their benchmark over any single year can fluctuate between each SPIVA report, the long-term trend has always persisted. No active fund category in the SPIVA Europe Year-End 2017 Scorecard had a majority of outperforming active funds when measured over a 10-year period.

2. Funds have consistently struggled to survive across most fund categories.

Underperforming funds may eventually face closure. The survivorship rates show us that active funds have steadily disappeared over time. The charts clearly show how the rate of survivorship across many fund categories was surprisingly similar.

3. Outperforming fund categories have reduced over longer time periods.

Just 9 out of 23 active fund categories across the European-domiciled equity funds analyzed were able to provide average asset-weighted returns above their corresponding benchmarks over a 10-year period. By cross-checking each of these nine fund categories with the SPIVA Europe Scorecard, we can see that within each, less than a third of funds beat the benchmark. The success of a minority of funds was therefore responsible for lifting the average.


Within the pages of the SPIVA Europe Scorecard, the relative performance and survivorship of active funds across multiple time periods and multiple fund categories are measured against the performance of their respective S&P DJI benchmark indices. To find out more, please see the latest SPIVA Europe Year-End 2017 Scorecard.

The posts on this blog are opinions, not advice. Please read our Disclaimers.

The Impact of Size on Active Management Performance in 2017: Part 1

Contributor Image
Ryan Poirier

Former Senior Analyst, Global Research & Design

S&P Dow Jones Indices

U.S. equity markets finished 2017 on a strong note, with the S&P 500® returning 21.83% during the one-year period ending on Dec. 31, 2017. This was followed by the S&P MidCap 400® and S&P SmallCap 600® returning 16.24% and 13.23%, respectively.

Despite market-cap weighting being a dominant form of indexing, equal weighting has outperformed on a cumulative basis over the past 28-year investment horizon. However, on a rolling one-year basis, 2017 was also the first time in about two years that equal weighting underperformed market-cap weighting (see Exhibit 1). In this blog series, we will discuss the impact that size (specifically mega-cap securities) had on the performance of U.S. equity indices in 2017.

Furthermore, we extend the size analysis to the active management space by quantifying the style and market-cap drift displayed by managers, and to what extent that drift influenced the performance of those actively managed funds. Finally, we present results comparing how the AUM size of managers affected their performance.

As a starting point, Exhibit 2 shows the contribution to return of the S&P Composite 1500® by market capitalization, divided into 20 distinct groupings so that each bucket has approximately 5% of the beginning index weight. The numbers on top of the bars represent the constituents represented in each group—as such it takes an increasing amount of companies (or share classes for those with duplicates) to reach the 5% threshold. In an environment where size is not the primary driver of returns, this chart would appear level across all data points.

We can observe that the top 5% group accounted for roughly 10% (2.2% divided by 21.13%) of the overall index return. Furthermore, the third-largest group accounted for an additional 10% of the headline return. Group 2, despite being larger in market cap compared with group 3, had a lower contribution to return, due to negative performance by one of its members. The contribution spread between the top three groups and the bottom three groups amounted to 3.13%. Hence, the data highlights that 2017 was a good year to be invested in mega-cap names, given that 10 securities comprising the top 15% (by weight) of the S&P 1500 Composite accounted for approximately 26% of the overall index return.

Furthermore, the S&P 100 and S&P 500 Top 50, which represent the largest 100 and 50 securities from the S&P 500 returned 21.96% and 23.28%, respectively. Given this nature of the U.S. equity market, in 2017, active managers investing in domestic equity could not afford to have large active underweights in those mega caps.

In the next blog, we will use the information presented here in tandem with data from the SPIVA® U.S. Year-End 2017 Scorecard to further understand the relative performance characteristics of active managers.

The posts on this blog are opinions, not advice. Please read our Disclaimers.

The Importance of Understanding your Benchmark

Contributor Image
Alka Banerjee

Former Managing Director, Product Management

S&P Dow Jones Indices

Recent SEBI guidelines have highlighted the issue of flawed benchmark usage in the Indian mutual fund industry. Globally funds are required to be transparent and provide complete information around their investment philosophy and within that requirement of transparency. The fund manager is given the leeway to choose their own appropriate benchmark.

First, in this context, it is important to understand the role of a benchmark. Quite simply, the benchmark that an active fund manager chooses mirrors the investment philosophy of the fund. This means that if the fund’s purpose is to invest in largecap stocks, then an appropriate benchmark should be designed to capture only largecap stocks. In this manner, the active manager’s performance can be clearly judged to see if the specific active strategy that has been adopted has value besides a simple index of large cap stocks. The fund manager’s skill in picking stocks will then become clearly evident. Similarly if the fund purports to invest in infrastructure stocks, then the benchmark should be an infrastructure index. Benchmarking against indices like the S&P BSE 100 or the S&P BSE 200, when the investment purpose is far more specific in terms of size, sector, or factors, is an inappropriate use of benchmarks.

Recently, SEBI laid out guidelines defining top 100 listed stocks by total market capitalization, the next 150 as mid cap and the following 250 as small cap stocks. All fund managers are required to choose stocks within these ranges for their various large cap, midcap or small cap funds. There are some buffers built in to avoid large turnover and additional costs, but the idea is to enforce clarity and symbiosis around benchmark and stock selection. A large cap strategy should focus on investing in large cap stocks and should not depend on buying mid cap stocks to give it the alpha over a benchmark. The true value of an investment strategy is not judged against the total market performance but over an index which has similar rules, providing the performance against a generic use of that approach. When choosing funds for investing, investors need to understand the nuances of benchmark selection so that they can make an informed judgement of the value they are paying for and getting over a period of time.

The posts on this blog are opinions, not advice. Please read our Disclaimers.

Technology may be de-FANGed, but could the CHANDs leave you hanging?

Contributor Image
Tim Edwards

Managing Director, Index Investment Strategy

S&P Dow Jones Indices

It has not been a great start to the week for the technology sector, with large-cap tech stocks dragging down equity indices across the globe.

With the current media focus on the industry behemoths, suitably arranged into fun acronyms (“FANGs” and so on), investors in the U.S. tech sector might be concerned about the risks of over-concentration.  But is the tech sector the right part of the market to be worried about?

Certainly, the risks of concentration are present in tech: the top five issues account for a shade under half of the total S&P 500 Information Technology index.  As we have argued previously, more concentrated portfolios can have unfortunate characteristicsEqual-weight indices can help investors manage sectoral concentration risk; they tend to limit a portfolio’s exposure to single issues, and logically outperform as concentration decreases from higher to lower levels.  Should the overall level of concentration within sectors mean-revert, then the current level of concentration – when compared to historical norms – offers a potential guide as to whether an equal- or cap-weighted strategy may be more effective at generating returns.

Which makes it important to notice that the present level of concentration is not unusual for the tech sector.  By the “top-five” measure, the S&P 500 Information Technology index is neither more, nor less concentrated than was typical over the past decade.

In fact, another sector is displaying far greater warning signs.  Concentration in the consumer discretionary sector, while less dramatic in absolute terms, is reaching unusual levels relative to recent history.

Just one issue (Amazon) presently accounts for over 21% of the sector, while the next four (Home Depot, Comcast, Disney and NetFlix) account for another 23%.  Accordingly, while tech may retain the headlines, investors worried about unusual levels of concentration may be better off applying their discretion in other sectors – and perhaps worrying about the CHANDs, not the FANGs!

The posts on this blog are opinions, not advice. Please read our Disclaimers.