Get Indexology® Blog updates via email.

In This List

As Markets Await Fed Chair Nomination, U.S. Treasury Curve Continues to Flatten

S&P STRIDE Target Date Funds: Making STRIDEs in Evaluating the Performance of Retirement Solutions

Sustainability Landscape in Brazil

Getting What You Pay For

Alternative Index Choices for Canada

As Markets Await Fed Chair Nomination, U.S. Treasury Curve Continues to Flatten

Contributor Image
Jason Giordano

Director, Fixed Income, Product Management

S&P Dow Jones Indices

President Trump said he will make an announcement during the week of Oct. 30, 2017, regarding his nomination for who will replace Chairwoman Janet Yellen when her term ends in January 2018.  Most reports suggest current Fed Governor Jerome Powell will get the nod over Stanford University economics Professor John Taylor.  Mr. Taylor could still be named to the role of vice chair; however, an announcement on that position is weeks away.  While Mr. Taylor would most likely provide a more hawkish influence, Mr. Powell offers a status quo approach from a monetary policy perspective.  The FOMC continues to communicate its intentions to gradually raise interest rates and normalize its balance sheet while working in a low unemployment, low inflationary environment.

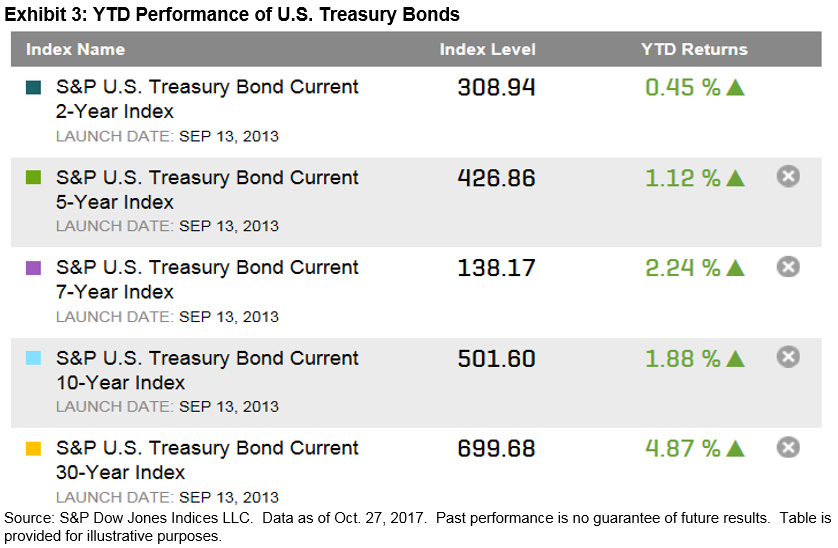
Nearly two years into the current (albeit slow) tightening cycle, the bond market continues to question the prospects for long-term growth.  On Dec. 15, 2015, the Fed raised its rates for the first time since 2005.  Since then, there have been three more rate hikes, for a total of 100 bps.  The two-year yield has increased 115 bps (see Exhibit 1), however the long end of the curve has fallen, producing a much flatter yield curve.  The yield on the 30-year on-the-run bond is actually 17 bps tighter than it was in October 2015 despite the lift in short-term rates.

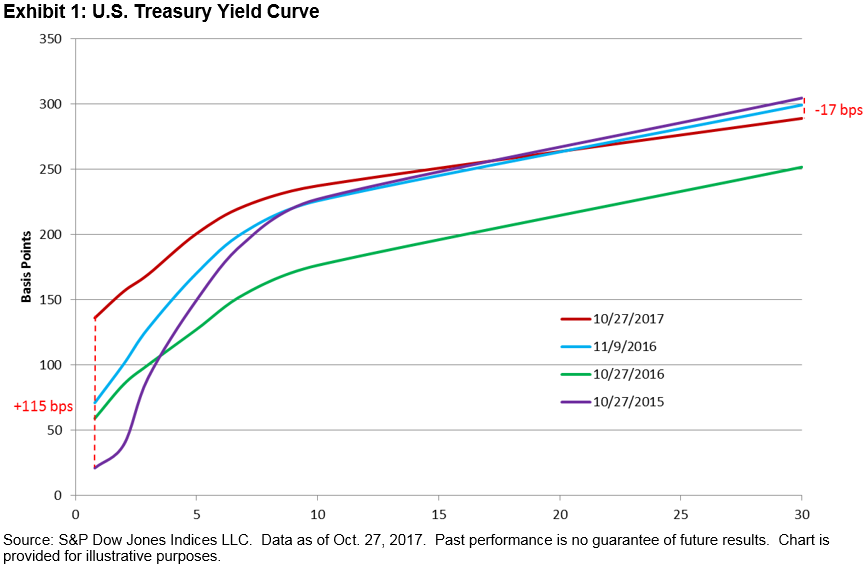
Using the series of S&P U.S. Treasury Bond Current Indices, which is a series of security indices that seek to measure the most recently issued bond for each maturity, we can view yield spreads between key maturity ranges of the yield curve (see Exhibit 2).  In normal economic times, spreads between longer-dated maturities and shorter-dated maturities should be positive, representing a combination of positive growth expectations, positive inflation expectations and, in general, an indication of stable or improving economic conditions.  Conversely, spreads that are contracting may indicate market anticipation of slowing growth, slowing inflation, or worsening economic conditions.

Almost every segment of the yield curve is flatter now than at any time over the past 10-year period (see Exhibit 2).  The 2/30 spread, which represents the majority of the total yield curve, has experienced the greatest amount of flattening and was 270 bps tighter as of October 2017 than its high point in January 2011.

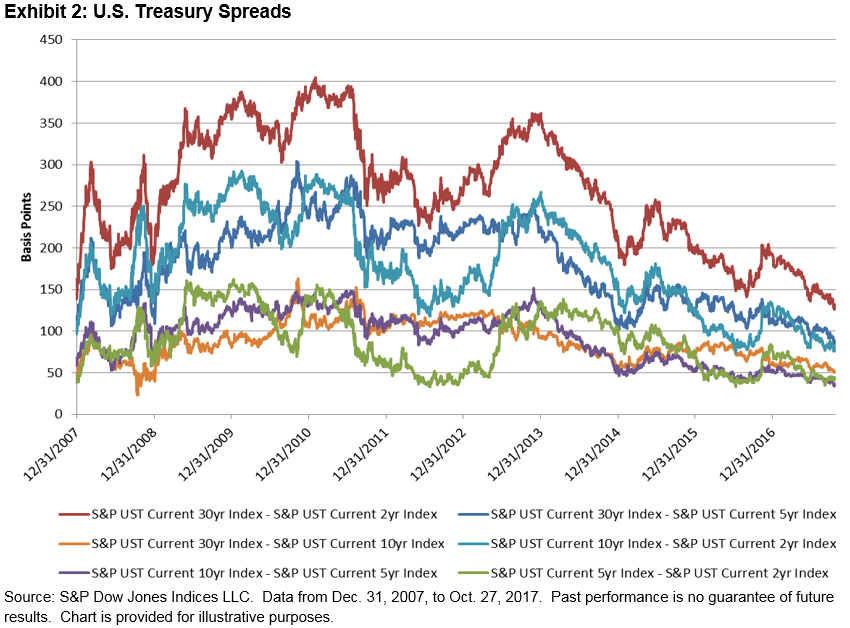
As a result of the overall flattening, U.S. Treasury bonds have performed well in 2017 (see Exhibit 3).  Each of the 2-, 5-, 7-, 10-, and 30-year current indices had positive YTD performance, with the S&P U.S. Treasury Bond Current 30-Year Index returning 4.87% as of Oct. 27, 2017.

The posts on this blog are opinions, not advice. Please read our Disclaimers.

S&P STRIDE Target Date Funds: Making STRIDEs in Evaluating the Performance of Retirement Solutions

Contributor Image
Jack Towarnicky

Executive Director

Plan Sponsor Council of America

Back in the Great Recession of 2008-2009, participants experienced a dramatic stock market decline.  The S&P 500 index had a “peak-to-trough” decline of 51 percent! Coincidentally, many retirees and near-retirees were gaining their initial experience with something called a Qualified Default Investment Alternative (QDIA). The QDIA is a “safe harbor” (Department of Labor Regulation 29 CFR §2550.404c-5, 72 FR 60452 (Oct. 24, 2007) for plan sponsors allowing an investment allocation even if a participant does not provide direction. QDIAs became much more prevalent after plan sponsors took advantage of provisions added by the Pension Protection Act of 2006 (Pub. L. 109-280) and the associated Treasury Regulations §§ 1.401(k)-1(j), (k) (proposed in 2007 and finalized in 2009) to adopt automatic features. Concurrently, on October 24, 2007, the Department of Labor provided regulatory relief to fiduciaries in selecting a QDIA (Department of Labor Regulation 29 CFR §2550.404c-5 (see above).

The most prevalent QDIA is a Target Date Fund (TDF). A TDF automatically rebalances its asset allocation to follow a predetermined pattern known as a glide path to ensure the participant’s account is allocated in an ever more conservative fashion.  When used as a QDIA, a plan sponsor will typically select a TDF of the year ending in 0 or 5 that is closest to a participant’s 65th birthday. For example, someone born in 1960 might have a Target Date 2025. The TDF investment allocation is structured to anticipate benefit commencement in that target year or soon thereafter.

In 2008-2009, most participants at or near age 65 had a Target Date of 2010.

It turned out that every TDF had its own definition of more conservative, or what constitutes a lower-risk allocation. At that time, Morningstar found short-dated funds, like 2010 target date funds, had the widest range of allocations to equity investments that: “… span a startling range of equity allocations – from 72 percent to 26 percent. Unsurprisingly, series that had higher equity weightings typically trailed the more conservative offerings in 2008.” (See Morningstar, Inc. Target date Series Research Paper, 2009 Industry Survey, September 9, 2009)

The importance of such distinctions was often lost on plan sponsors, fiduciaries, and participants. Certainly, during the 2008-2009 Great Recession, Target Date 2010 fund performance varied dramatically from participant expectations, triggering hearings in the U.S. Senate Special Committee on Aging, and expert testimony to the Department of Labor, the Securities & Exchange Commission, plus representatives from the Senate Special Committee on Aging, June 18, 2009. Retirees and near retirees had experienced a drastic, abrupt decline in their account balance, sometimes in excess of 50 percent. That decline translated into a significant reduction in retirees’ and near retirees’ expectations about retirement income and consumption.

That dramatic result also helped expose a significant concern: To what extent can retirees or soon-to-retire workers rely on their Target Date Fund to be properly positioned for generating income (financing consumption)?

Since then, mutual fund providers have been analyzing alternatives that might reduce the volatility in retirement income/consumption. For example, S&P Dow Jones Indices and Dimensional Fund Advisors (Dimensional) completed a study that considered how many TDF strategies compare with a new index—STRIDE (Shift to Retirement Income and DEcumulation) Index Series. The study found that the index series is a fitting benchmark for TDF strategies that are designed to be used throughout both the accumulation and decumulation period, and that focus on reducing fluctuations in expected retirement income and consumption. STRIDE was compared against the average of 2010 Target Date funds. The period studied was 2003 – 2016, which includes the market decline during the Great Recession. Researchers identified the three main investment risks that drive uncertainty around future consumption in retirement: market risk, interest rate risk, and inflation.

These indices use a glide path that transitions from growth-seeking assets (40 years prior to the projected target date) to assets that can support a more stable level of inflation-adjusted, in-retirement income (for a 25-year period after the target date). The goal is to identify a retirement investment solution that manages uncertainty about how much in-retirement income a saver’s balance can generate.

STRIDE’s structure varies noticeably from that of the average 2010 TDF. The STRIDE glide path reduces equity allocations starting 20 years prior to the target date, where the goal allocation at the target date is 75 percent Treasury Inflation Protection Securities and 25 percent equities. Other Target Date fund allocations vary significantly, in part based on a fund’s strategy of either “to” or “through” retirement. Some TDFs have a “to” goal reflecting a higher degree of safety and liquidity – participants in these funds might use the funds to purchase an annuity.  Other TDFs have a “through” goal anticipating investors will hold onto assets after age 65, reflecting a longer time horizon.

In regards to a “to” or “through” glide path – S&P Dow Jones Indices and Dimensional found that a STRIDE structure where the target date matches the anticipated commencement of payouts may result in less volatility in a participant’s expected income/consumption in retirement. Studies show a majority of plans now use TDFs (see above (GAO), see also: ICI Factbook, Figure 7.14 ). Alternatives that may avoid wide swings in estimated retirement income/consumption may be of interest to plan sponsors as more and more participants are leaving assets in the plan following separation/retirement.

The posts on this blog are opinions, not advice. Please read our Disclaimers.

Sustainability Landscape in Brazil

Contributor Image
Kelly Tang

Former Director

Global Research & Design

At the annual ABRAPP (Associação Brasileira das Entidades Fechadas de Previdência Complementar, the organization representing pension fund managers in Brazil) conference, sustainability was one of the headline topics.  The conference allowed for in-depth discussions with Brazilian institutional investors, regulators, officials from B3 (formerly known as Bovespa and now the largest exchange in Latin America), trade groups promoting sustainability, and various asset managers.  The conversations with the referenced parties centered on ESG issues in Brazil and the future of ESG investing in that particular market.  What was apparent from our meetings with these market participants is that there is a great deal of genuine interest in ESG backed with extensive knowledge on the topic.  Here are the key takeaways from those conversations.

Timing Is Right for Interest in ESG-Driven Solutions

Brazil finds itself coming out of the country’s biggest corporate scandal, called Lava Jato (“car wash”), which involved Petrobras (Brazil’s largest state-owned enterprise), large contractors who were paying bribes to Petrobras to procure bids, and senior government officials who received payouts from Petrobras executives.  According to Brazilian authorities, the payouts and fees associated with Lava Jato exceed USD 2 billion.  There is clear momentum given this backdrop and it appears that corporate governance and shareholder value maximizing (i.e., long-termism or the “G” aspects of ESG) are on the top of the priority list for market participants.  In fact, the agenda and topics covered in the ABRAPP conference centered mostly on governance issues.  Given that Brazilian interest rates are coming down and stabilizing, the environment makes sustainability-driven, multi asset class solutions attractive to market participants.

Education and Brazil Focus Approach Are Instrumental to Success of ESG in Brazil

There was considerable appetite for knowledge sharing and most market participants shared that they desired to start the process of implementing sustainability in their portfolios but did not know exactly where to start.  The success of ESG in Brazil, or for that matter, anywhere, will be largely dependent upon the extent to which the active parties in the field of sustainability offer sufficient research and data on local companies and whether the right investment solutions exist.  In both cases, a more Brazil-oriented approach is needed rather than a pan-Latin American approach.  Brazilian institutional investors realize the importance of ESG investing and accept the fact that it is here to stay, and therefore the age-old misconception that ESG is return detractive did not come up as an obstacle for ESG.  What appeared to be more of a hindrance was some confusion as to how to start this process more than whether to do so.

Where to Start?

Although asset managers noted that market participants have not demanded ESG products per se, asset owners then complained that there were little ESG products or offerings for them to access.  However, one area that has the potential for growth in the immediate future is green bonds.  Overall, green bond issuance in Brazil accounts for 0.2% of the total bond market in Brazil, compared to 4.0% of issuance in the global bond market.  Brazil has made considerable progress in the past three years on green finance despite suffering a recession, and it is estimated that the second half of 2017 will see approximately USD 800 million in green bond issuance in Brazil for wind energy generation projects.

Given that many of the Brazilian market participants with whom we met are signatories to the Principles for Responsible Investment, for ESG driven investment solutions to take greater adoption will require implementation of the Principles and actually having sound ESG policies and practices in place.  As leaders in the passive ESG solution space, sharing our collective knowledge at S&P Dow Jones Indices with the Brazilian market will help speed up this process and help promote investor engagement across the globe.

The posts on this blog are opinions, not advice. Please read our Disclaimers.

Getting What You Pay For

Contributor Image
Craig Lazzara

Former Managing Director, Index Investment Strategy

S&P Dow Jones Indices

Earlier this week, the Wall Street Journal featured a long article arguing that Morningstar’s star ratings for mutual funds were a “mirage.”   Since these ratings exert a powerful influence over fund flows, their usefulness is obviously of keen interest to investors.  To its credit, Morningstar, although arguing that its ratings are a “worthwhile starting point,” acknowledges that they are backward-looking and were not designed to be a predictive model of future performance.  Morningstar’s own analysis argues that the ratings are most powerful when used to select allocation or taxable-bond funds, while they “exhibit less predictive power” for U.S. equities.

This will not surprise anyone who has even a nodding acquaintance with our Persistence Scorecards.  A companion to our better-known SPIVA reports, our Persistence analysis asks whether managers’ historical success predicts their future results.  Looking back ten years, e.g., we can ask whether top quartile managers in the first five years repeated their performance in the second five years.  As the table below shows, they typically don’t:

Source: S&P Dow Jones Indices LLC. Data for periods ending March 31, 2017. Past performance is no guarantee of future results. Table is provided for illustrative purposes.

If performance were random, 25% of the top quartile managers from the first five years would be in the same quartile in the second five years.  In fact, across the cap range, top quartile managers were more likely to move to the bottom quartile than to remain at the top.

Ironically in view of this week’s controversy, a valuable perspective on the same phenomenon comes from a 2010 Morningstar study.  The study examined the predictive power of star ratings and expense ratios, and noted that “If there’s anything in the whole world of mutual funds that you can take to the bank, it’s that expense ratios help you make a better decision….In every asset class over every time period, the cheapest quintile produced higher total returns than the most expensive quintile.”  If low expense ratios are predictive of returns, it follows that “you get what you pay for” is wrong, at least in a general sense.  If you got what you paid for, high-expense ratio funds would outperform low-expense ratio funds.  If you don’t, that’s a powerful argument in favor of the kind of mean reversion we persistently see in our Persistence Scorecards.

Given the burden of empirical evidence, one is left to wonder why investors continue to include past performance as a factor in their decision making.  I suspect that it’s deeply and fundamentally behavioral – we human beings are conditioned to believe that the past predicts the future.  And in much of life, the past is a useful guide.  Because investment management is an exception, not the rule, confusion about the importance of historical performance is likely to continue.

The posts on this blog are opinions, not advice. Please read our Disclaimers.

Alternative Index Choices for Canada

Contributor Image
Kevin Horan

Former Director, Fixed Income Indices

S&P Dow Jones Indices

The ever-changing environment of business has led to significant changes in the index world.  As with any market, consumers or market participants require more options in order to operate in such a fast-paced environment.  For many years, Canadians have relied on a singular index provider to represent their market.  As the pressures of the current business environment require cost controls, additional service demands, or regulatory review, the need for additional service and provider options increases.

The S&P Dow Jones Indices series of Canadian indices offers competitive alternatives for benchmarking, product issuance, and data needs.  The minimum par amount outstanding required for sovereign bonds is CAD 1 billion.  With the exception of sovereign bonds, the minimum par amount outstanding required for a bond to be eligible for index inclusion is CAD 250 million.

In comparison, the FTSE TMX Canada Universe Bond Index requires CAD 100 million for corporate bonds and CAD 50 million for government bonds, which include municipal and provincial bonds.  The higher minimum par amount outstanding enables S&P DJI’s indices to capture the market’s performance while also providing a universe of more liquid bonds.

Exhibit 1 shows a structural and return comparison between the two index providers of comparable bond universes.

The posts on this blog are opinions, not advice. Please read our Disclaimers.