The release of the SPIVA U.S. Mid-Year 2017 Scorecard provided a welcoming dose of optimism for proponents of active management. One statistic, which was picked up heavily by financial media (Financial Times Article) and market participants, is that 52.49% of All Domestic Funds managed to beat the S&P Composite 1500® (the designated benchmark). The conversation thereafter sounds something similar to the following: “Active management is back…”
A single SPIVA statistic should not be seen as a full representation of the report. The SPIVA Scorecard is meant to be a tool viewed in its entirety rather than cherry picking the (very first) data point in the report. For example, the All Domestic Funds category comprises individual funds investing against their respective cap ranges, and it is then aggregated and compared against the S&P Composite 1500. This means that funds investing in domestic small-cap equities are being compared against an index with a large-cap tilt. The effective difference in benchmark performances was 22.47% (S&P SmallCap 600®) versus 18.09% (S&P Composite 1500), certainly a much lower bar to clear. With that in mind, the focus should be on the relative performance of managers across various capitalization segments or the style against their respective benchmarks.
Despite this clarification, a fair amount of optimism was provided by the results in the domestic large-cap equity space. With only 56.56% of large-cap active managers underperforming the benchmark for the one-year period ending June 30, 2017, it marked a substantial reversal of fortune from the results seen at mid-year and year-end 2016, with 66% and 84.62% of the managers underperforming as of Dec. 31, 2016, and June 30, 2016, respectively.
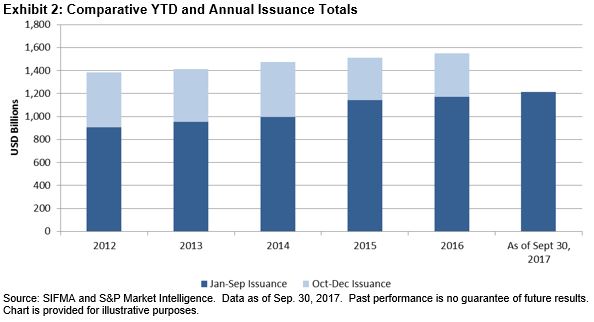
In addition to improvement in relative performance figures, large-cap equity managers also appeared to benefit from better security selection skills (see Exhibit 1). The dark blue bar represents the portion of the excess return above the benchmark coming from security selection within each GICS sector. The light blue bar measures the portion of excess returns coming from sector allocation decisions. They both represent active returns stemming from managers’ decisions. The numbers below and above the chart represent the total return of the S&P 500® over the past 12-month period.
While both allocation and security selection effects are active decisions that contribute to active returns, we can observe that a cumulative negative 12 months of returns in the market is typically followed by managers adding value with allocation. This may be a consequence of managers avoiding certain volatile sectors. One of the perceived benefits of active management is that it provides cushion during market downturns. To confirm this, we examined the six-month periods between Dec. 31, 2000, and June 30, 2017, and separated the excess returns of large-cap managers during up and down markets. What we can see from Exhibit 2 is that managers, on average, do poorly in regard to stock selection decisions during down markets. The value that is added during up market periods (average annual active returns of 19 bps) is negated by the -54 bps that they subtract when the market is down. This is primarily driven by the poor stock selection (-70 bps) during down periods.
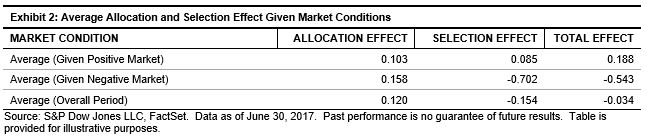
Based on the recent SPIVA U.S. Scorecards, actively managed domestic equity funds appear to have had a positive trend over the past three semiannual periods. While the results are a welcome change and demonstrate that active allocation and security selection decisions have been adding positive value, market participants may want to consider beyond short-term results and examine managers’ performance during various market environments. As we have demonstrated, actively managed funds, on average, have not provided positive excess returns during down markets, driven primarily by poor security selection.
The posts on this blog are opinions, not advice. Please read our Disclaimers.