Get Indexology® Blog updates via email.

In This List

U.S. Corporate Debt Issuance on Pace for Record Year

Capitalization and Its Discontents

Rieger Report: Will Pressure on Property & Casualty Companies Impact the Bond Markets?

The Growth of Dividend Investing and Driving Forces

What the Earthquake Left Us

U.S. Corporate Debt Issuance on Pace for Record Year

Contributor Image
Jason Giordano

Director, Fixed Income, Product Management

S&P Dow Jones Indices

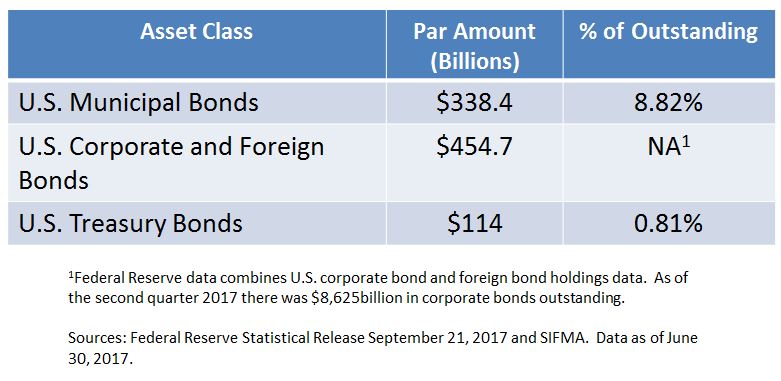
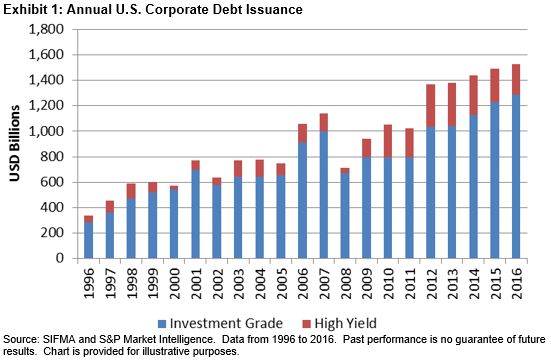
U.S. corporations continue to take advantage of the accommodative conditions created by a protracted period of low interest rates and strong market participant demand.  As of Oct. 1, 2017, U.S. investment-grade corporate debt issuance surpassed USD 1 trillion—three weeks ahead of 2016’s pace.  Additionally, the amount of speculative-grade corporate debt issued through the first three quarters of 2017 is 17% higher than it was after the first three quarters of 2016.  Combined, U.S. corporate issuance is on pace for another record year, which would mark the sixth consecutive year of increased corporate debt issuance (see Exhibits 1 and 2).

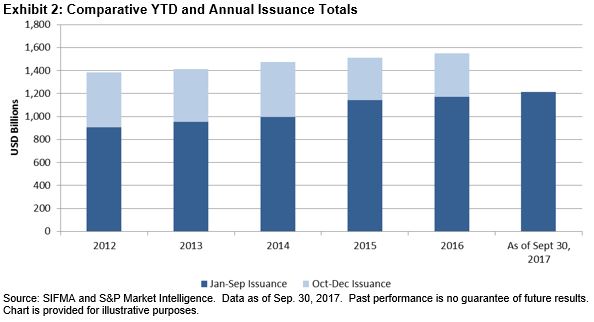
Corporations have not only been issuing more debt each year, but they’ve also been extending the maturities in an effort to lock in low funding costs for several decades.  In January 2017, Microsoft Corp issued a total of USD 7.5 billion of 30-year bonds with an average coupon of 4.2%.  One month later, in February 2017, fellow ‘AAA’-rated Johnson & Johnson issued USD 2.5 billion of 30-year bonds with an average of coupon of 3.7%.  Nearly 20% of the USD 1 trillion investment-grade debt issued YTD has been in 30-year term deals.  The average maturity of corporate issuances has grown significantly over the past 15 years (see Exhibit 3).

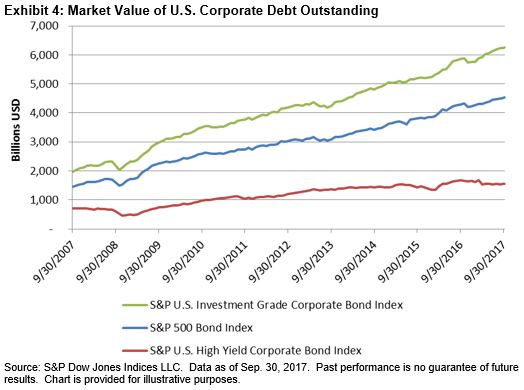
As a result of the continued increases in annual issuance amounts combined with extensions in average maturities, the total amount of U.S. corporate debt outstanding has more than tripled over the past 10 years.  The par amount outstanding of investment-grade corporate debt, as measured by the S&P U.S. Investment Grade Corporate Bond Index, has increased over USD 4 trillion since September 2007, while the amount of speculative-grade outstanding, as measured by the S&P U.S. High Yield Corporate Bond Index, has increased by USD 800 billion.  Over 60% of this increase can be accounted for by the companies in the S&P 500, as tracked by the S&P 500 Bond Index (see Exhibit 4).

Given the record amount of corporate debt outstanding, U.S. corporations have increased the degree of financial leverage to well above pre-crisis levels.  Perhaps more concerning is how corporations have chosen to use the proceeds of this record debt.  Most companies have favored short-term shareholder wealth (in the form of dividends, share buybacks, and M&A activity) over longer-term capital expenditures.  As U.S. equity markets continue to set record highs (in what seem to be weekly events), market participants may want to look at corporate capital management and, more importantly, how changes in corporate capital structures can potentially drive equity valuations.

The posts on this blog are opinions, not advice. Please read our Disclaimers.

Capitalization and Its Discontents

Contributor Image
Craig Lazzara

Former Managing Director, Index Investment Strategy

S&P Dow Jones Indices

Last week, readers of the Financial Times were regaled by suggestions that capitalization-weighted index funds were “hugely biased,” “undiversified,” and “too trusting of the market’s judgment on a handful of very large stocks.”  Criticisms of cap weighting aren’t new, of course, and at least in the near term seem not to have been very effective at deterring flows into passive strategies.  Nonetheless it may be worth asking how cap weighting achieved its prominent role in the investment firmament.

It was not, we hasten to say, because a handful of index providers decided to foist a flawed concept on the unsuspecting masses.  Indices began when journalists and stock exchanges wanted to communicate how the stock market had performed.  This raised an obvious question: how to combine the returns of a number of individual issues to summarize “the market?”  Combining returns requires choosing how each individual stock’s return is to be weighted.

There are a number of ways to weight individual returns, some more computationally convenient than others.  A comprehensive capitalization-weighted index will tell us the performance of the average investor, weighted by the amount of capital invested.  That is the key informational attribute that makes capitalization-weighted indices economically useful.  Note that this has nothing to do with index funds.  The S&P 500 launched in 1957, and its earliest cap-weighted predecessor in 1923, long before anyone thought of using indices as the basis for investment products.

Serendipitously, however, capitalization weighting turns out to have three characteristics that make it particularly attractive for index fund managers:

  • It is, in economists’ jargon, “macro-consistent.”  If they wanted, all investors in a market could each hold a cap-weighted index fund.  Doing so does not require an offsetting tilt from another investor.  (In contrast, e.g., if I want to tilt toward value, someone else has to tilt toward growth.)
  • Cap-weighted portfolios are relatively easy to maintain.  Unless the underlying index changes, a properly-constructed cap-weighted index fund is not required to transact.  Other weighting schemes (e.g., equal weighting or factor weighting) inherently require more turnover.
  • Sharpe’s famous “Arithmetic of Active Management” concludes that “after costs, the return on the average actively managed dollar will be less than the return on the average passively managed dollar.”  The average passively managed dollar, in this formulation, is capitalization weighted.  Sharpe’s analysis does not hold for any other weighting scheme.

None of these arguments imply that capitalization weighting is appropriate for all investors in all circumstances.  But its popularity is not arbitrary or inexplicable.  We live in a capitalization-weighted world, and cap-weighted index funds are a simple reflection of that reality.  The law of gravity does not require our consent for its efficacy.  Neither does capitalization weighting.

The posts on this blog are opinions, not advice. Please read our Disclaimers.

Rieger Report: Will Pressure on Property & Casualty Companies Impact the Bond Markets?

Contributor Image
J.R. Rieger

Former Head of Fixed Income Indices

S&P Dow Jones Indices

This Fall has been a difficult time for property & casualty companies.  The fires in Northern California have destroyed thousands of homes and the relentless string of hurricanes have damaged parts of Texas, Louisiana, Florida, Puerto Rico and the U.S. Virgin Islands.

If these companies need to sell fixed income assets to offset liabilities they could impact the U.S. municipal and corporate bond markets.  While both of these markets have seen high demand during 2017, a secondary market influx of bonds may be a catalyst that begins to push yields higher.

A quick look at data from the Federal Reserve shows the potential. With over $300billion of municipal bonds and over $400billion of corporate and foreign bonds held by these companies shows the pool of assets these companies could tap to offset liabilities is significant.

Munis: While it may appear the most vulnerable, the municipal bond market has had it’s supply / demand equilibrium out of kilter for some time due to low new issuance.  The open question would be can it handle a wave of potential selling?

Corporate bonds: Again, U.S. and foreign demand for USD corporate bonds remains strong. Untested all year, this asset class has not seen any real selling pressure to benchmark against.

Table 1) Select asset classes held by property & casualty companies:

Meanwhile, the S&P National AMT-Free Municipal Bond Index (Investment grade) has recorded a 4.89% total return this year and the S&P 500/MarketAxess Investment Grade Corporate Bond Index has returned 5.59% return year-to-date (October 13, 2017.)

The posts on this blog are opinions, not advice. Please read our Disclaimers.

The Growth of Dividend Investing and Driving Forces

Contributor Image
Liyu Zeng

Director, Global Research & Design

S&P Dow Jones Indices

Dividend investing is an ever popular topic across different markets.  Market participants have been using ETFs to implement various dividend strategies for more than a decade.  The first dividend ETF, the iShares Select Dividend, was launched in 2003.  Nevertheless, dividend ETPs have experienced tremendous growth in assets since year-end 2009.  As of June 30, 2017, the total assets of purely dividend screened or weighted ETPs reached USD 178.6 billion, with a compound annual growth rate of 35.5% since year-end 2009 (see Exhibit 1).

Despite rising AUM in the low/minimum volatility and multi-factor ETPs in the past two years, dividend ETPs have remained the leading category of strategic-beta ETPs by assets across many regions and countries.[1]  In the first three quarters of 2017, dividend ETPs dominated the inflows among various types of smart beta ETPs.[2]

The most cited growth driver for dividend investing is the global low-yield investment environment seen in recent years.  As shown in Exhibit 3, the growth of dividend ETPs’ assets since year-end 2009 coincided with a period of low and declining 10-year government bond yields in the U.S., eurozone, and Japan.

Another underlying and probably longer-term driver for the growth of dividend investing is the demographic change in high income regions, such as the U.S., European Union, and Japan (see Exhibit 4).  As more market participants move gradually from the consolidation to the decumulation stage of their investment lifecycles, dividend strategies can become an attractive investment option for providing stable cash flows.

Among various types of income ETPs listed in the U.S., high-dividend equity ETPs recorded the highest five-year absolute and risk-adjusted return as of Aug. 31, 2017, although they had lower yield than a few other income asset classes.  Compared to other equity income products, such as REITs and MLP ETPs, high-dividend equity ETPs tend to have less sector concentration risk and lower price volatility.  Despite the rate hikes since December 2015, U.S. interest rates remain low and high-yield ETPs, which offer yield premium, remain attractive to income-seeking market participants.

[1]   A Global Guide to Strategic-Beta Exchange-Traded Products (September 2016 and September 2017).  Morningstar Manager Research.

[2] Blackrock Global ETP Landscape September 2017 Report.

The posts on this blog are opinions, not advice. Please read our Disclaimers.

What the Earthquake Left Us

Contributor Image
Jaime Merino

Former Director, Asset Owners Channel

S&P Dow Jones Indices

It is interesting and amazing to see how people react to natural disasters.  Whether it be a hurricane, flood, tsunami, earthquake, and no matter where the disaster is located, the whole world takes notice and helps with anything they can.  This was certainly the case for Mexico after the 7.1 magnitude earthquake that shook the capital on Sept. 19, 2017 (12 days after an 8.2 earthquake in the country, and exactly 32 years later after the most significant and deadliest earthquake to hit Mexico City), where thousands of Mexicans took to the streets to help in some way.  Troops from around the world (Chile, China, Colombia, Costa Rica, Ecuador, El Salvador, Spain, Guatemala, Honduras, Israel, Japan, Panama, and the U.S., among others) collaborated in search and rescue efforts in the aftermath.  We, and I believe all Mexicans, are very grateful to the people that helped and are still helping—thanks so much to all of you.

But the most amazing part is that the generosity was not only that of the people, but companies from sectors like telecommunciations and transportation also helped for eight days by not charging fees for internet, telephone services, public transportation, and many toll roads, and this contributed to a 0.31% drop in year-over-year inflation for September 2017 after 14 consecutive months of increases.  Exhibit 1 shows the history of annual CPI over the past 10 years.

Exhibit 2 shows the performance of Mexican inflation-linked bond indices in different periods, and we can see how in the one-month window, the short-term end of the curve saw gains, while losses were observed in the middle and long term.

If you were wondering how inflation behaved after the 1985 earthquake, Exhibit 3 shows inflation from 1980-1990, where we can see that inflation rose for 15 consecutive months after the earthquake—but it’s difficult to make a conclusion based on that data, since during that time Mexico had severe hyperinflation problems.

Now that we have talked about natural disasters, there is an imminent “natural disaster” with the NAFTA negotiations.  Over the past 22 days (from the Sept.19, 2017, earthquake through Oct. 11, 2017, as the fourth round of negotiations begins) the Mexican peso depreciated 5.37% (almost MXN 1) against the U.S. dollar.  Exhibit 4 shows the performance of the UMS index series, and we can see how over the past month, the currency’s depreciation has helped in the performance of these indices, and in some cases it has evened out YTD losses.

The posts on this blog are opinions, not advice. Please read our Disclaimers.