Get Indexology® Blog updates via email.

In This List

Evolution of the Green Bond Market

How Now The Dow? A Q1 Retrospective.

SPIVA® India Year-End 2016 Scorecard: Underperformance of Active Funds Versus S&P BSE Benchmark Indices

Rising Interest Rates – Boon or Bane for Pan Asian Dividend Strategies?

Bridging the Volatility Gap between IG and HY

Evolution of the Green Bond Market

Contributor Image
Dennis Badlyans

Former Associate Director, Global Research & Design

S&P Dow Jones Indices

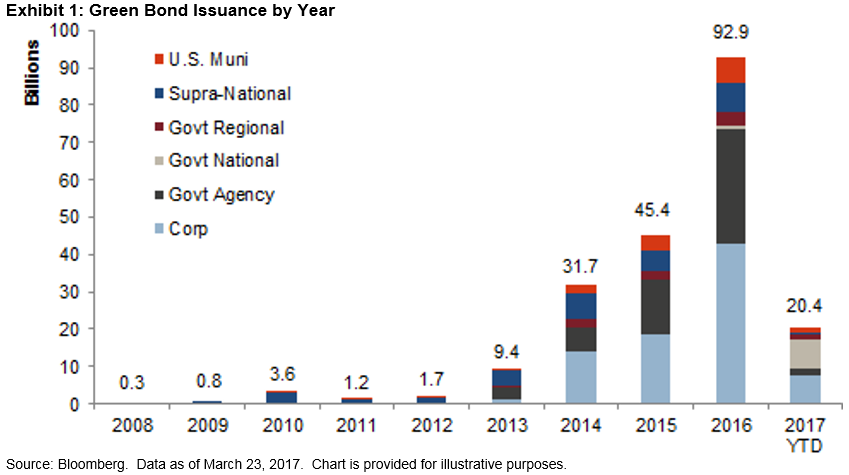
Over the recent weeks, there has been much debate about the notable increase of issuance in the fledgling green bond market.  Indeed, green bond issuance ramped up significantly in 2016, and the accelerated pace is expected to continue this year.  Total issuance of bonds labeled as green in 2016 amounted to USD 92.9 billion, nearly doubling the size of the green bond market from the previous year (see Exhibit 1).

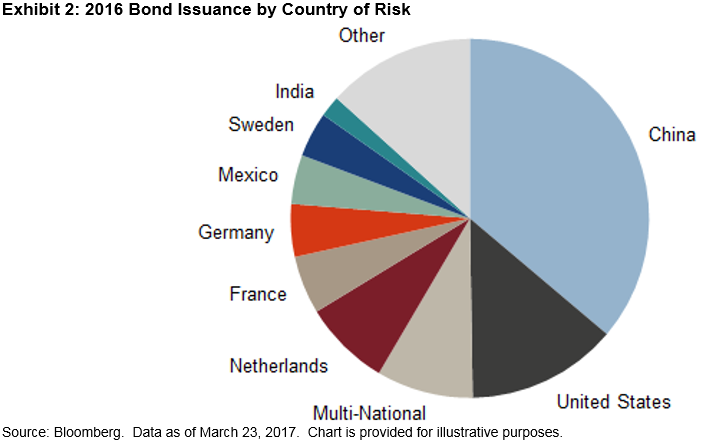
Chinese issuance accounted for the lion’s share of total issuance in 2016.  In October 2015, Agricultural Bank of China was the first Chinese entity to issue green bonds.  These three bonds were issued in the eurobond market, totaling about USD 1 billion.  In 2016, issuance by entities domiciled (country of risk) in China grew to USD 33.6 billion, or about 36% of the total supply for that year (see Exhibit 2).

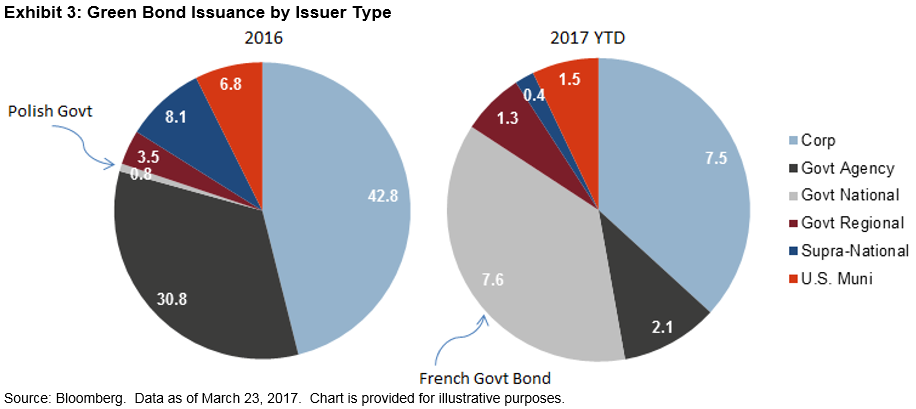
In 2016, the green bond market diversified by issuer type and country of domicile.  In addition to the introduction to the market of Chinese issuance in CNY and USD, government-related authorities in Costa Rica, Finland, and Mauritius issued the first green bonds in their respective countries, and the Republic of Poland issued the first National Treasury green bond.  The French National Treasury followed suit in January 2017, issuing USD 7.6 billion, the largest green bond issuance on record.  The inaugural green bond from Argentina (USD) was issued just a month ago by La Rioja Province.

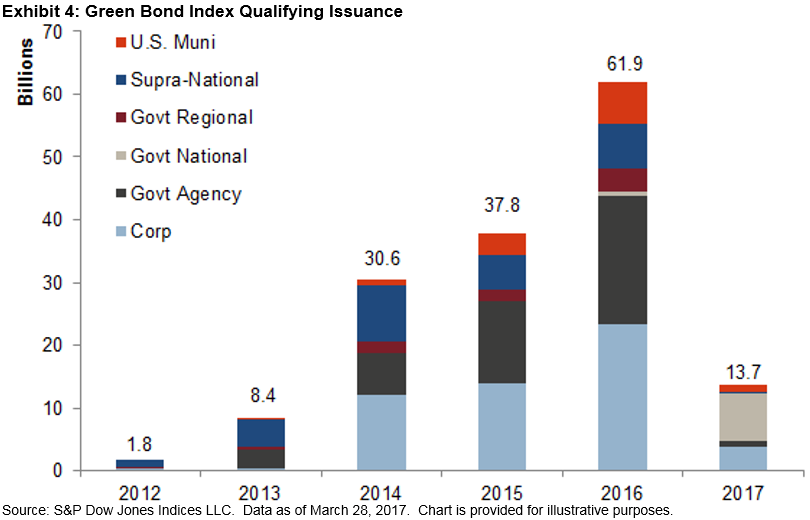
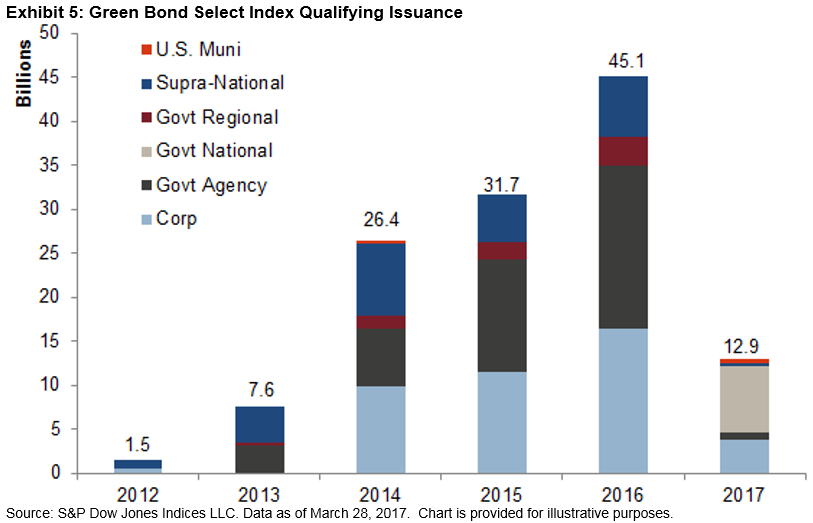
The S&P Green Bond Index is designed to track the green bond market and is composed of CBI-aligned green bonds that satisfy price availability requirements for our fixed income indices.  The S&P Green Bond Index has grown in tandem with the green bond market and covers about 75% of the issuance.  The S&P Green Bond Select Index is a subindex that is subject to additional selection criteria; it includes fewer than 200 of the 1,760 bonds in the S&P Green Bond Index, while covering more than 80% of the market value.

Market analysts expect issuance to continue to ramp up in 2017.  Climate Bond Initiative estimates that CBI-aligned green bond issuance (a subset of all green-labeled bonds) will increase to USD 150 billion for 2017, 85% more than the USD 81 billion of CBI-aligned green bonds issued in 2016.[1]

[1]   https://www.climatebonds.net/

The posts on this blog are opinions, not advice. Please read our Disclaimers.

How Now The Dow? A Q1 Retrospective.

Contributor Image
Jamie Farmer

Former Chief Commercial Officer

S&P Dow Jones Indices

With March in our rear view mirror, let’s take a quick look at some highlights from the Dow Jones Industrial Average’s performance during the first quarter of 2017:

  • In Short – The Dow Jones Industrial Average ended the first quarter of 2017 at 20,663.22 – up 900+ points for a 4.56% YTD return.
  • Biggest Themes – expectations of an economic revival, infrastructure spending, tax reform, deregulation and related themes drove the markets in the wake of the election and inauguration of Donald Trump.
  • Leader & Laggard – Apple (AAPL) made the biggest point contribution while Chevron (CVX) had the most negative impact.
  • Sector Performance – Information Technology, on the back of the aforementioned AAPL return, made the largest contribution.
  • Best Day YTD (In Points & Percent) – March 1st, after Trump’s address to Congress.
  • Worst Day YTD (In Points & Percent) March 21st, anxiety about Trump’s ability to be a change agent sets in.
  • Big Moves – or rather, the lack thereof. Q1 saw very few days of significant movement in the Average.  Further, the spread between the quarter’s High and Low closing index values is 1,383.15 points, the tightest spread since 2005.  Here again, we see the evidence of a period of muted volatility.
  • Advancement – The Dow hit 15 new highs during Q1 and broke through both the 20,000 and 21,000 point levels.

For more about the DJIA during Q1, a complete report card is available here.

The posts on this blog are opinions, not advice. Please read our Disclaimers.

SPIVA® India Year-End 2016 Scorecard: Underperformance of Active Funds Versus S&P BSE Benchmark Indices

Contributor Image
Akash Jain

Director, Global Research & Design

S&P BSE Indices

Various events during the second half of 2016, both global—such as the U.S. Federal Reserve rate hike and the U.S. elections—and domestic—such as passage of the GST bill in Parliament and demonetization—kept Indian markets volatile.  Over the one-year period ending December 2016, Indian equity markets underperformed Indian bond markets.  The S&P BSE 100, which seeks to measure the large-cap equity market in India, ended in the black, at 5.02%.  The mid-cap equity market, as measured by the S&P BSE MidCap, returned 9.28% over the same period.  The S&P BSE India Government Bond Index delivered a total return of 13.51%.

The S&P Indices Versus Active (SPIVA) India Scorecard, which is a biannual report, attempts to capture the performance of active funds (both equity and debt funds) domiciled in India against S&P BSE benchmarks over different time horizons.  The study reveals that over the one-year period ending December 2016, 66.29% of Indian Equity Large-Cap funds, 64.29% of Indian ELSS funds, and 71.11% of Indian Equity Mid-/Small-Cap funds underperformed their respective benchmark indices.  Additionally, the majority of the Indian Composite Bond funds underperformed the S&P BSE India Bond Index over 1-, 3-, 5-, and 10-year periods, whereas the majority of Indian Government Bond funds underperformed the S&P BSE India Government Bond Index over 3-, 5-, and 10-year periods (see Exhibit 1).

Exhibit 1: Funds that Underperformed the Benchmark

Source: S&P Dow Jones Indices LLC, Morningstar, and Association of Mutual Funds in India.  Data from December 2006 to December 2016, based on the SPIVA India Year-End 2016 Scorecard.  Past performance is no guarantee of future results.  Chart is provided for illustrative purposes and reflects hypothetical historical performance.

Over the five-year period ending December 2016, apart from Indian ELSS funds, none of the categories (across equity and debt) had a 100% survivorship rate.  Over the 10-year period, Indian Equity Large-Cap funds showed a survivorship rate of 66.7%, whereas Indian Equity Mid-/Small-Cap funds had a 65.1% survivorship rate.  Over the same period, the Indian Government Bond and Indian Composite Bond funds had even lower survivorship rates, at 51.7% and 58.7%, respectively.

Over the 10-year period, style consistency was fairly low for Indian Equity Large-Cap funds (30.6%) and Indian Equity Mid-/Small-Cap funds (28.6%).  This is particularly important because a market participant may want to understand not only whether a fund has survived the investment horizon but also the percentage of funds that stayed consistent to their initial investment categorization.  Globally, style classification is an important metric that can guide market participants in their asset allocation decisions.  On the other hand, Indian ELSS funds have largely been style consistent.  Not only have a large number of these funds managed to outperform the benchmark, but they have done so with a higher margin over the three- and five-year horizons than any other category, at 3.9% and 2.5%, respectively.

As Indian markets have matured, we have observed convergence to global mature markets in terms of outperformance of benchmark indices and fees.

To discover more about the performance of Indian active funds versus their benchmarks, check out the SPIVA India Year-End 2016 Scorecard.

Exhibit 2: Asset-Weighted Outperformance of Funds Versus Respective Benchmarks

Source: S&P Dow Jones Indices LLC, Morningstar, and Association of Mutual Funds in India.  Data from December 2006 to December 2016, based on the SPIVA India Year-End 2016 Scorecard.  Past performance is no guarantee of future results.  Chart is provided for illustrative purposes and reflects hypothetical historical performance.

Exhibit 3: Equal-Weighted Outperformance of Funds Versus Respective Benchmarks

Source: S&P Dow Jones Indices LLC, Morningstar, and Association of Mutual Funds in India.  Outperformance measured in INR.  Data from December 2006 to December 2016, based on SPIVA India Year-End 2016 Scorecard.  Data from December 2006 to December 2016, based on the SPIVA India Year-End 2016 Scorecard.  Past performance is no guarantee of future results.  Chart is provided for illustrative purposes and reflects hypothetical historical performance.

The posts on this blog are opinions, not advice. Please read our Disclaimers.

Rising Interest Rates – Boon or Bane for Pan Asian Dividend Strategies?

Contributor Image
Utkarsh Agrawal

Associate Director, Global Research & Design

S&P Dow Jones Indices

In December 2016, the U.S. Fed raised the interest rate for the second time in the current rate hike cycle.  Three more rate hikes were expected for this year, one of which took place in March.  In a low interest rate environment, companies that have increasing dividends or offer high dividend yields look attractive to income-seeking market participants.  But the yield offered by these companies may be considered less competitive in a rising interest rate environment.  Exhibit 1 shows how various S&P DJI Asian dividend and REIT indices have performed in U.S. interest rate cycles since 2004.

During the U.S. rate hike cycle that began June 30, 2004, and lasted until the first rate cut on Sept. 18, 2007, the three S&P Dow Jones Asian Dividend Indices examined, as well as the S&P Pan Asia REIT Index, significantly outperformed the Pan Asia equity benchmark, the S&P Pan Asia BMI, and the S&P U.S. Treasury Bond 7-10 Year Index (see Exhibit 1).  However, in the next rate cut cycle lasting from Sept. 18, 2007, to Dec. 17, 2015, the performance trend of these indices reversed, most likely due to the impact of the global financial crisis.  The returns of all three Asian dividend indices and the S&P Pan Asia REIT Index lagged the equity benchmark and the S&P U.S. Treasury Bond 7-10 Year Index.  The Dow Jones Asia/Pacific Select Dividend 30 Index even recorded negative returns in this rate cut cycle.

In the most recent rate hike cycle starting Dec. 17, 2015, the three Asian dividend indices and the S&P Pan Asia REIT index again delivered significant excess returns compared to the S&P Pan Asia BMI and the S&P U.S. Treasury Bond 7-10 Year Index.

Exhibit 2 shows the yield spread of various dividend indices versus the yield-to-maturity of the S&P U.S. Treasury Bond 7-10 Year Index since Dec. 17, 2015.  Apart from the S&P Pan Asia Dividend Aristocrats, both the Dow Jones Dividend Indices and the S&P Pan Asia REIT Index maintained yield spreads of more than 2% after three rate hikes.  The S&P Pan Asia REIT Index maintained the most stable yield spread throughout the period studied.

While market participants may expect interest rate hikes to negatively affect Asian high-yield stock performance, it is notable that their performance has been much more sensitive to economic cycles than to U.S. interest rate cycles over the past decade.  For the Dow Jones Asian Dividend Indices and the S&P Pan Asia REIT Index, it appears there is still a lot of room for rate hikes before their yield spread will vanish.

The posts on this blog are opinions, not advice. Please read our Disclaimers.

Bridging the Volatility Gap between IG and HY

Contributor Image
Hong Xie

Former Senior Director, Global Research & Design

S&P Dow Jones Indices

The goal of the S&P U.S. High Yield Low Volatility Corporate Bond Index is to construct a high-yield bond portfolio with low credit risk and low return volatility by applying a low volatility factor.  Does the index methodology truly deliver the effect of reducing volatility?  The back-tested results of the 17-year period ending Feb. 28, 2017, show that the S&P U.S. High Yield Low Volatility Corporate Bond Index may offer an intersection that bridges the volatility gap between the high-yield and investment-grade bond sectors, with increased return efficiency.

Exhibit 1 shows annualized volatility across the equity and fixed income sectors from Jan. 31, 2000, (the first value date of the index) to Feb. 28, 2017.  As expected, the S&P U.S. High Yield Low Volatility Corporate Bond Index sat between the high-yield and investment-grade bond sectors in the volatility spectrum.

Exhibit 2 illustrates the return/volatility trade-off among various sectors.  The fact that the S&P U.S. High Yield Low Volatility Corporate Bond Index is located above the straight line linking the investment-grade and high-yield bond sectors demonstrates that the index outperforms the return frontier established by the two bond sectors.  This increased return efficiency can also be seen from the S&P U.S. High Yield Low Volatility Corporate Bond Index’s higher ratio of return-to-volatility than that of the broad-based, high-yield index (see Exhibit 3).

The posts on this blog are opinions, not advice. Please read our Disclaimers.