Get Indexology® Blog updates via email.

In This List

High Yield Bonds in a Rising Rate Environment

Sustainable Investment space in India

Most Things Are Relative

S&P BSE SENSEX Performance during Budget Sessions over the Past Decade

Longer-Maturity and Lower-Rated Sukuk Continue to Outperform

High Yield Bonds in a Rising Rate Environment

Contributor Image
Hong Xie

Former Senior Director, Global Research & Design

S&P Dow Jones Indices

Since the “taper tantrum” back in 2013, the prospect of the Fed easing monetary policy has been one of the top concerns for global market participants.  The Fed has increased rates twice since then: once in December 2015 and again in 2016.  With more rate hikes expected and U.S. inflation firming up, long-term interest rates have risen from their low of July 2016 and the market is watchful for more potential increases.

In a rising rate environment, interest rate risk comes to the forefront, and this is particularly true for fixed income products because of their sensitivity to interest rates, as measured by the concept of duration.  In this blog, we show that among various sectors of U.S. fixed income, the high yield bond market not only has less duration, but also historically has exhibited less correlation with interest rates due to movement of credit spreads.

Exhibit 1 shows the duration comparison of U.S. fixed income sectors.  As of January 2017, the investment grade corporate bond index bears the highest duration of 6.9, while the two high yield indices have much shorter durations of approximately 4.2.

Duration measures bonds’ direct exposure to interest rates.  For spread products such as corporate bonds, their total return is also sensitive to changes in credit spread.  Empirically, corporate bonds’ total returns tend to be less sensitive to interest rates compared with what is indicated by their duration measure, due to the negative correlation between interest rate and credit spread changes.

In a rising rate environment, credit spreads tend to tighten, reflecting improved credit fundamentals in a growing economy.  The positive return due to credit spread tightening could cancel out part or all of the negative return from rising rates.  This can be seen in the historical correlation of the performance of U.S. fixed income sectors with the change in government bond yields (see Exhibit 2).

Both high yield indices demonstrated a positive correlation with rate changes, meaning that high yield bonds had positive returns when government bond yields rose.  In contrast, investment-grade corporate bonds showed a negative correlation with interest rates.  The positive correlation of high yield bonds was further corroborated by the negative correlation of credit spreads and interest rate changes, indicating that when government bond yields moved higher, credit spreads tightened.

While it is understandable that market participants are concerned about interest rate risk in a rising rate environment, it is interesting to note that the high yield bond sector stands out within the fixed income market with less rate sensitivity.  Historical data show that its return profile exhibited positive correlation with interest rate movement.

The posts on this blog are opinions, not advice. Please read our Disclaimers.

Sustainable Investment space in India

Contributor Image
Ved Malla

Associate Director, Client Coverage

S&P Dow Jones Indices

In India, S&P BSE Indices has two investible indices in the sustainable investment space—namely, the S&P BSE CARBONEX and S&P BSE GREENEX.

The S&P BSE CARBONEX seeks to track the performance of the companies in the S&P BSE 100, based on their commitment to mitigating risks arising from climate change in the long run. Index constituent weights are modified in accordance with the companies’ relative carbon performance, as measured by the level of their greenhouse gas emissions and carbon policies. S&P Dow Jones Indices has partnered with RobecoSAM, a global specialist in sustainability investing, to provide the carbon performance scores for Indian companies.

The S&P BSE CARBONEX was launched on Nov. 30, 2012.  Exhibit 1 depicts the historical performance of the index from the base date—Sept. 30, 2010, when the base value was 1,000.

Exhibit 1: S&P BSE CARBONEX Performance 

The S&P BSE GREENEX consists of the top 25 stocks in the S&P BSE 100 that adopt relatively better energy-efficient practices.  Greenhouse gas emission numbers are provided by Trucost Plc, which is a global specialist in providing environmental data.  S&P Dow Jones Indices recently acquired a controlling stake in Trucost Plc.

The S&P BSE GREENEX was launched on Feb. 22, 2012.  Exhibit 2 depicts the historical performance of the index from the base date—Oct. 1, 2008, when the base value was 1,000.

Exhibit 2: S&P BSE GREENEX Performance 

Green investment in India may be in a nascent stage, but it is evolving and expected to gain momentum in the coming years.  Many stakeholders, including the government, corporations, and market participants, have become environmentally conscious and are looking to integrate environmental aspects of businesses in their mainstream investment strategies.  Green investment will not only encourage companies to have environmentally friendly policies, but also help ensure that they remain relevant in the long run to potentially create value for all stakeholders.

The posts on this blog are opinions, not advice. Please read our Disclaimers.

Most Things Are Relative

Contributor Image
Fei Mei Chan

Former Director, Core Product Management

S&P Dow Jones Indices

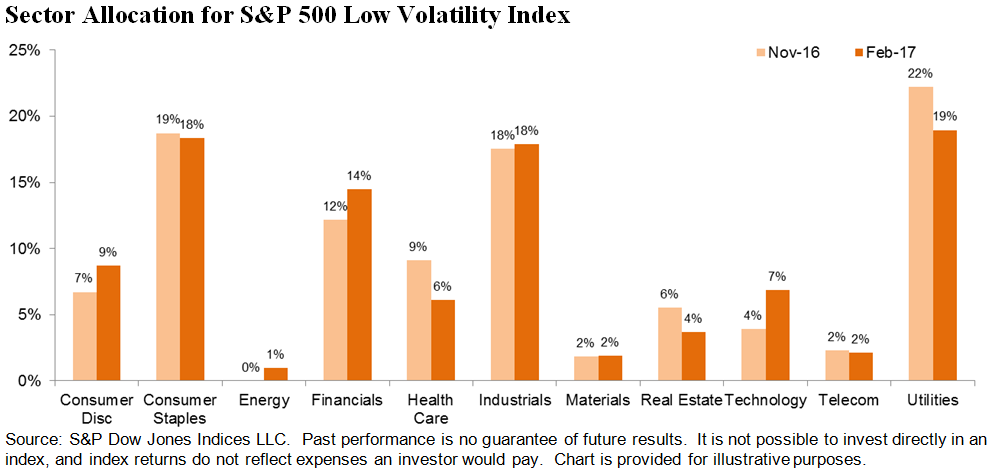
The S&P 500 Low Volatility Index measures the performance of the 100 least volatile stocks in the S&P 500. In its latest quarterly rebalance (effective at the market close on February 17, 2017), the index scaled back weightings in Utilities, Health Care and Real Estate while adding weight from the Technology, Financials and Consumer Discretionary sectors.

The 7% weight in Technology is still relatively small compared to, say, Utilities, Consumer Staples or Industrials, but it is amongst the highest ever for this sector in the history of our Low Volatility index. Typically Low Volatility holds little to no weight in Technology (see chart below).  Amongst the additions as of the latest rebalance are, notably, Alphabet and Oracle. So have technology stocks become significantly more stable recently?

Though the index methodology measures volatility at the stock level, the recent behavior of S&P 500 sectors provides some context.  Remarkably, the rolling 1-year volatility for all 11 sectors has declined compared to three months prior. The sectors that had the highest reduction in volatility were Energy, Materials and Technology.

Looking at volatility at the sectoral level isn’t the same as looking at volatility at the stock level. But using this rough gauge, it seems the reduction in the weighting of sectors like Utilities came about not because their volatility increased, but because the volatility of other sectors like Technology declined more.

The posts on this blog are opinions, not advice. Please read our Disclaimers.

S&P BSE SENSEX Performance during Budget Sessions over the Past Decade

Contributor Image
Ved Malla

Associate Director, Client Coverage

S&P Dow Jones Indices

The S&P BSE SENSEX acts as an indicator of the economic growth of the Indian economy.  Any national or international change in economic activity has an impact on the S&P BSE SENSEX.  In India, market participants are interested in knowing how movements in the S&P BSE SENSEX are related to various changes in economic activities.  Every year, the Finance Minister presents the Union Budget, which is perhaps the most important economic activity in India.  “Budget Day” comes with a lot of expectations, and it therefore has a bearing on the capital markets in both the pre- and post-budget sessions.  The days before and after the budget session can also bring volatility in the capital markets.

The S&P BSE SENSEX’s total return increased from 17,190 on Jan. 31, 2007, to 38,926 on Jan. 31, 2017 (see Exhibit 1).  This represents a 10-year CAGR of 8.52% for the period.

Exhibit 1: S&P BSE SENSEX Total Return Index

Source: S&P Dow Jones Indices LLC.  Data from Jan. 31, 2007, to Jan. 31, 2017.  Chart is provided for illustrative purposes.  Past performance is no guarantee of future results.

During the past decade, India has been led by the Indian National Congress and the Bhartiya Janta Party, the two largest national-level political parties in the country.  Mr. P. Chidambaram and Mr. Pranab Mukherjee were the Finance Ministers during the Congress regimes and presented the budgets from 2007 to 2013.  The Bhartiya Janta Party came to power in 2014, and Mr. Arun Jaitley has been the Finance Minister since then.

Exhibit 2 showcases the various budgets, along with which Finance Minister presented the budget and the 30-day pre- and post-budget returns of the S&P BSE SENSEX.

Exhibit 2: 30–day Pre and Post-Budget Day returns of the S&P BSE SENSEX

Source: S&P Dow Jones Indices LLC.  Data from January 2007 to February 2017.  Chart is provided for illustrative purposes.  Past performance is no guarantee of future results.

It can be seen in Exhibit 2 that in most years, the S&P BSE SENSEX witnessed high volatility in the 30-day pre- and post-budget sessions.  The S&P BSE SENSEX saw its lowest return during these sessions in 2008, when the index fell in both (with returns of -6.2% in the pre-budget session and -7.5% in the post-budget session).  The best post-budget performance was in 2016, when the index increased 11.8% in the 30 days following the budget day.  In 2010 and 2011, the pre-budget returns were negative (-7.5% and -6.1%, respectively), but the post-budget returns were positive (8.6% and 11.3%, respectively).  The S&P BSE SENSEX has had positive performance this year, with a return of 5.1% in the 30-day pre-budget session.

To conclude, we can say that the budget sessions are usually volatile for capital markets in India.  The pre-budget movement is caused by market participant expectations for the budget, while the post-budget movement is based on the actual budget presented by the Finance Minister.  The budget may be the most important economic activity affecting capital markets in India, and its relevance is captured in the movement of S&P BSE SENSEX.

The posts on this blog are opinions, not advice. Please read our Disclaimers.

Longer-Maturity and Lower-Rated Sukuk Continue to Outperform

Contributor Image
Michele Leung

Former Director, Fixed Income Indices

S&P Dow Jones Indices

The Dow Jones Sukuk Total Return Index (ex-Reinvestment), which seeks to track USD-denominated, investment-grade sukuk, had a great start in 2017 and rose 1.24% year-to-date (YTD) as of Feb. 10, 2017. A total of 19 sukuk with total outstanding par of USD 15.75 billion were added into the index last year; however, no new sukuk issuances are eligible for inclusion so far this year.

Longer-maturity sukuk continued to outperform among the maturities-based subindices YTD. The Dow Jones Sukuk 7-10 Year Total Return Index rose 2.16% YTD and 6.52% over the one-year period. Similarly, the Dow Jones Sukuk 5-7 Year Total Return Index gained 0.90% YTD and 5.70% over the one-year period. Looking into the historical total return performance, this trend has been consistent in the one-, three-, and five-year timeframes.

Among the ratings-based subindices, the bucket rated ‘BBB’ gained 1.62% YTD, followed by the ‘A’ category, which was up by 1.38% YTD. The biggest exposure in the Dow Jones Sukuk BBB Rated Total Return Index was Indonesia sovereign sukuk, which represents over 40% of the index. The Dow Jones Sukuk AAA Rated Total Return Index was the underperformer in the five-year period.

These performance trends coincided with the sukuk issuance in 2016. According to the Dow Jones Sukuk Total Return Index (ex-Reinvestment), all 19 sukuk added into the index with a tenor of at least five years, six have maturities of 10 years or longer.  In addition, 11 out of 19 are ‘BBB’-rated sukuk, while six have a rating of ‘A’ and only two have a rating of ‘AAA’.

Exhibit 1: Total Return Performance of the Dow Jones Sukuk Maturities-Based Subindices

Exhibit 2: Total Return Performance of the Dow Jones Sukuk Ratings-Based Subindices

The posts on this blog are opinions, not advice. Please read our Disclaimers.