Get Indexology® Blog updates via email.

In This List

Water and Financial Returns—Don’t Be Hung Out to Dry

Benchmarking Retirement Withdrawal Strategies

The Economy After the Elections

Winners and Losers in Trump’s Electoral Surprise

Why Consistency of Dividend Growth Matters

Water and Financial Returns—Don’t Be Hung Out to Dry

Contributor Image
Neil McIndoe

Head of Environmental Finance

Trucost

Recently, investment professionals have paid increasing attention to the impact of carbon-intensive businesses on financial returns.  Stricter regulation and increased certainty of higher carbon pricing have made this a mainstream concern.  S&P Global Ratings’ announcement of a green assessment of debt finance in September 2016 is one notable example of this trend.

Water scarcity, as a risk to business, may be less well understood, but it is arguably the nearer-term threat.  With a global population that has risen from 3 billion in 1960 to over 7.3 billion today, demand for fresh water is becoming greater than its practicable supply.  The likely result will be increasing costs.

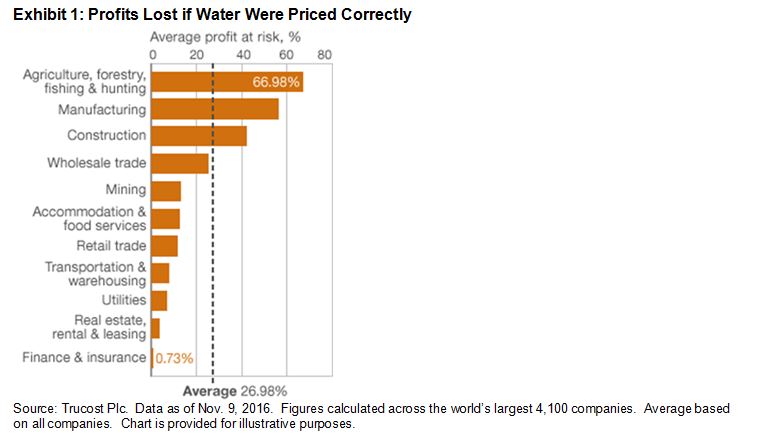
If water were priced to reflect this scarcity, Trucost’s analysis suggests that company profits would fall by nearly 27%, on average—with certain sectors significantly more exposed (see Exhibit 1).

capture

Some companies already understand the risks and are acting to address them.  The Spanish energy company Iberdrola carefully assesses its own use of water and that of its suppliers.  Iberdrola details all of its supply chain’s water-related risks from a likelihood, financial-impact, and geographic-location perspective.  Unfortunately, most companies do not pursue this level of risk management, so market participants may need to take the initiative to make sure they are not “hung out to dry,” so to speak.  That may mean encouraging the companies they invest in to measure and disclose relevant water risks.

A number of larger and more sophisticated market participants are already doing this.  A typical approach is to focus on certain sectors, identify material issues, and analyze company reporting on these risks, along with mitigation strategies.  Trucost recently completed such an exercise for 120 global utility companies.  The study found that the majority (approximately 55%) were not addressing water-related risks in a meaningful way.  Only 5% of the companies provided robust reporting on how water risks are managed within their operations and along their supply chain.  About 20% of the companies did have targets to reduce water consumption and usage intensity or increase water recycling.  However, many of the targets did not specify a base year or even  a target year.

For those market participants not yet looking at water risk, how should they begin to consider it alongside other risk management considerations?

The first step could be to create a water footprint of equity holdings to identify water-intensive companies, based on either  direct use or supply chains.  The second step would be to encourage these companies to report adequately on their water dependency and ability to manage associated risks.  Ceres, a U.S.-based coalition of market participants, has produced “Aqua Gauge,” which is a framework for assessing corporate management of water risk.

There is significant legislation already, such as the EU Water Directive, and much more is on the way that seeks to bring about adequate water pricing as an incentive for the sustainable use of water resources.  Market participants that consider water risk may encourage better company performance, better financial returns, and a better environment in which to enjoy them.

The posts on this blog are opinions, not advice. Please read our Disclaimers.

Benchmarking Retirement Withdrawal Strategies

Contributor Image
Philip Murphy

Former Managing Director, Global Head of Index Governance

S&P Dow Jones Indices

Capital market benchmarks are, of course, widely used yardsticks of investment performance. For the production of the S&P STRIDE Index, in addition to providing performance data we also calculate hypothetical retirement income for vintages of the index that are at, or past, their target date. Hypothetical retirement income is expressed in index points, and can be used as a yardstick for systematic withdrawal strategies – expanding the role of S&P STRIDE from wealth accumulation benchmark to decumulation benchmark.

Each January we determine the level of hypothetical retirement income for the upcoming year in every STRIDE Index whose target date is current or past. For example, in January 2015 we began calculating hypothetical retirement income for the S&P STRIDE 2015 Indices, and we continued updating it for the S&P STRIDE 2005 and 2010 Indices. Hypothetical retirement income is derived from the proportion of index value in the TIPS-LDI allocation for each target date by dividing that figure by then-current cost of income.

Below are 2015 values of hypothetical retirement income, called “Decumulation Points”, for the S&P STRIDE 2005, 2010, and 2015 Indices. These values are available on S&P STRIDE Index websites in the “Additional Info” menu. The file is called S&P STRIDE Metrics. The January 2015 Decumulation Rate is equal to [January Decumulation Points / January STRIDE Index Level].

STRIDE Vintage 2015 Monthly Decumulation Points January 2015 Decumulation Rate
2005 0.6453 5.64%
2010 0.6763 4.30%
2015 0.6818 3.46%

Source: S&P Dow Jones Indices, LLC

As explained in Waring and Siegel (2015), it is imperative to take the cost of income into account in development of systematic withdrawal policies. Doing so scales withdrawals for changes to income cost in addition to account value. However we could still be left with a lot of volatility in the periodic withdrawal a portfolio can support. To mitigate that volatility, a portfolio can be managed to offset changes in income cost with changes in account value (and vice versa) – exactly what S&P STRIDE does. For portfolio allocations pursuing strategies similar to STRIDE, our calculation of hypothetical retirement income therefore provides a sound basis for estimating how much can be withdrawn from that portfolio in a conservative, sustainable way.

The data in the above table can provide a useful comparison between one’s personal withdrawal strategy and the benchmark. For example, suppose I had $500,000 invested in TIPS at the end of January 2015. I’m pursuing an LDI strategy similar to S&P STRIDE, I retired in 2010, and I seek for my TIPS withdrawal strategy to last 25 years from retirement until 2035. In January 2015 I observe that the benchmark calculated a sustainable 2015 withdrawal rate of 4.3%. I can apply that percentage to my $500,000 TIPS-LDI portfolio to determine that the benchmark decumulation, when applied to my account, would be $21,500 for the year. Amounts greater than that may imperil the length of time my withdrawal strategy can last, and amounts less than that would potentially lengthen the time it can last. So S&P STRIDE can be used as a way to gauge sustainable withdrawals just as readily as it can be used to compare month-to-month investment performance.

The posts on this blog are opinions, not advice. Please read our Disclaimers.

The Economy After the Elections

Contributor Image
David Blitzer

Former Managing Director and Chairman of the Index Committee

S&P Dow Jones Indices

Right Now:  The economy is in better shape than what many incoming presidents face. GDP is growing, unemployment is 4.9% and inflation is about 1%. Interest rates are already rising with the 10 year treasury topping 2% yield and the Fed is signaling a December increase in the Fed funds rate.  US stocks are enjoying a turnaround in earnings and are responding positively.

What Next? The Press is comparing Donald Trump to Ronald Reagan. Both are Republicans from outside the party establishment, both plan big tax cuts and changes in economic policy.  Both are hailed as being in touch with voters. Reagan’s economic policy was tight money and increased federal spending. Combined with Paul Volcker’s inflation fighting at the Fed the economy emerged from a deep recession and grew. Stocks rose, interest rates fell as the bond market began a 30 year bull market.

Donald Trump’s approach to policy may be similar – he has said the Fed should raise rates and end its easy money approach; he wants to cut taxes and he speaks about a massive infrastructure spending program and increased defense spending

However, the economy today is not the economy of 1980. Inflation is about one percent today versus 13% on Election Day in 1980; yield on the ten year T-note is 2% now versus 12% in 1980; GDP was up 2.9% in the third quarter and the last recession ended seven years ago. In 1980 we were in a brief pause between two recessions and the one that lay ahead was second only to the Great Recession in severity.  There is at least one similarity: in 1980 and in 2016 there is a budget deficit which many people feared. Ronald Reagan promised to cut taxes, raise defense spending and balance the budget. He accomplished the first two – batting .667 may be a good score for a politician.

If Donald Trump follows a somewhat similar program, what might we expect?

  • Interest rates are likely to rise – both the Fed and the President seem to be looking in that direction. But the rate increase is likely to be limited and the ten year Treasury note, now about 2%, will probably be 4% or less 18 months from now.
  • Inflation should stay low. It has barely moved in a few years, expectations of future inflation, usually based on recent experience, are a key determinant of future inflation.
  • Tax cuts are likely – Republican Congresses rarely raise taxes, although taxes did rise during the Reagan years.
  • The stock market advance has further to go; it is supported by earnings, not politics, for the next six months.
  • We will see a large infrastructure program. Almost as attractive to Congress as cutting taxes.
  • The federal deficit will rise. Ronald Reagan preached supply side economics and the idea that cutting taxes would create so much growth that the budget would be balanced. It didn’t work then.

The posts on this blog are opinions, not advice. Please read our Disclaimers.

Winners and Losers in Trump’s Electoral Surprise

Contributor Image
Tim Edwards

Managing Director, Index Investment Strategy

S&P Dow Jones Indices

Donald Trump’s unexpected success initially threatened to send the U.S. equity markets into steep decline.  Yet as I write, the S&P 500 has moved very little since yesterday’s close (it is up a little), while the VIX has fallen dramatically.

So why (or how) has volatility remained so low this morning when everyone expected it to rise?  One reason may be that stock-level volatility has risen, but correlations have dramatically fallen.

A quick calculation using sector data suggests the higher dispersion in stock-level returns.  The chart shows the standard deviation among the 11 sectoral daily returns, So far today (as of 1pm EST) it is at the highest level this year.  There is volatility, but the winners are cancelling out the losers.

sp

Higher dispersion – which was already rising in advance of the election, means a greater difference between winners and losers.  Today’s increase in dispersion – which may well prove temporary – is an indication of the degree to which Trump’s presidential victory, and continued Republican control of the Senate, were not appreciated by yesterday’s market consensus.

The posts on this blog are opinions, not advice. Please read our Disclaimers.

Why Consistency of Dividend Growth Matters

Contributor Image
Kieran Kirwan

Director, Investment Strategy

ProShares

With anemic global economic growth, investors have become leery about U.S. companies’ ability to grow earnings and increase dividends.

Indeed, S&P 500 earnings declined for the fifth consecutive period in the second quarter of 2016 and even if the third quarter results are positive, the growth rate is likely to be very small. A potential consequence of this “earnings recession” is that future dividends could be at risk. Earnings are an essential driver of dividends, and ultimately returns, so there is good reason for concern.

But there’s an exclusive group of companies that may provide an answer. The S&P 500 Dividend Aristocrats® Index includes high quality companies that have increased their dividends every year for at least 25 consecutive years. How are these companies able to continually grow dividends? One answer is by delivering earnings growth. The S&P 500 Dividend Aristocrats have delivered positive annual earnings growth for the first two quarters of 2016 in amounts that were substantially higher than the broad market.

capture

Source: Morningstar, ProShares, May 2, 2005–June 30, 2016. Index performance is for illustrative purposes only and does not reflect any management fees, transaction costs or expenses. Indexes are unmanaged and one cannot invest in an index. Past performance does not guarantee future results.

The Take Away
Historically, the Dividend Aristocrats have grown their dividends on a more consistent basis and at a higher compound rate than the broad market, underscoring their quality and potential for strong performance. Since inception of the index, the Aristocrats have delivered higher returns with lower volatility than the S&P 500.

The posts on this blog are opinions, not advice. Please read our Disclaimers.