In my last post, I discussed variability in cost and affordability of retirement income. I used some data from S&P STRIDE, our new benchmark that provides a cradle-to-grave yardstick for wealth accumulation and income generation. This week, I will look a little closer at how we measure retirement income, as well as its present value or cost. To begin with, defined contribution retirement plan participants and IRA investors must convert their accumulated savings into an income stream when they enter retirement. Things may be simpler for people with defined-benefit pensions that pay out monthly benefits according to the plan’s vesting schedule and benefit formula. However, even though defined benefits are expressed as monthly income, they have a present value, which is simply the stream of their expected future cash flows expressed as a discounted lump sum.
If you were to ask people of my parent’s generation, “What is your net worth?” they probably would not count the present value of their pension benefits. They may view it as part of their personal income statement but not their balance sheet. However, if you asked people in my generation the same question, I bet they would include the value of their 401(k). They are thinking of it as a balance sheet item, but many have not yet considered that it needs to become an income statement item upon retirement.
When considering the convertibility of lump sums into income streams and vice versa, it may help to think about how the bond market works. When you buy a bond, you convert a given amount of liquid funds into future cash flows, and when you sell a bond, you convert future cash flows into readily available capital. As we know, bond prices vary with interest rates, and the same applies to future retirement income. The bond market analogy is relevant because at S&P DJI, we calculate the value of retirement income exactly like the value of a bond. However, we define a special “bond” called the generalized retirement income liability (GRIL) as a particular set of cash flows. Specifically, GRIL is defined as USD 1 per year of inflation-adjusted income starting at age 65 and continuing for 25 years. We discount GRIL’s cash flows using the U.S. Treasury Inflation-Protected Securities (TIPS) yield curve. This results in a transparent, precise method for evaluating the cost of future inflation-adjusted (real) income. We calculate the present value of GRIL for various starting points, each corresponding to specific target years within the S&P STRIDE Indices. Currently, they range from 2005 to 2060. For example, if you plan to retire around 2035, you can find the cost of retirement income as we calculate it on our website under the “additional info” menu. Exhibit 1 shows the cost of 2035 GRIL since January 2016:
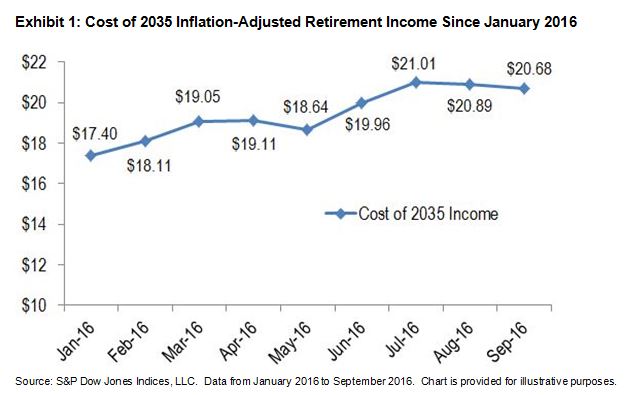
What does Exhibit 1 tell us? GRIL is 25 US dollars of inflation-adjusted retirement income spread over 25 years—USD 1 per year. To buy that income stream at the end of January 2016 would have cost USD 17.40, but as of September 2016, its cost increased to USD 20.68. Therefore if you held $1 million in US T-Bills (potentially the safest investment one can find, from the perspective of investment volatility), in January 2016, you could have acquired $57,471 of today’s US dollars per year starting in 2035 and lasting until 2060. The calculation is USD 1 million / USD 17.40. However, because real interest rates trended down since the start of the year, increasing the cost of income, as of September 2016 that same $1 million T-Bill portfolio would only have bought $48,356 of future income (USD 1 million / USD 20.68). When viewed through the lens of income affordability, it is therefore clear that investing in T-Bills and other short-term obligations is not risk free.
The posts on this blog are opinions, not advice. Please read our Disclaimers.