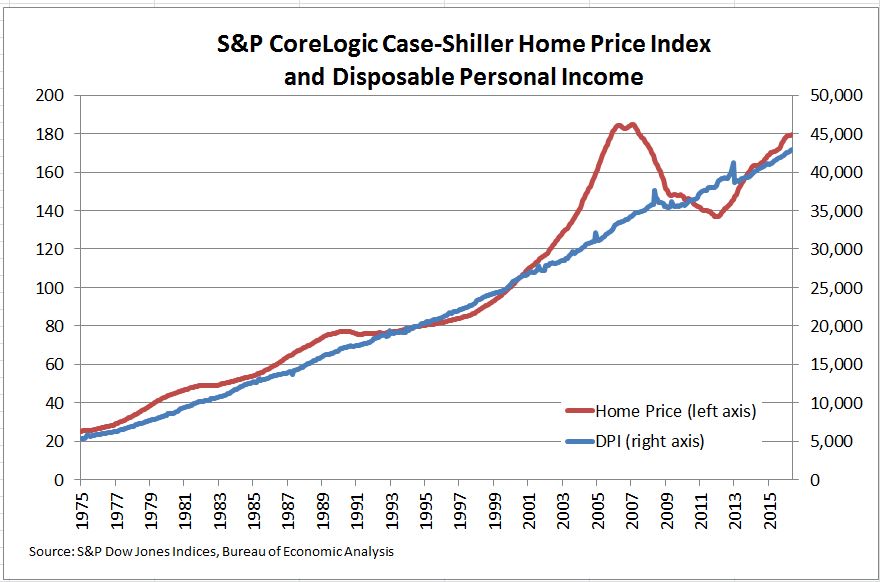
This morning’s S&P CoreLogic Case-Shiller Home Price Indices report showed prices rising at about a 5% annual rate over the last 12 months. Across the country the pattern varies with strong price gains in the Pacific Northwest and small price increases in New York and Washington DC. The press release and data are available at LINK.
One factor in rising home prices is rising incomes as seen from the chart of the S&P CoreLogic Case-Shiller National Index and Disposable Personal Income per capita. Currently home prices appear to be running ahead of income.
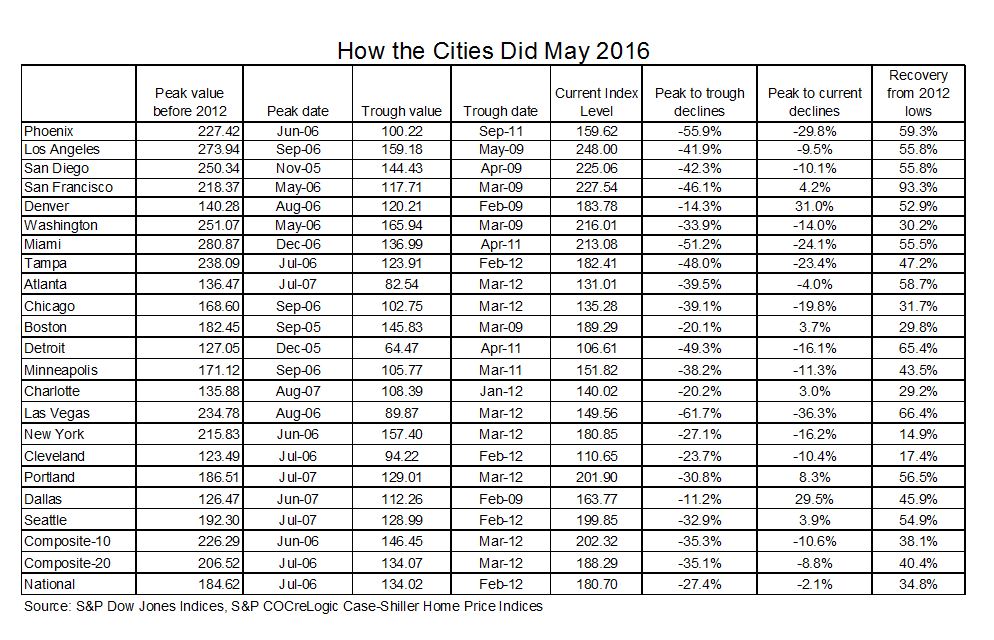
The table shows the peaks and troughs, index levels and changes for the 20 cities and composite indices.
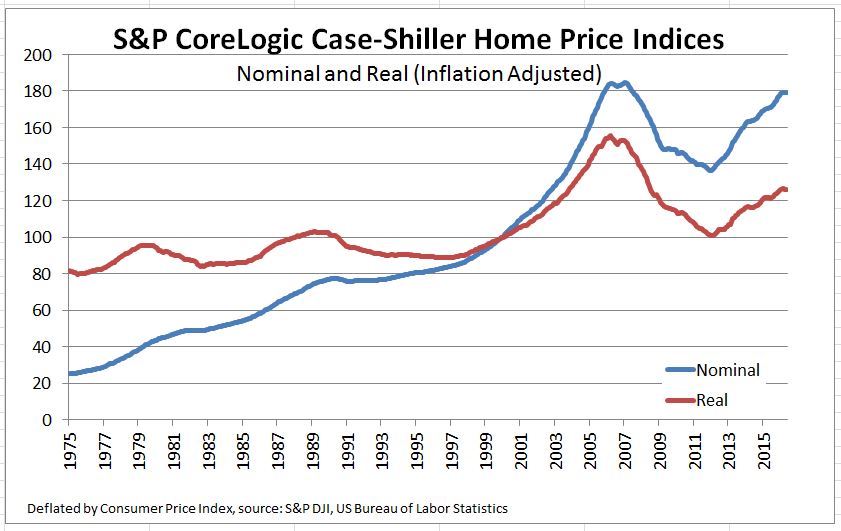
Part of the price increases in home is inflation. This chart shows the National Index and compares it to the inflation-adjusted version of the National Index. The inflation adjustment is based on the Consumer Price Index,

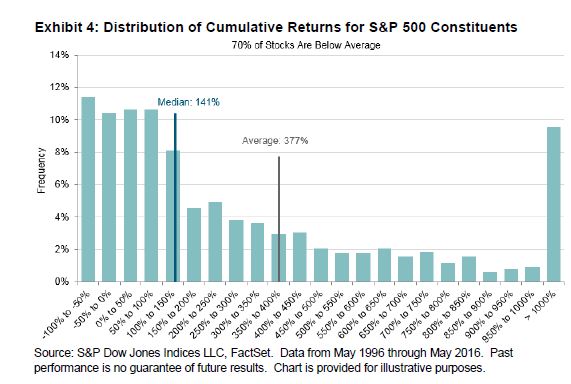
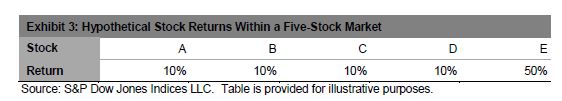 We can form portfolios of various sizes from these five stocks. There are five possible one-stock portfolios, four of which underperform the market as a whole. Alternatively, there are also five possible four-stock portfolios, four of which outperform the market as a whole. The expected return of the complete set of one-stock and four-stock portfolios is the same 18%, but the distribution of portfolio returns is different. In this case, holding more stocks increases the likelihood of outperformance.