In case you have had your head down focusing on other things, and not taken a moment to look at what spreads have been doing, the following chart will provide you with a snapshot as of February 23, 2016. Key takeaways include:
- Looking at commodities, Oil, as measured by WTI futures contracts, has bounced from a low of $28 to a current price of $31; the Energy sector is a whopping 119 bps wider year-to-date and the Materials sector is 49 bps wider.
- Telecommunications moved 41 bps wider due to the valuation of companies such as Verizon, AT&T and Qwest. Smaller rivals competing for sales have been a concern.
- Consumer Discretionary has widened as spending has slowed possibly due to the winter season and consumers holding back until the economy shows more of a positive direction.
Chart 1: Year-To-Date Change in Option Adjusted Spreads of the S&P 500 Bond Index
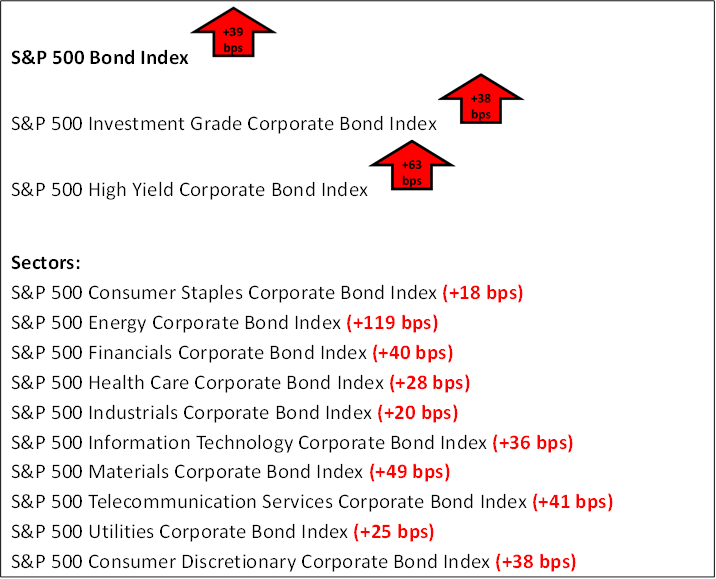
Source: S&P Dow Jones Indices LLC., Data as of Feb. 23, 206. Past performance is no guarantee of future results. Chart is provided for illustrative purposes.
The posts on this blog are opinions, not advice. Please read our Disclaimers.