Get Indexology® Blog updates via email.

In This List

Did Apple Weigh Down Your ETF?

Asia Fixed Income: Record Supply of Chinese Muni Bonds

Navigating Rising Rates: Municipal Bond Ladders

China and Memories of 1987

ETFs and Hedge Funds: At What Price Performance?

Did Apple Weigh Down Your ETF?

Contributor Image
Todd Rosenbluth

Director of ETF and Mutual Fund Research

S&P Capital IQ Equity Research

Despite posting second quarter 44% earnings growth, Apple declined 4.3% on Wednesday July 22. According to S&P Capital IQ, 33% sales growth was more modest than expected and the company’s third-quarter revenue guidance was below Capital IQ consensus. Further, iPhone and iPad shipments were weaker than expected. As the largest company in the U.S., with a market cap of approximately $720 billion, Apple was a recent top-10 holding in 98 largely index based ETFs.

At the end of June 2015, Apple was a 4% weighting in the S&P 500 Index, nearly equal the size of Microsoft and Exxon Mobil, the two next largest constituents.

But Apple’s weighting was nearly five times as large in the market-cap weighted S&P 500 Information Technology Index and other leading technology indices that are tracked by some ETFs. Not surprisingly, those indices were dragged lower by Apple on Wednesday.

For investors that want to track more diversified technology index, an equal-weighted approach is worthy of consideration. The S&P 500 Equal Weight Technology Index is one of them. It consists of all the technology stocks in the S&P 500 in largely equal proportion regardless of market cap and rebalances quarterly. This means that Electronic Arts was recently a larger position at 1.8% than Apple 1.6%, despite having a market cap of just $23 billion or less than 5% of Apple.

Of course equal weighting approaches work both ways, and investors in such ETFs can miss out on gains achieved by some of the largest companies. For example, the two Google share classes (GOOG) and (GOOG) comprised 10% of the S&P 500 Information Technology sector.

Google jumped sharply last week after reporting stronger the expected results. Second quarter non-GAAP EPS was $6.99, up 15% from a year earlier and $0.31 above the S&P Capital IQ estimate. In contrast, Google is a similarly small 2% weighting in the S&P 500 Equal Weight Technology index.

A version of this article originally was published on MarketScope Advisor.

Please follow me @ToddSPCAPIQ to keep up with the latest ETF Trends.

—————————————————————————————————–

S&P Capital IQ operates independently from S&P Dow Jones Indices.
The views and opinions of any contributor not an employee of S&P Dow Jones Indices are his/her own and do not necessarily represent the views or opinions of S&P Dow Jones Indices or any of its affiliates.  Information from third party contributors is presented as provided and has not been edited.  S&P Dow Jones Indices LLC and its affiliates make no representations or warranties of any kind, express or implied, regarding the completeness, accuracy, reliability, suitability or availability of such information, including any products and services described herein, for any purpose.

The posts on this blog are opinions, not advice. Please read our Disclaimers.

Asia Fixed Income: Record Supply of Chinese Muni Bonds

Contributor Image
Michele Leung

Former Director, Fixed Income Indices

S&P Dow Jones Indices

The Chinese Ministry of Finance (MoF) recently rolled out another muni replacement program of legacy local government debt, as the previous muni replacement quota of RMB 1 trillion only addresses about half of the local government debt that is due to expire in 2015. With the robust expansion plan, it is expected that the total supply of muni bonds will reach over RMB 2.77 trillion this year1.

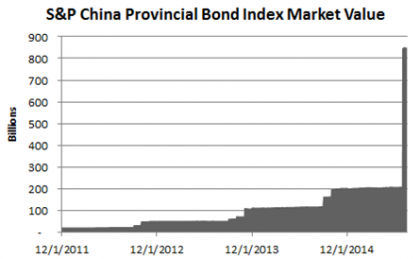
In fact, since Jiangsu’s debut issuance on May 18, 2015, the municipal bond market that is tracked by the S&P China Provincial Bond Index has expanded rapidly. In the June 2015 index rebalancing, the total number of muni bonds surged from 47 to 138, while the total par amount increased four times to CNY 847 billion (see Exhibit 1).

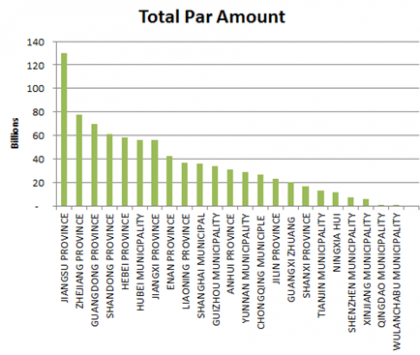
According to the S&P China Provincial Bond Index, the Jiangsu Province has the highest outstanding debt, at CNY 129 trillion, and it represents 15% of the index exposure, followed by the Zhejiang and Guangdong provinces (see Exhibit 2 for the provincial breakdown).

Of note, the new Chinese muni bonds were priced tight at issuance and they continue to trade at tight credit spreads above the sovereign bond yields. As of July 21, 2015, the yield-to-worst of the S&P China Provincial Bond Index was 3.49% (with a modified duration of 5.19), whereas the yield-to-worst of the S&P China Sovereign Bond Index was 3.15% (with a modified duration of 5.60).

Exhibit 1: Market Value tracked by the S&P China Provincial Bond Index

Source: S&P Dow Jones Indices LLC. Data as of July 21, 2015. Past performance is no guarantee of future results. Chart is provided for illustrative purposes and reflects hypothetical historical performance. Please see the Performance Disclosures at the end of this document for more information regarding the inherent limitations associated with back-tested performance.

Exhibit 2: Total Par Amount by Provincial Breakdown

Source: S&P Dow Jones Indices LLC. Data as of July 21, 2015. Chart is provided for illustrative purposes.


1 Source: HBSC Global Research

The posts on this blog are opinions, not advice. Please read our Disclaimers.

Navigating Rising Rates: Municipal Bond Ladders

Contributor Image
Matt Tucker

Head of iShares Americas Fixed Income Strategy

BlackRock

With rising rates potentially on the horizon, protecting the value of bond portfolios is top of mind for many investors. Holding bonds to maturity via a bond ladder can be considered a way to navigate these volatile investing waters.

Why Ladder?
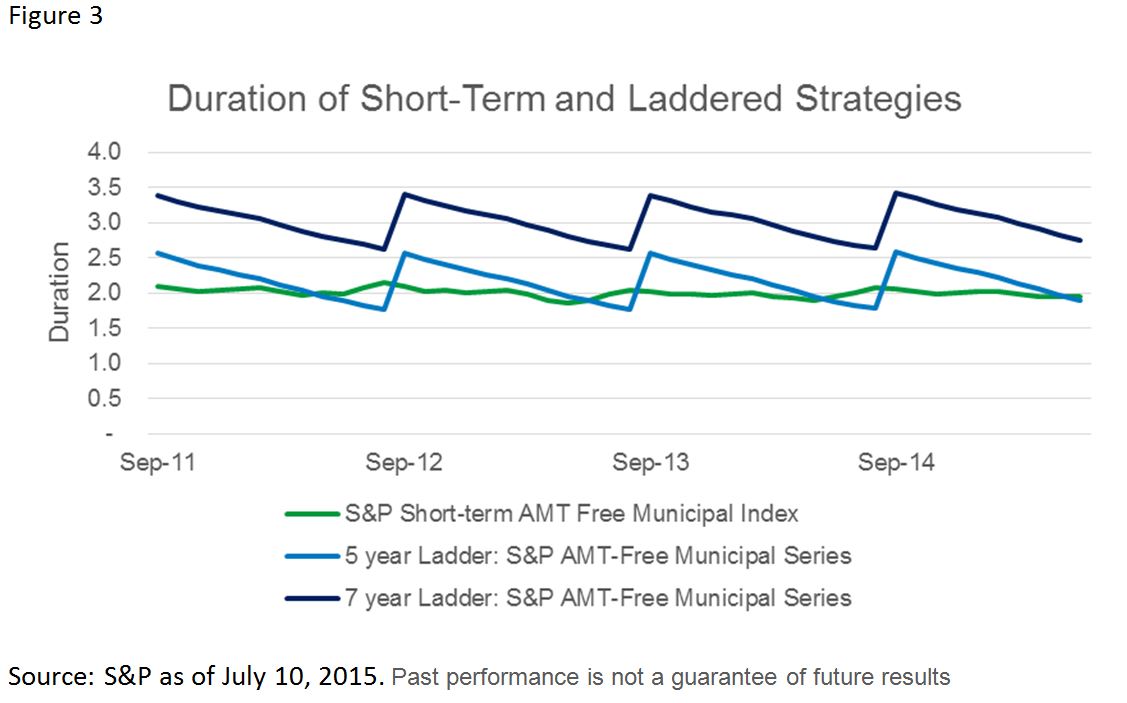
In a typical ladder, an investor would invest an equal amount of money into a series of bonds, with each bond maturing in a different year.  When one bond matures, the proceeds can be used to purchase a new long maturity bond, or can be used for some other purpose. As each bond approaches maturity the duration, or interest rate sensitivity, of the bond portfolio declines. When a bond matures and a new longer maturity bond is purchased, the duration lengthens again. Investors effectively lock in yields on bonds when they purchase them, and take some of the guesswork out of bond investing. Also, a ladder gives an investor the flexibility of taking the proceeds from maturing bonds and using them for some other purpose.

Performance Comparison
How has building a bond ladder compared to investing in a short-term municipal bond strategy?

Let’s say an investor was considering three options: creating a five-year ladder, creating a seven-year ladder, or investing in a short-term municipal bond fund. For each of these investment options the investor is considering only non-callable, investment grade bonds. The performance of S&P AMT-Free Municipal indices can be used to measure how different segments of the muni market have performed over time; through them we can measure the historical performance of the three options. For our performance period we will look at September 2011 to June 2015. The S&P AMT-Free Municipal Series Indices include bonds that mature in each calendar year of the index name, and are available in maturities ranging from 2012 to 2023. A five-year ladder can be constructed using Municipal Series Indices that mature between 2012 and 2019. A seven-year ladder can be constructed using Municipal Series Indices that mature between 2012 and 2021. This analysis assumes that the investor is rolling the proceeds of each maturing index into a new longest rung on the ladder.

Capture

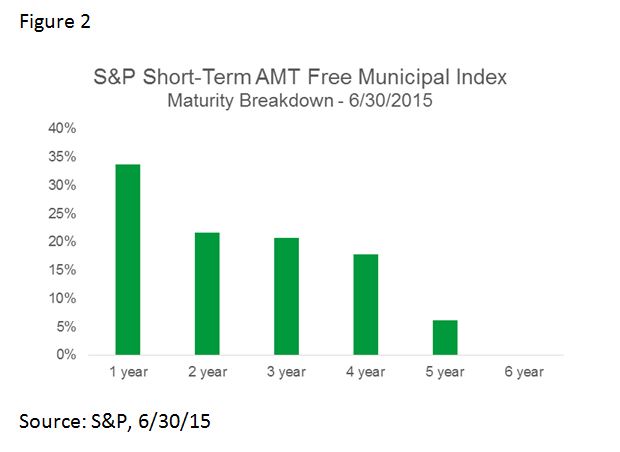
The performance of these ladder portfolios can be compared to the S&P Short-Term National AMT-Free Municipal Bond Index, which holds bonds from 0-5 years to maturity and rebalances monthly. The Short-Term index can be a good proxy for a short-term muni strategy that does not mature like a ladder.  The index is market cap weighted, and does not hold an equal weighted amount in each maturity year like the laddered solutions do.

Capture

The duration of the laddered strategies rolls down and then increases when an index matures and the proceeds are reinvested in the next rung. This is in contrast to the Short-Term index whose duration is more stable through time.

Capture

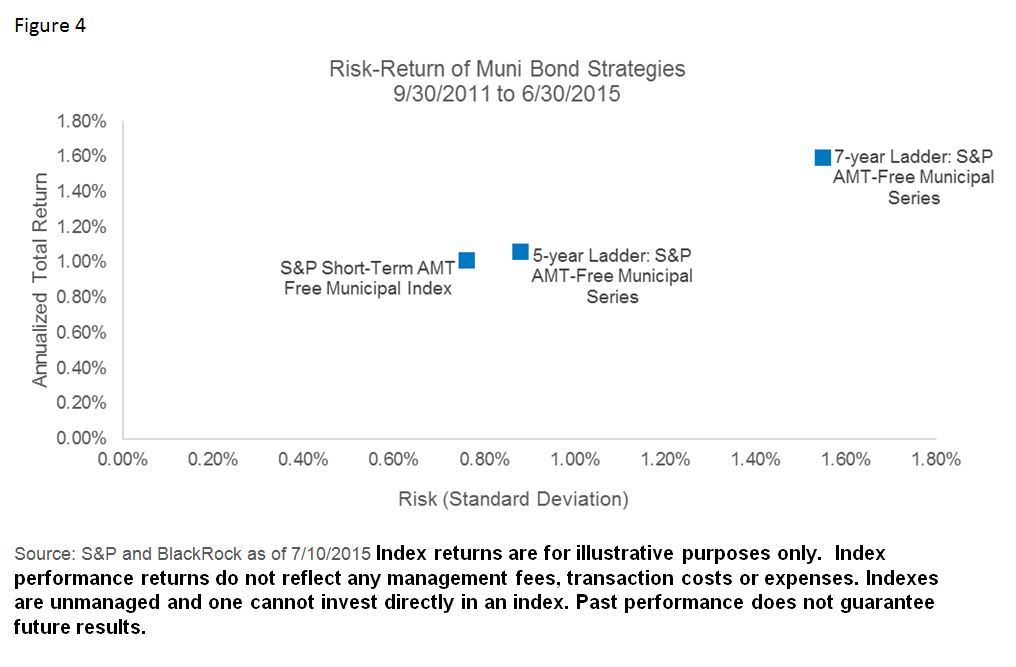
The performance of the 5-year ladder and the short-term index were similar. Note that the 5-year ladder had slightly higher return and volatility due to having an average duration that was slightly higher. Overall the duration differences between the three different portfolios was the largest driver of their performance differences.

Capture

Laddering a bond portfolio can provide investors with the flexibility to navigate the next round of rate hikes, while still helping meet their investment objectives. A laddering strategy can also provide more control over the portfolio, as an investor has an opportunity each year to reduce the size of the investor’s bond investment.  A short-term municipal bond strategy has provided a similar risk and return experience to the ladder options, and might be appropriate if the investor does not want to manage the maintenance of a ladder, or does not need the option of withdrawing proceeds from the investment on a regular basis.

—————————————————————————————————————-

The strategies discussed are strictly for illustrative and educational purposes and should not be construed as a recommendation to purchase or sell, or an offer to sell or a solicitation of an offer to buy any security. There is no guarantee that any strategies discussed will be effective.
Fixed income risks include interest-rate and credit risk. Typically, when interest rates rise, there is a corresponding decline in bond values. Credit risk refers to the possibility that the bond issuer will not be able to make principal and interest payments. There may be less information on the financial condition of municipal issuers than for public corporations. The market for municipal bonds may be less liquid than for taxable bonds. Some investors may be subject to federal or state income taxes or the Alternative Minimum Tax (AMT). Capital gains distributions, if any, are taxable.
iSHARES and BLACKROCK are registered trademarks of BlackRock, Inc., or its subsidiaries. All other marks are the property of their respective owners. iS-16101-0715


The posts on this blog are opinions, not advice. Please read our Disclaimers.

China and Memories of 1987

Contributor Image
David Blitzer

Former Managing Director and Chairman of the Index Committee

S&P Dow Jones Indices

China’s actions in recent days to shore up its market are reminiscent of actions taken in the US after the 1987 stock market crash. Changes in monetary policy, support for margin calls and stock buybacks were all tried in 1987.  At the same time, some other steps taken in China currently – restricting short selling and halting stocks – were avoided.

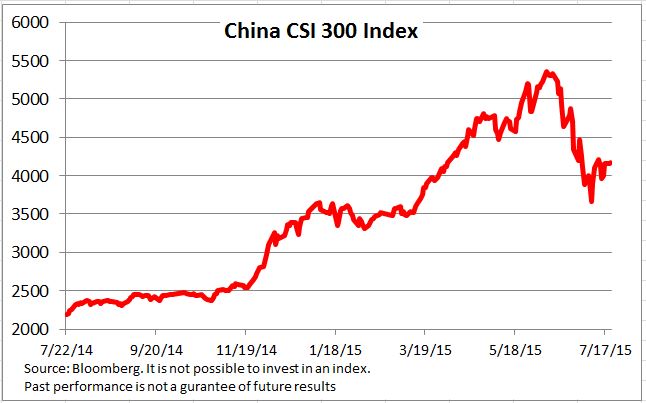
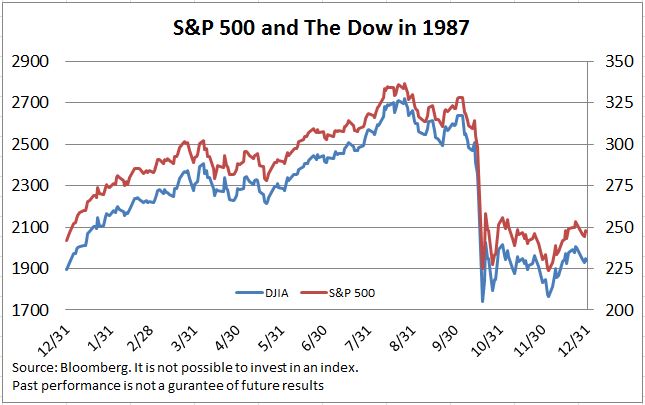
The charts give show the run-ups and subsequent drops in both markets.  The first chart shows the CSI 300, the principal large cap index in China over the 12 months ended with July 21, 2015. Its run up from a year ago to its June 8th peak is 90%; its subsequent drop is 22%, almost the same as fall in The Dow® on October 19, 1987. Of course, we don’t know whether China’s market has found a bottom yet.  The second chart shows the S&P 500® and The Dow for the full year 1987.

1987-1


China’s central bank cut rates to support the market. The day after the 1987 crash the US Fed announced, “The Federal Reserve, consistent with its responsibilities as the Nation’s central bank, affirmed today its readiness to serve as a source of liquidity to support the economic and financial system.”  Sounds a bit like recent news from China.  The Fed followed its statement with reductions in the Fed funds rate and an overall move to easier money despite worries about the dollar and inflation at that time.  Commentators have noted China’s support for margin lending by providing funds. In 1987 the Fed banks in New York and Chicago stepped in and encouraged major banks to extend additional credit to investors facing margin calls.   In China pensions funds are being encouraged to increase their stock purchases.   While the extent of additional pension fund activity in 1987 isn’t known, stock buy backs by major corporations in the S&P 500 doubled from the pace experienced in January through September 1987.

Other Chinese initiatives do not mirror 1987 efforts in the US.  China has restricted short selling, halted trading in many stocks and prohibited IPOs.  The IPO action may not matter much since companies might not choose to do an IPO in the midst of market turmoil.  Restricting short sales appears to remove a key source of downward pressure in a market. However, without access to shorting, hedging is much more difficult; restricting short sales can actually be a deterrent to purchasers.  When investing in the BRIC (Brazil, Russia, India and China) countries first became popular,  S&P DJI introduced an unusual BRIC index which only includes stocks listed and traded in New York, London or Hong Kong – three markets where shorting is permitted.  This index’s success demonstrated the importance of access to short selling.

Halting stocks may be another attractive way to break a market’s fall. The US introduced circuit breakers – mandatory market time outs if major indices fall too far and too fast – after the 1987 crash. The challenge for either circuit breakers or wide-spread trading halts is how to restart the market.  As long as there is no trading, prices don’t fall. But, investors’ estimates of what the prices should be may still collapse, setting the stage for further declines when trading resumes.

The posts on this blog are opinions, not advice. Please read our Disclaimers.

ETFs and Hedge Funds: At What Price Performance?

Contributor Image
Tim Edwards

Managing Director, Index Investment Strategy

S&P Dow Jones Indices

With the final numbers for the second quarter of 2015 now available, the research firm ETFGI today brought some long-anticipated news: the size of the exchange traded funds market has finally exceeded that of its older, more well-to-do cousins.  It may have taken a little longer than we expected, but ETFs are now a bigger part of the market than hedge funds.

In order to explain why hedge funds might be losing out in the race for assets, we thought we would re-examine the challenge of replicating hedge fund performance.  When it comes to individual hedge funds, which are typically unconstrained by assets, leverage or geography, replication is a difficult objective.  When it comes to a broad hedge fund portfolio, replicating performance is easier than you might think.

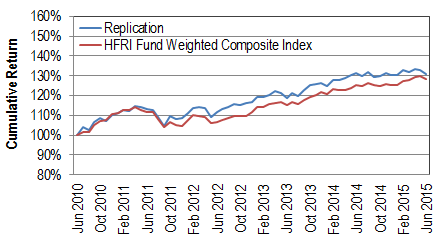
To begin the replication process, our “hedge fund” is going to invest half its money in U.S. bonds, and the remainder in global equities.  (We’ll use the S&P U.S. Aggregate Bond index to represent the first portion and the S&P Global 1200 for the second.)  Assuming we also rebalanced on a monthly basis, here’s how our hedge fund would have performed over the past five years.  For purposes of comparison, we also show research firm HFR’s benchmark of hedge fund performance.  The HFR Fund-Weighted Composite Index includes funds which are no longer open to new investors, so it is a fair representation of what only the largest and best-connected asset owners may have available to choose from:

Graph 1

                    Sources: S&P Dow Jones Indices, HFR as of 30th June, 2015.

The pattern of returns seems similar, which is encouraging.  And our decision to allocate to equities and bonds in equal proportions means that the overall return from our replication strategy is much higher.  Well done us!

But congratulations are premature.  Our replication strategy does not include costs, or fees.  The replication costs of broad-based, passive indices are de minimis, but we should not undervalue our unique insights (we are replicating a hedge fund, after all).  A fee of 1.50% per annum seems reasonable, and we’ll take 15% of any profits (provided we’re at least breaking even over the past 12 months). Here’s how our performance looks now:

Pic2

                    Sources: S&P Dow Jones Indices, HFR as of 30th June, 2015.

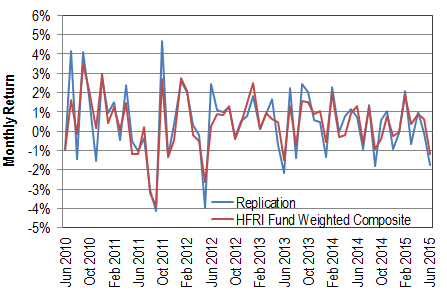
That’s more like it; our replication strategy now performs very similarly to the average hedge fund.  And when it comes to the pattern of returns, are we replicating the hair-trigger market-timing and monthly swings of the masters of the universe? Yes, we are:

Pic3

                    Sources: S&P Dow Jones Indices, HFR as of 30th June, 2015.

One conclusion to draw is that perhaps there is a market for a product offering a 50/50 split of U.S. bonds and global large-cap equities, at a highly remunerative cost structure.  The other conclusion, perhaps shared by those whose continued flight to low-cost index funds are making the headlines today, is that the average hedge fund looks like a fixed blend of cheap investments, at high cost.

The posts on this blog are opinions, not advice. Please read our Disclaimers.