Get Indexology® Blog updates via email.

In This List

How Two Robo-Advisors Define Core

How did South African active managers perform against their benchmarks in 2014?

Asia Fixed Income: Opening of the China Onshore Repo Market

The Smarter Investor

European Government Bond Markets Absorb a Lot of Market Info in the First Week of June

How Two Robo-Advisors Define Core

Contributor Image
Shaun Wurzbach

Managing Director, Head of Commercial Group (North America)

S&P Dow Jones Indices

I was intrigued by the recent Barron’s cover story on robo-advice.  The Barron’s article described example portfolios for Betterment, Charles Schwab, Vanguard Personal Advisor Services, and Wealthfront.  As I mentioned in my last post, robo-advisors are power-users of indexing and ETFs.  So I thought that it would be interesting to compare and contrast some of the ETF holdings of two of these robo-advisors, with my assumption being that the portfolios that these robos would construct will be bare-bones, no frills core portfolios. Emerging and mass affluent clients currently are underserved with regard to strategic asset allocations.

The Barron’s article had me expecting to find that the RIAs Betterment and Wealthfront held 10-12 ETFs for their clients.  Not the case.  I was surprised by the breadth of their ETF holdings and by the percentage of assets which they have committed to index-trackers.

Capture

Cerulli data from EOY 2014 indicates that RIAs, on average, have approximately 80% of client assets in ETFs.  So these two robo-advisors are at roughly 400% of the average.

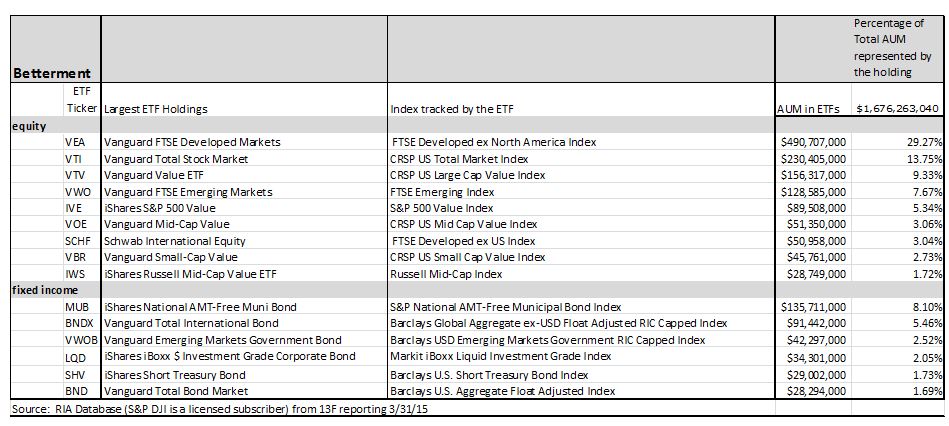
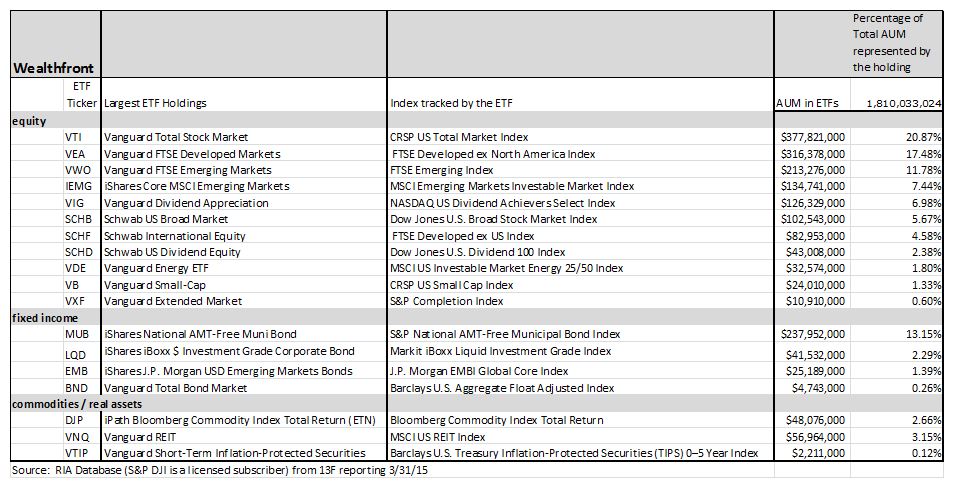
Next, I wanted to see how these two robo-advisors are using indexing and ETFs to create core portfolios.  To be clear, I can only see the aggregate of their holdings, not individual client accounts.  Based on their average client size ($20,192 for Betterment and $75,636 for Wealthfront) and the amount of AUM in certain ETFs, I can draw some conclusions about the ETFs which are most commonly recommended by these two robo-advisors:
Capture

Capture

First, the ETF holdings of both robo-advisors do show a focus on core building blocks such as total market solutions and capturing entire asset classes in a single ETF.  Such an approach is a simple and inexpensive way to deliver market exposure.  Both robo-advisors show a willingness to use an emerging markets debt ETF for exposure to that asset class.  And interestingly, both choose the same ETF for exposure to municipal bonds.  The large AUM which each robo-advisors hold in a muni bond ETF reflect widespread use of indexing as the method to deliver diversified and national exposure to munis.  Key differences are seen in some of the ETFs used, which may reflect different trading costs due to custodial relationships.  Wealthfront also shows Commodity, TIP, and REIT holdings at a higher level than Betterment.  Wealthfront, in the large number of different ETFs that they hold for clients, also demonstrates difference in breadth of choice or perhaps in their willingness to customize portfolios for clients.

How these two robo-advisors have defined core portfolios and strategic asset allocation with ETFs is not only interesting now, but may serve as an interesting source of data and insights for the future.  Structurally and philosophically, I assume from what I have read that the robo-advisors will not encourage frequent trading and will educate investors to stick with their algorithmically-determined investment strategy.  Will the robo-advisors eventually publish “cohort” results over time and over business cycles?  If so, it will be interesting to see how effective these strategic asset allocation portfolios are in wealth accumulation and preventing the type of actual investor results which have been documented in years of DALBAR Quantitative Analysis of Investor Behavior studies.

The posts on this blog are opinions, not advice. Please read our Disclaimers.

How did South African active managers perform against their benchmarks in 2014?

Contributor Image
Daniel Ung

Former Director

Global Research & Design

Following the success of the SPIVA (S&P Indices versus Active) in the U.S., Australia, Canada, India, Japan, Europe and Latin America, we are now starting coverage on South Africa. Like the reports covering other regions, we aim to shed some light on the ongoing active vs. passive debate.  SPIVA South Africa will be published twice a year, mid-year and at the end of the year.

Let’s take a look at the results of the past year.

Overall, 2014 was somewhat mixed for South Africa, owing to labor disputes, electricity shortages and weak domestic demand. However, the performance of ZAR-denominated domestic equities, as measured by the S&P South Africa Domestic Shareholder Weighted (DSW) Index, held up reasonably well and went up by 16% over the year. However, they still lagged global equities as a whole.

Given the volatility over the year, we would have expected active managers to outperform their benchmarks but this did not turn out to be the case. Indeed, South African active equity managers underperformed their benchmarks in all equity fund categories and over all time horizons. (see Report 1 below).

In regards to fixed income, the results were less consistent. While active managers beat their respective benchmark in the short-term bond category, this was not the case in the longer-term diversified/aggregate category.

Capture

The posts on this blog are opinions, not advice. Please read our Disclaimers.

Asia Fixed Income: Opening of the China Onshore Repo Market

Contributor Image
Michele Leung

Former Director, Fixed Income Indices

S&P Dow Jones Indices

On June 3, 2015, the PBoC announced the opening of the China onshore repo market; the offshore RMB-clearing and participating banks will be allowed to trade bonds on repos in the onshore interbank bond market.  This is an important development for the offshore RMB market, as it will broaden the offshore RMB supply and support further RMB capital account reform.

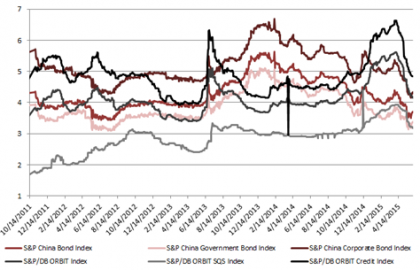
By connecting the onshore and offshore money markets, the difference in interest rates between the two markets is expected to narrow.  In fact, if we look at the yield performance of the offshore market, represented by the S&P/DB ORBIT Index, and the onshore market, represented by the S&P China Bond Index, we see that the spread has significantly reduced from 206 bps in early 2014 to 17 bps as of June 3, 2015.  The offshore yield has traded above the onshore yield since 2014, on the back of the weakening currency and tightening liquidity in the offshore market.  Beyond the convergence, their responses to market conditions have also become more in-sync, particularly during the recent rate cut.  It is interesting to note that the correlation between the two yield performances was -0.8 in 2014, whereas in 2015 YTD, it rose to 0.8; this implies that the two markets may be becoming more correlated.

Nevertheless, some differences remain. For example, in the perspective of monetary policy and liquidity, the onshore and offshore RMB money markets have different market dynamics. Additionally, in terms of market structure, some of the issuers in the offshore market are foreign names and a portion of the offshore RMB bonds received international bond-level ratings, whereas the onshore market is dominated by domestic issuers, and they are rated by local ratings agencies only.

Please see the yield chart in Exhibit 1 and index performance in Exhibit 2.

Source: S&P Dow Jones Indices LLC. Data as of June 9, 2015. Past performance is no guarantee of future results. Chart is provided for illustrative purposes. Note: S&P/DB ORBIT SQS Index is the S&P/DB ORBIT Sovereign and Quasi-Sovereign Index.
Source: S&P Dow Jones Indices LLC. Data as of June 9, 2015. Past performance is no guarantee of future results. Table is provided for illustrative purposes. Note: S&P/DB ORBIT SQS Index is the S&P/DB ORBIT Sovereign and Quasi-Sovereign Index.

The posts on this blog are opinions, not advice. Please read our Disclaimers.

The Smarter Investor

Contributor Image
Chris Bennett

Former Director, Index Investment Strategy

S&P Dow Jones Indices

Investors have spoken: There is a world outside of traditional indexing, and they want in.

“Smart beta” or factor indices bridge the gap between active and passive management by allowing investors to tilt toward specific investment attributes – for example, low volatility or high dividend yield.  These indices use factors in a rules-based, transparent manner to determine index composition and/or weighting. Smart beta products give passive investors access to factor exposures that were once only available through active management.

Smart beta has flourished, attracting more assets than ever before. According to our 2014 Survey of Indexed Assets, AUM in products linked to S&P DJI smart beta indices grew 55% in 2014.  As the demand for factor indices has increased, so too has their availability. We’ve created indices to provide a wide variety of exposures, while still maintaining the advantages of passive management.  The growth of ETFs as a delivery vehicle has complemented the growth of factor indices, enabling investors to seek new opportunities.

That said, demand for smart beta has not been cannibalistic; passive investment in traditional exposures has also increased. AUM growth in products indexed to the S&P 500 outpaced the growth of the index, indicating positive net flows into traditional cap-weighted investments. The demand for first-generation indexed investments has not decreased in the wake of new “smart” offerings.

Much research (including our SPIVA reports) confirms that most active managers underperform most of the time. The probability that an active manager beat his benchmark is low, and the probability that he did it consistently is even lower. Positive inflows into passive vehicles indicate that investors have heeded these data, and that the smarter investor prefers better odds.

The posts on this blog are opinions, not advice. Please read our Disclaimers.

European Government Bond Markets Absorb a Lot of Market Info in the First Week of June

Contributor Image
Heather Mcardle

Director, Fixed Income Indices

S&P Dow Jones Indices

European bonds markets had a lot to take in last week.  For the most part, they all responded with a downward price reaction regardless of risk profile, with the exception of Greece.  The ECB left monetary policy unchanged.  Eurozone inflation for May climbed to 0.3%, indicating that QE is having the desired effect.  Greece chose to bundle its June payments to the IMF into one payment scheduled for June 30, 2015, buying them more time to negotiate their debt obligations.  Last, strong employment numbers out of the U.S. pointed to possible Fed rate hikes, which is always a catalyst for a bond market sell-off.

This reaction indicates that, despite continued uncertainty out of Greece, the European bond market is turning away from a “flight to quality” stance.  This could be due to a perception that Greece is on the right track to meet its loan obligations, and/or it could be due to improving economic signs both in Europe and in the U.S.  Spain and Italy, two countries tied to the “risk-on“ trade, also moved down in tandem with the countries associated with the “risk-off”/“flight to quality” trade like Germany.

If we look at data from the close of June 1, 2015, to the close of June 8, 2015, yields on most European government bond markets significantly widened (while bond prices went down).  The S&P Germany Sovereign Bond Index and the S&P Spain Sovereign Bond Index both widened 18 bps, the S&P Italy Sovereign Bond Index widened 16 bps, and the S&P Ireland Sovereign Bond Index widened 24 bps, while the S&P Greece Sovereign Bond Index ended unchanged for this period after tightening 8 bps on Friday.

Capture

The posts on this blog are opinions, not advice. Please read our Disclaimers.