Get Indexology® Blog updates via email.

In This List

Harvesting the Size Factor Premium

PMIs vs. Pan Asia Bond Markets

The Rieger Report: Munis Face an Unholy Trio

European Government Bond Markets Continue Sell-Off With the Exception of Sweden & Norway

Offering Choices…The S&P BSE AllCap

Harvesting the Size Factor Premium

Contributor Image
Justin Sibears

Managing Director, Portfolio Manager

Newfound Research

Factor investing is a well-documented method of generating excess returns, but some of the practical aspects of it are often overlooked in academic research, which tends to focus on “pure” premiums. Investors wanting to access these factors – size, value, volatility, momentum, etc. – are presented with a number of investment alternatives that aim to harvest the factor premium in different ways, and deciding which to utilize can be difficult.

For the size premium, one obvious choice is an ETF tracking the S&P SmallCap 600 index. However, other options may look surprisingly similar. The chart below shows the S&P SmallCap 600 index along with the S&P 500 index and the S&P 500 Equal Weight index.

Capture

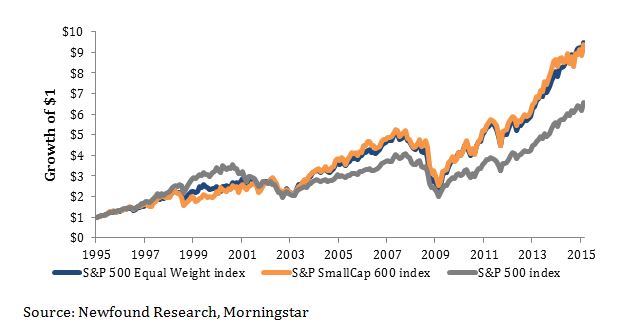
Performance statistics of the three indices over the period from January 1995 to February 2015 are shown below.

Capture

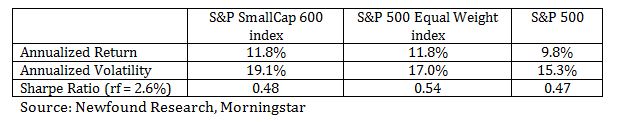
From this we can see that the equal weight version of the S&P 500 behaved a lot like the S&P SmallCap 600 with slightly better risk-adjusted returns.

If we look at the alpha of these two indices over rolling two year periods, we see that they exhibit very similar trends. The average alpha for the S&P SmallCap 600 index was 2.5% compared to 2.4% for the S&P 500 Equal Weight index, but the S&P SmallCap 600 index’s alpha was over 50% more volatile.

Capture

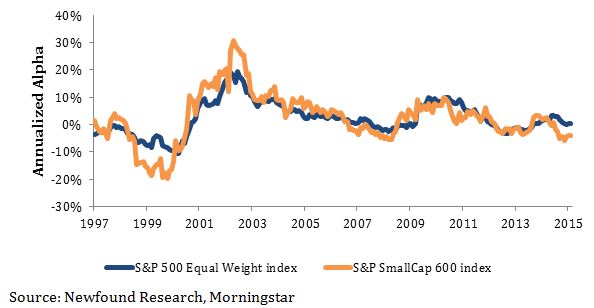
While this analysis does not guarantee that these out/under-performance trends have been directly attributable to the “size” factor in both indices, it does hint that there is at least some overlap in risk factors underpinning the two.

One important consideration when dealing with factors is how they will be used within a strategy. Within our U.S. Factor Defensive Equity strategy, we consider five factors: momentum, value, dividend growth, low volatility and size. These are weighted in proportion to their inverse volatilities. Therefore, we care more about the risk-adjusted return of the factor rather than simply the factor premium. Because the risk-adjusted return of the S&P SmallCap 600 index is right in line with the S&P 500 index, accessing size in this manner would not have benefited the strategy; there was not really any risk-premium.

This is just a specific example of a well-documented phenomenon.

The size premium is arguably one of the weakest of the factor premiums, especially in recent history. In their paper “Quality Minus Junk”, Assness, Frazzini, and Pedersen of AQR examined different market cap stocks sorted based on their quality and found that the size premium is most pronounced in high quality stocks. Many small-cap indices are skewed toward lower quality stocks, and while the S&P SmallCap 600 index screens companies for profitability, we would expect a higher proportion of large-cap stocks to be classified as “quality stocks”, in general.

We chose the S&P 500 Equal Weight index ETF as our size factor not because it is the purest exposure to the size premium, but because its methodology complements our other factor exposures. If we had chosen the S&P SmallCap 600 or any other of a number of market-cap weighted small-cap indices, we would likely have less exposure to the beneficial quality factor.  Equally weighting the index also pairs with our value factor by avoiding many of the glamour stocks, and rebalancing back to equal weight captures benefits of mean reversion.

Ultimately, having a pure factor exposure may be ideal in an academic setting with a 70+ year investment horizon, but on the practical level where we operate, the best outcome is likely realized by utilizing more robust indices and combining them in an intelligent way.

————————————————————————————————————————————————————–The views and opinions of any contributor not an employee of S&P Dow Jones Indices are his/her own and do not necessarily represent the views or opinions of S&P Dow Jones Indices or any of its affiliates.  Information from third party contributors is presented as provided and has not been edited.  S&P Dow Jones Indices LLC and its affiliates make no representations or warranties of any kind, express or implied, regarding the completeness, accuracy, reliability, suitability or availability of such information, including any products and services described herein, for any purpose. 

The posts on this blog are opinions, not advice. Please read our Disclaimers.

PMIs vs. Pan Asia Bond Markets

Contributor Image
Michele Leung

Former Director, Fixed Income Indices

S&P Dow Jones Indices

The China PMI continued to show deterioration while the headline PMIs for other countries like South Korea, Taiwan and Indonesia also ticked down.  The market is expecting more easing to come in order to support the growth.

As of May 15, 2015, the S&P Pan Asia Bond Index rose 0.10% this month, bringing the year-to-date (YTD) total return to 2.40%, yet the individual market showed mixed performance. The S&P Indonesia Bond Index continued the slide and fell another 0.79% in May. Please see exhibit 1 for YTD and 1-Year total return performance.

On the other hand, China is the best performer of the month. The S&P China Bond Index rose 0.70% MTD and 2.85% YTD, led by the gains in the corporate bonds. On the back of the strong Chinese equities rally, the S&P China Convertible Bond Index jumped 11.4% YTD. The Chinese offshore RMB bond market, represented by the S&P/DB ORBIT Index also went up 1.94% YTD. Though the index’s yield tightened by 33bps to 4.37%, it offers yield pick-up over the onshore bond market.

Exhibit 1: Total Return Performance of the S&P Pan Asia Bond Index

20150520

The posts on this blog are opinions, not advice. Please read our Disclaimers.

The Rieger Report: Munis Face an Unholy Trio

Contributor Image
J.R. Rieger

Former Head of Fixed Income Indices

S&P Dow Jones Indices

Three storms are converging on the municipal bond market: supply, interest rates and bad news headlines – a powerful trio of bad news for the municipal bond market.

  • The S&P Municipal Bond Illinois Index is down 1.55% for month-to-date and is the worst performing state index for the month so far.  The index is down 1.16% year-to-date.
  • The S&P Municipal Bond Illinois General Obligation Index is down 2.63% month-to-date and is the worst performing G.O. index.  The index is down 3.06% year-to-date.  Chicago General Obligation bonds make up 35% of this index by market value.
  • The S&P Municipal Bond New Jersey Index is down 1.07% month-to-date and is the second worst performing state index for the month.  The index is down 1.1% year-to-date.
  • Puerto Rico is having a dead cat bounce in May as the S&P Municipal Bond Puerto Rico General Obligation Index is up 2.37% month-to-date.  The index remains in the red for the year so far down 0.97% year-to-date.

The combination has put a heavy weight on the investment grade tax-free bond market which has seen negative returns in 2015.  The S&P National AMT-Free Municipal Bond Index is down 0.73% month-to-date and 0.36% year-to-date.

One bright light is the municipal high yield bond market as the S&P Municipal Bond High Yield Index is up 0.82% year-to-date helped by positive performance in May by Puerto Rico bonds and a recovery over 3.2% of the Tobacco Settlement bond sector.

 Muni Yields & Returns 5 19 2015

The posts on this blog are opinions, not advice. Please read our Disclaimers.

European Government Bond Markets Continue Sell-Off With the Exception of Sweden & Norway

Contributor Image
Heather Mcardle

Director, Fixed Income Indices

S&P Dow Jones Indices

Most European government bond markets continued their downward spiral during the week of May11th, 2015, led by a sell-off in US Treasury markets.  New supply from the US Treasury pushed yields up (bond prices down) and aided a global downward trend.  Europe is showing its sensitivity to uncertainty over when the fed will start to raise rates.  This coupled with concerns that European bond markets are overvalued in light of the ECB’s QE expectations, and whether deflation concerns are over-hyped, are giving the market mixed signals.

Capture

European government bond markets are moving in tandem for the most part, despite conflicting inflation numbers.  While inflation is picking up in Germany and France, with consumer prices rising in both countries for the month of April YOY, Italy and Spain are seeing lower prices.   Italian CPI was down at -.1% for the month of April YOY, while Spain’s CPI is at -.7% in April YOY.  All four of these markets sold off causing yields to spike 10bps and up since Friday’s close.

Norway and Sweden did not sell off and actually rallied on Wednesday.  Swedish consumer prices declined .2%, causing concerns that Sweden will need to lower rates further.  From Friday’s close, the S&P Sweden Sovereign Bond Index yield tightened 2bps to close at .30% as of Wednesday.  Norway’s CPI for April clocked in at 2% YOY, and its bond market rallied as well.  The S&P Norway Sovereign Bond Index, initially sold off on Tuesday only to bounce back again along with Sweden.   The S&P Norway Sovereign Bond Index tightened 1bps to 1.31% for the same timeframe.

The posts on this blog are opinions, not advice. Please read our Disclaimers.

Offering Choices…The S&P BSE AllCap

Contributor Image
Koel Ghosh

Former Head of South Asia

S&P Dow Jones Indices

The importance of choice is gaining ground in all areas of life.  I really resonated to the latest advertisement from Amazon, “Hindustani Dil Kahta Hai, Aur Dikhao, Aur Dikhao!” (“The Indian heart says, Show me more, show me more!”).  I would agree that choice is not only important in our day-to-day lives; it also holds true while making investment decisions.  A well-classified universe helps in avoiding confusion, as there are innumerable options to choose from and to use for setting goals or requirements.  Good and clear categorization helps simplify the process.

Indian markets have witnessed quite a movement in the past year, with a one-year return of 21.31% for the S&P BSE SENSEX (one-year annualised price return as of May 8, 2015).  When markets show such growth in a short time, analysts get busy trying to decode the trend and its attributes.  It is then that it becomes essential to have a proper market gauge.

Exhibit 1: S&P BSE SENSEX Annual Returns 

sensex ar

sensex

Source: S&P Dow Jones Indices LLC.  Data as of May 8, 2015.  Past performance is no guarantee of future results.  Chart and table are provided for illustrative purposes only.

It is with this intent that last month, the S&P BSE suite of indices introduced the S&P BSE AllCap.  This is a great tool for market research, as the subcategories that form this superset are clear and well-categorized segments that help provide distinct trends.  Some may be aware that S&P Dow Jones Indices already had renowned and popularly tracked indices for the Indian market, such as the S&P BSE 100, S&P BSE 200, and S&P BSE 500, which serve as benchmarks for many investment strategies and funds.  Why, then, did we create a new series?Source: S&P Dow Jones Indices LLC.  Data as of May 8, 2015.  Past performance is no guarantee of future results.  Chart and table are provided for illustrative purposes only.

As an organization, assessing market requirements and taking active feedback from market players has been always an essential part of index creation.  These two ingredients ensure that an index that is created is useful to a specific market and its participants.  The new, S&P BSE Indices are aligned to global standards and practices that broaden the horizon of creating investment products.  Globally, fund managers, investment professionals, and investors understand this classification as well.

The S&P BSE AllCap is subcategorized into five size-based indices, with the primary indices being for large-cap, mid-cap, small-cap, large-mid-cap, and mid–small-cap companies.  The index is further classified into 10 sector-based subindices.

The S&P BSE AllCap, with over 700 constituents, is a broad index covering more than 95% of total Indian market capitalization, and the index aims to be useful for broad market measurement or benchmarking.  Hence, S&P Dow Jones Indices broadened the market coverage from the existing S&P BSE 500 to 700 stocks for the S&P BSE AllCap.

For those seeking to analyse market movements across size or sectors can track the five size-based indices and 10 sector indices.

Exhibit 2: Size Subindices of the S&P BSE AllCap 

allcap

Source: S&P Dow Jones Indices LLC.  Chart is provided for illustrative purposes.

While we are using S&P Dow Jones Indices’ global methodology of 70%/15%/15% composition for the large-, mid-, and small-cap size-based indices, the sector indices conform to the BSE classification.

Exhibit 3: Sector Subindices of the S&P BSE AllCap

allcap 1

Source: S&P Dow Jones Indices LLC.  Chart is provided for illustrative purposes. 

These new indices are aimed at providing a tool for better analysis of market trends, as well as an accurate representation of the segments or sectors that make them ideal for new products.

Exhibit 4: Number of Stocks in the S&P BSE Size-Based Indices 

size i

Source: S&P Dow Jones Indices LLC.  Data as of annual reconstitution in September 2014.  Chart is provided for illustrative purposes. 

Exhibit 5: Number of Stocks in the S&P BSE Sector-Based Indices 

sector i

Source: S&P Dow Jones Indices LLC.  Data as of annual reconstitution in September 2014.  Chart is provided for illustrative purposes. 

For more information on these new indices, you can log on to www.asiaindex.co.in.

The posts on this blog are opinions, not advice. Please read our Disclaimers.