Get Indexology® Blog updates via email.

In This List

Impact of the Affordable Healthcare Act on Healthcare Cost Trends

Russian Ruble Rebounds (somewhat)

Playing the Loser's Game

HO HO HO! Merry Christmas

The Ruble’s Currency Crisis

Impact of the Affordable Healthcare Act on Healthcare Cost Trends

Contributor Image
Michael Taggart

Consultant, S&P Healthcare Indices

S&P Dow Jones Indices

With the start of the second annual enrollment under the Affordable Care Act (ACA), there is high interest regarding the impact of the ACA on healthcare cost trends. The S&P Healthcare Claims Indices provide an accurate and up to date source of information available in the market regarding healthcare cost trends. The updates released in October 2014 are a measure for evaluating the impact of the ACA rules on healthcare trends.

The graph below shows the actual 12-month year/year healthcare cost trends for commercial medical insurance plans, with trends shown separately for:

  • ASO (Self Funded) Plans – these plans are typically offered by large employers
  • Insured Group Plans – insurance plans provided by employers with more than 50 employees
  • Individual Plans – medical plans purchased by individuals (including the ACA exchanges)

taggart

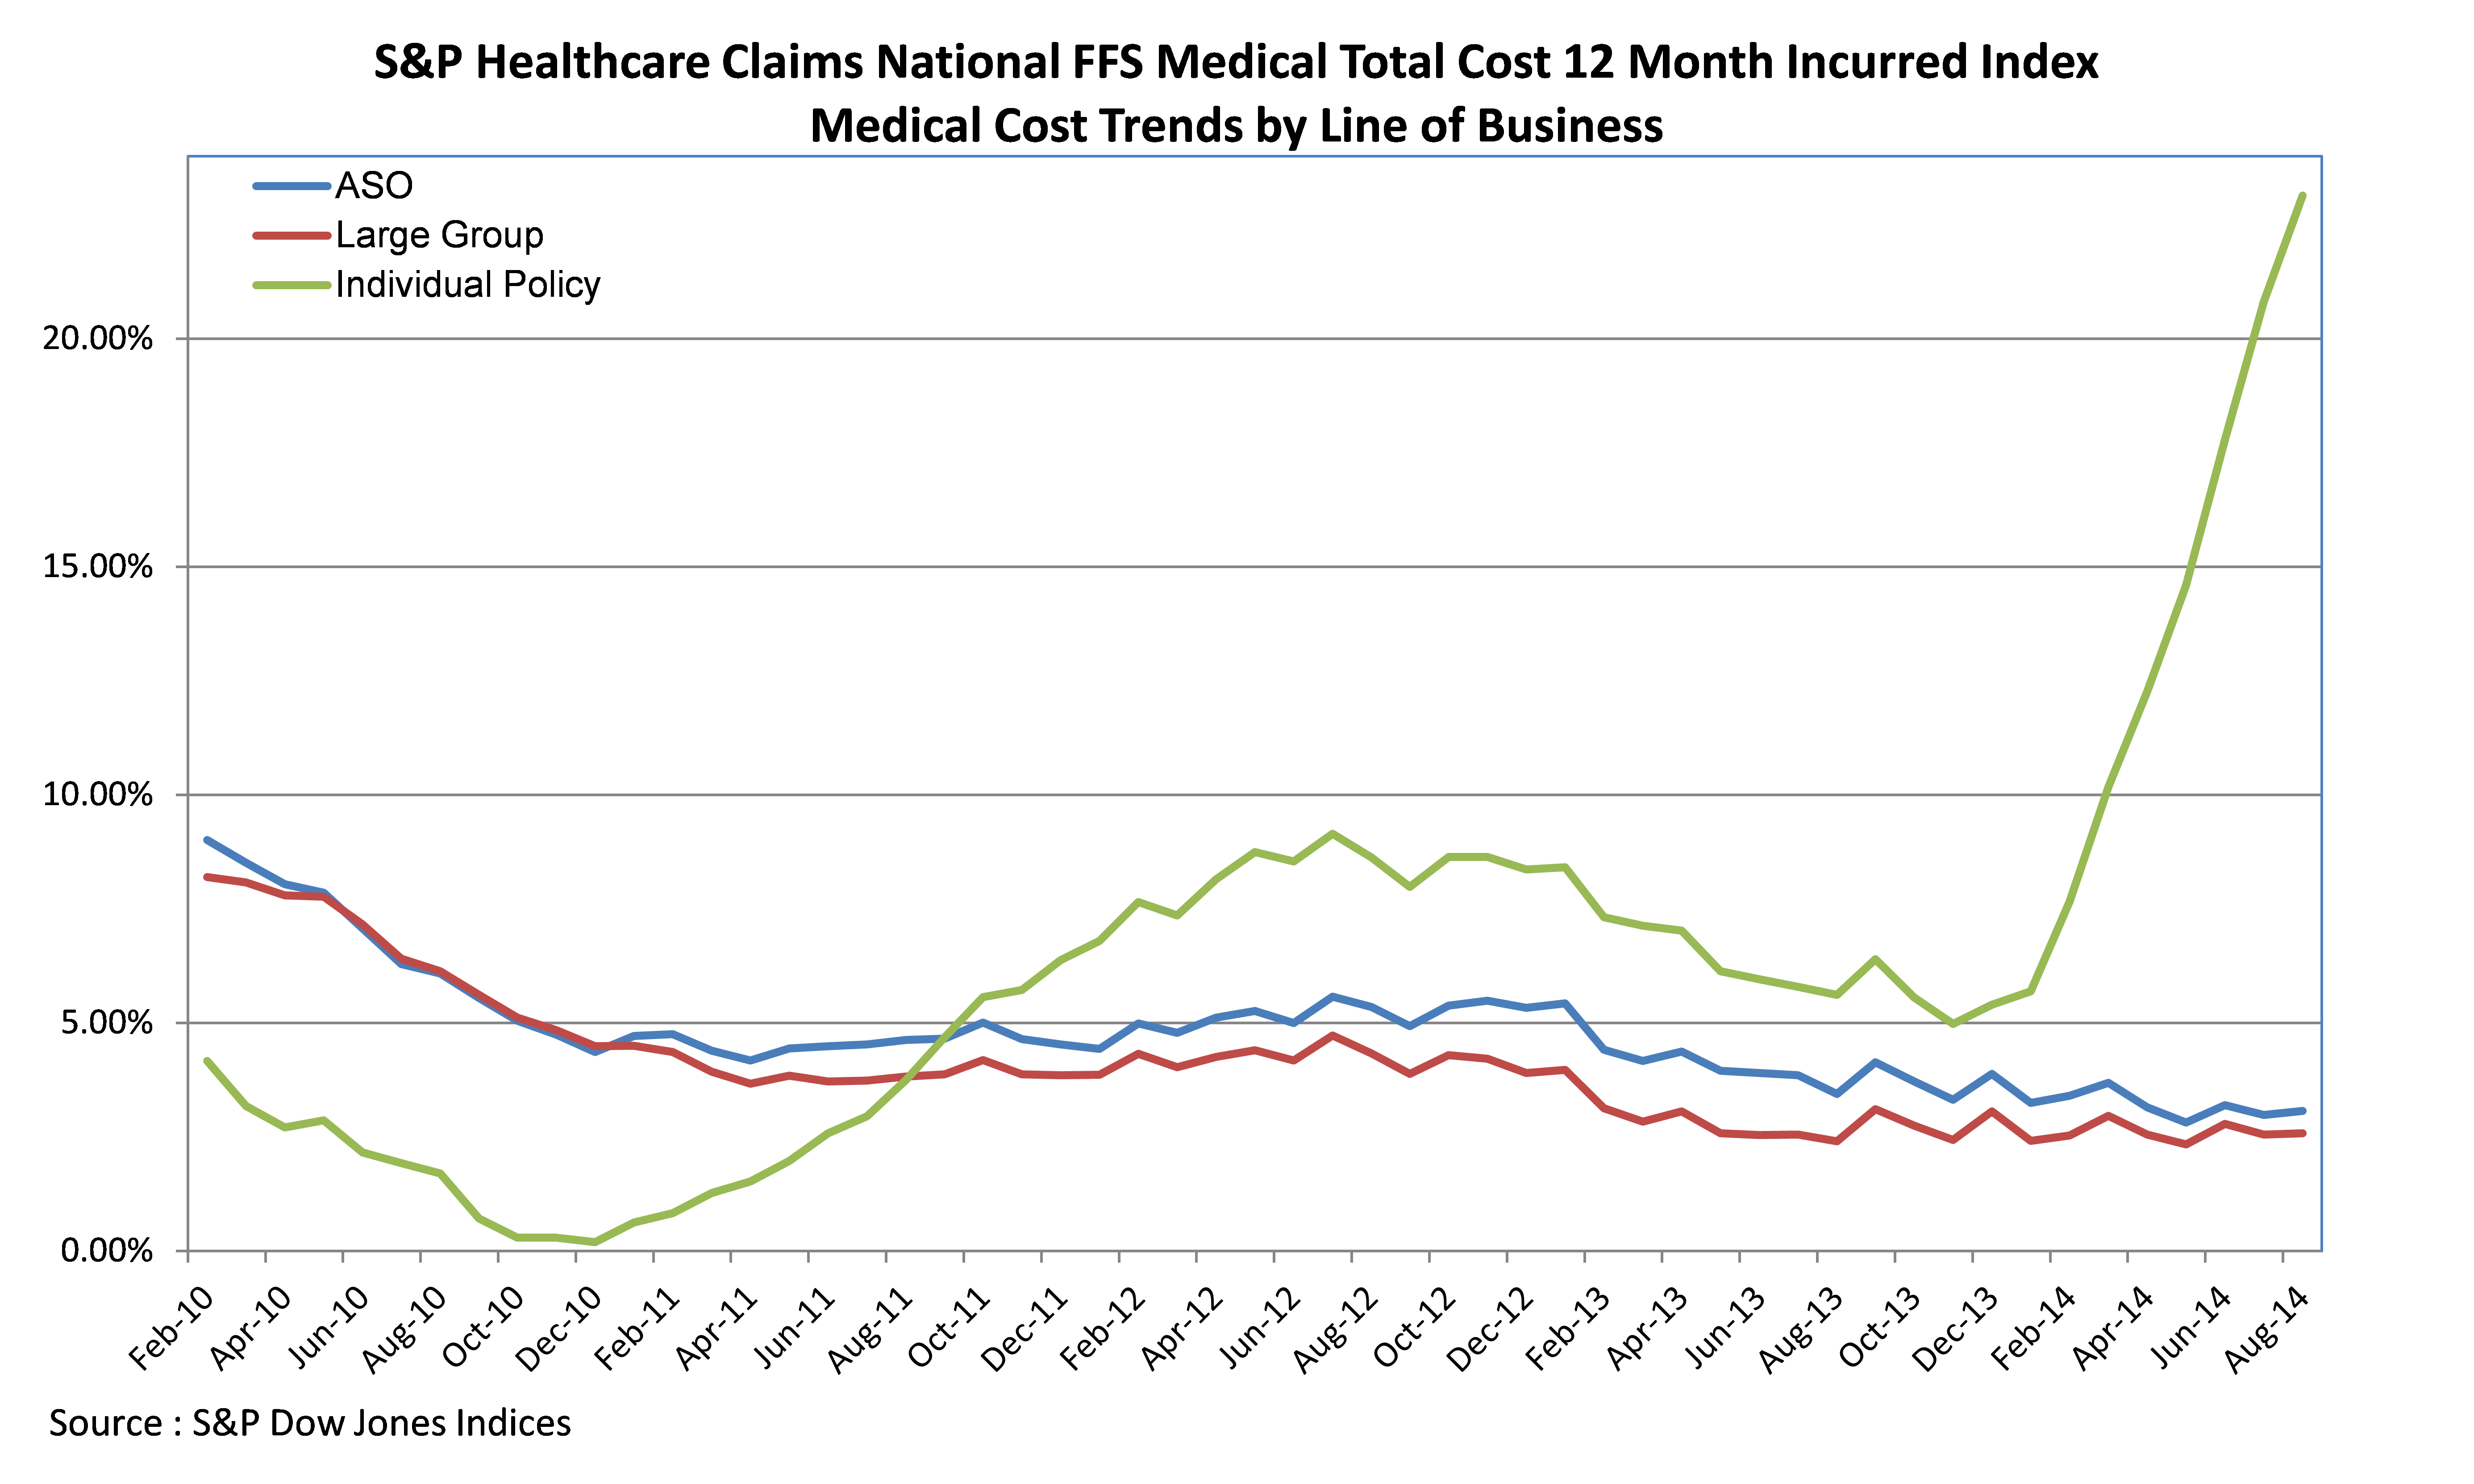
A quick glance at the indices makes a couple of issues clear:

  • For most employer-based medical plans, trends reached a low of 3% during late 2011 and have since increased between 4% – 6% annually.
  • For individual plans, healthcare costs began trending upward in early 2011 (while employer costs were trending downward) rising to an annual increase between 6% – 8% by early 2012.
  • With the implementation of the ACA rules eliminating pre-existing conditions, individual medical trends are increasing significantly. The most recent indexes show medical trends at 18% annually and the graph makes clear that the trend may go higher before the market stabilizes.

The S&P Indices highlight a couple of critical realities regarding healthcare costs. First, there is no single “trend rate” of healthcare costs – there are multiple factors impacting healthcare costs and good analysis should provide an understanding of how specific populations and types of healthcare services are changing. Second, healthcare costs can be significantly impacted by public policy changes and it may take years for these changes to be fully evident. In the meantime, having accurate and up to date information about healthcare cost changes will be critical to managing healthcare programs.

The posts on this blog are opinions, not advice. Please read our Disclaimers.

Russian Ruble Rebounds (somewhat)

Contributor Image
David Blitzer

Former Managing Director and Chairman of the Index Committee

S&P Dow Jones Indices

To paraphrase Mark Twain upon reading his own obituary, “Reports of the ruble’s demise have been exaggerated.”   A week ago as the ruble skidded 17% down and briefly traded at almost 80 to the US dollar, commentators were ready to add the ruble to a long list of currencies that cratered in crises. As seen in the chart, the ruble has staged a recovery and now trading at about 55 to the dollar, where it was at the beginning of December.  Oil, the supposed cause of the ruble’s weakness hasn’t staged a similar rebound.

The rebound owes its success to a combination of traditional and novel policy moves and unexpected forbearance by investors.  The initial response from the Russian central bank was to jack up interest rates by 6.5 percentage points to 17%.  This woke everyone up, but didn’t slow the ruble’s slide.  The bank’s second move was to buy rubles in the forex markets – an effort which was successful in stemming the collapse for the moment.  Usually investors greet a currency crisis by pulling their money out as quickly as possible. However,  shares outstanding in one of the largest western ETFs investing in Russian stocks didn’t drop as investors held their ground. One factor encouraging hope for the ruble is the substantial foreign currency reserve position, cited as $400 billion, held by Moscow.

Some novel steps were taken in the last few days. A currency swap agreement between the Peoples Bank of China and the Russian central bank was re-confirmed. This assures additional foreign currency available to support the ruble if needed.  However, further efforts to hold or boost the ruble will probably require more buying of rubles in the forex markets. Recognizing this, the Russian government is telling some state supported corporations to sell their own foreign exchange reserves over the next few months. (link here) Additional efforts urging private sector companies in Russia to sell reserves and buy rubles are expected as well.  The Russian central bank also rescued a local Russian bank facing severe financial difficulties in a move that suggested more confidence on the part of Russian authorities than some expected. Amusingly, the bank is question uses the American movie actor Bruce Willis in its local (Russian) advertising.

The ruble’s rebound and current stability is certainly welcome news to Russia and the Russian government.  However, as Putin indicated in a recent speech, Russia faces a deep recession over the next year or two. Without a rebound in oil prices, it is likely to experience a large fiscal deficit and further economic challenges.  This will mean more pressure on the ruble.  The currency crisis is contained for the time being, but the risk of a deeper economic crisis remains.

The posts on this blog are opinions, not advice. Please read our Disclaimers.

Playing the Loser's Game

Contributor Image
Craig Lazzara

Former Managing Director, Index Investment Strategy

S&P Dow Jones Indices

Forty years ago, Charles Ellis characterized active investment management as a “loser’s game.”  From the perspective of the mid-1970s, Ellis argued that since institutional investors had come to dominate the U.S. equity market, they could no longer generate market-beating returns by taking advantage of less well-informed amateurs.  Investment management had become a game played by professionals against other professionals, and the way to win was to make fewer mistakes than your competitors.  Since Ellis wrote, the trends he identified have continued in force — institutions’ share of assets has grown, portfolio turnover has increased, and managers have become more skillful.

This morning, John Authers of the Financial Times again characterized active management as a loser’s game, this time with special reference to the poor performance of most active managers in 2014.  There are three reasons why 2014 has been so challenging:

  • First, most active managers fail most of the time.  This is a consequence of what Sharpe called “The Arithmetic of Active Management,” and follows from the professionalization of the investment industry.  Since only half of the assets under management can have above-average returns before costs, and since active management costs more than passive indexing, the average active manager is at a disadvantage.
  • Second, there is little evidence of persistence in the success of active managers.  For example, the likelihood of finding a manager who will be above average for four consecutive years is about the same as the likelihood of flipping a coin and getting four heads in a row.
  • Third, active managers were especially challenged in 2014 because of the low level of dispersion in the U.S. equity market.  Dispersion measures the return differential between the average stock and the market index, and is a good proxy for the level of opportunity for active managers.  If dispersion is relatively wide, the opportunities to profit from stock selection are relatively large; when dispersion is narrow, the opportunities diminish.  And 2014’s dispersion may be a record low.

When Ellis wrote in 1975, the alternative to an unsatisfactory active manager was another (putatively-superior) active manager.  Since then, there has been dramatic growth in the availability of indexed investments.  In 2014 more than in most years, an investor who was willing to accept the market’s return outperformed a large majority of active investors.  One way to win the loser’s game is not to play at all.


The posts on this blog are opinions, not advice. Please read our Disclaimers.

HO HO HO! Merry Christmas

Contributor Image
Jodie Gunzberg

Former Managing Director, Head of U.S. Equities

S&P Dow Jones Indices

How would you like some heating oil (HO) for Christmas?  Chances are you wouldn’t really like that too much, especially if you agree with this report posted on Morningstar.com that quotes, “Nobody would ever put oil in their house unless there was no gas on their street.”

Despite the S&P GSCI Heating Oil (spot return) losing 12.7% this month through December 18, it is the only commodity in the energy sector whose excess return of -11.5% is greater than its spot return.  With oil prices falling and heating oil in the index at its lowest since May 2010, how could the roll return (excess return – spot return) possibly be positive, indicating inventory pressure?

According to the International Energy Agency (IEA), saavy consumers are taking the opportunity to stock up on heating oil as prices fall. By October, German end‐user heating oil stocks reached 66% of tank‐fill (+1 percentage point m‐o‐m), their highest level since 2009. The impact is pairing excess return losses this month on heating oil compared to other petroleum constituents including WTI -18.1%, Brent -16.0%, unleaded gasoline -16.4% and gasoil -16.7% in the index.

The difference in roll return or term structures between the S&P GSCI Heating Oil and S&P GSCI Brent Oil has been increasing at an unprecedented rate.  Never in history has this difference increased for five consecutive months. There have been five times in history since 1999 with five consecutive months showing greater excess return in heating oil than Brent oil but not with the acceleration of today that reflects the stockpiling by the heating oil consumer.

Source: S&P Dow Jones Indices LLC. All information presented prior to the index launch date is back-tested. Back-tested performance is not actual performance, but is hypothetical. The back-test calculations are based on the same methodology that was in effect when the index was officially launched. Past performance is not a guarantee of future results.  Please see the Performance Disclosure at http://www.spindices.com/regulatory-affairs-disclaimers/ for more information regarding the inherent limitations associated with back-tested performance.
Source: S&P Dow Jones Indices LLC. All information presented prior to the index launch date is back-tested. Back-tested performance is not actual performance, but is hypothetical. The back-test calculations are based on the same methodology that was in effect when the index was officially launched. Past performance is not a guarantee of future results. Please see the Performance Disclosure at http://www.spindices.com/regulatory-affairs-disclaimers/ for more information regarding the inherent limitations associated with back-tested performance.

The posts on this blog are opinions, not advice. Please read our Disclaimers.

The Ruble’s Currency Crisis

Contributor Image
David Blitzer

Former Managing Director and Chairman of the Index Committee

S&P Dow Jones Indices

After sliding slowly down for most of the year, The Russian ruble dropped 20% in the last ten days. The slide began with the weakening Russian economy, sanctions imposed by the US and the EU last summer and falling oil prices.  All these factors were present for many weeks and none explain the sharp move seen at the right hand end of the chart where the ruble/dollar rate jumps.

There were two immediate causes. The first, and less important, was a bill passed by Congress authorizing additional sanctions.  While the President signed the bill, no instant action on more sanctions was expected. Second, at the end of last week Rosneft, the Russian oil company, offered a large ruble-denominated bond and the Russian central bank added the new issue to the list of securities it will accept as collateral for loans to local banks. Further, Russian banks were rumored to be the principal purchasers of the Rosneft bonds. Since Rosneft needs to refinance a large US dollar denominated loan from western banks, the markets assumed that, one way or another, the ruble proceeds from the bond issue or rubles from banks using the bonds as collateral with the central bank, would find their way into the foreign exchange markets and put downward pressure on the currency.  These fears sparked the run on the ruble this week.

So far this has played out according to the usual process: gradual economic weakening, rising inflation, large hard currency debts and external pressures on trade (cheap oil) creates nervousness and worry. Then some seemingly minor event like the Rosneft bond issue raises the fear level and leads to a run.

The response also followed the usual script except that for the moment it seems to be successful. First, the Russian central bank raised interest rates by 6.5 percentage points to 17%. Then it followed two days later by intervening in the foreign exchange market and buying rubles. The amount bought isn’t known but Russian foreign exchange reserves, estimated at $200 to $400 billion, don’t appear to be exhausted. Since Wednesday afternoon New York time, the ruble has traded near 60 to the US dollar without any large dips. Brent crude oil, the principal global oil benchmark, is also showing some signs of stability. It rebounded from under $59 yesterday to above $60.  For the moment the combination of relief from collapsing oil prices, the higher interest rates and the forex intervention may be stabilizing the ruble.

If the ruble can remain close to 60, the crisis will be over for the time being and the result will be far better than most past currency crises.  However, no one should assume everything is resolved. Interest rates at 17% and imports 50% more expensive than a year ago (see chart) impose huge stresses on the economy. Add to that the sanctions and the reluctance of European and American businesses to invest in Russian projects, and another currency crisis cannot be ruled out.

Tim Edwards, in an earlier post on this blog, noted that the trailing PE ratio on the S&P Russian BMI is four times, a deliciously low number.  It is either too early or too late: If the ruble holds near 60 or strengthens somewhat it may be too late to speculate in Russia; if the next move takes the Ruble close to 100, it is too early.  Unfortunately there is no way to know.

The posts on this blog are opinions, not advice. Please read our Disclaimers.