Get Indexology® Blog updates via email.

In This List

Silver Anchors and Pains

Signs of Softness in Housing

Fixed Income Update: Presidents’ Day Week

The VIX Factor

Surprises Come With Attractive Yields

Silver Anchors and Pains

Contributor Image
Jodie Gunzberg

Former Managing Director, Head of U.S. Equities

S&P Dow Jones Indices

Psychologists have studied feelings of Olympic medalists  for decades to find: “If you set aside the happy people who win gold and look only at the people who come in second and third, it’s the men and women with bronze medals who invariably look happier than the athletes who won silver.”

To investors who have studied behavioral finance, it is no surprise that the silver winners feel like gold losers. In economics, we call this framework loss aversion and it implies that one will feel more pain from a loss than happiness from a gain.

Whether a transaction is framed as a loss or as a gain is very important. For example, would you rather get a $5 discount, or avoid a $5 surcharge?  The same change in price framed differently has a significant effect on consumer behavior. Though traditional economists consider this “endowment effect” and all other effects of loss aversion to be completely irrational, that is why it is so important to the fields of marketing and behavioral finance.

The concept of loss aversion was first demonstrated by Amos Tversky and Daniel Kahneman. Later, in a publication by John Dawes, (Price changes and defection levels in a subscription-type market: can an estimation model really predict defection levels ?” Journal of Services Marketing Vol 18 No. 1 2004.), the effect of loss aversion in a marketing setting was demonstrated in a study of consumer reaction to price changes to insurance policies. The study found price increases had twice the effect on customer switching, compared to price decreases.

Silver’s performance, up 14.5% MTD and 13.0% YTD through Feb 18, 2014, may be causing the same feelings of anxiety, depending on how it’s framed. Suppose an investor picked silver as the commodity of choice in February, it seems like a winning choice.  However, it is only the second best performing commodity in the S&P GSCI, behind coffee, which gained a whopping 21.7% this month. The chance this investor is happy to have picked the second best commodity might not be so high since the mind frame may be a loss of 7.2%.

Another irrational behavior in finance is called anchoring. Anchoring which was also described by Tversky and Kahneman, occurs when people make estimates by starting from an initial value.  For example, in the Olympics, if two athletes competed in the 2010 games and one won a gold and the other won a bronze, then they both won silvers in 2014, the athlete who dropped from gold to silver might be more unhappy than the athlete who improved from bronze to silver.

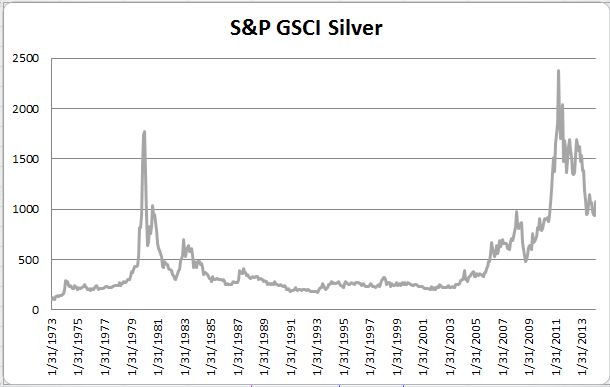
Notice in the the chart below, there may be different feelings about holding or selling silver today based upon the price of purchase.  However, the irrational behavior is that it shouldn’t matter what the purchase price was considering the decision going forward to buy, hold or sell should be based on today’s price in relation to the future and not the past. An investor that bought silver in Oct 2008 may be feeling regret that s/he did not sell at the high in April 2011, and rather than being happy over a 125% gain is feeling upset over a 55% loss.  On the other hand, if an investor bought at the beginning of 2014 and has gained 13%, s/he may be feeling elated, and that of course is only if s/he is not sorry to have missed out on coffee.

Source: S&P Dow Jones Indices and/or its affiliates. Data from Jan 1973 to Feb 2014. Past performance is not an indication of future results. This chart reflects hypothetical historical performance. Please see the Performance Disclosure at the end of this document for more information regarding the inherent limitations associated with backtested performance.


The posts on this blog are opinions, not advice. Please read our Disclaimers.

Signs of Softness in Housing

Contributor Image
David Blitzer

Former Managing Director and Chairman of the Index Committee

S&P Dow Jones Indices

The National Association of Home Builders sentiment index for February, reported yesterday dropped sharply to 46 from 56 in January and an average of 51 for 2013.  A reading above 50 means more builders view the market as favorably than as unfavorable.  Housing permits and starts for January were reported this morning and are also disappointing.  Permits were down 5.4% from December overall and down 1.3% for single family homes. Total permits are up compared to January 2013 but single family units are flat.  Housing starts were weaker than permits with total starts down 16% from the previous month and off 2% from a year earlier. For single family units, the monthly drop was 15.9% and the year earlier decline was 6.7%.  The Mortgage Bankers Association index of mortgages for purchase is down 27% from its peak last May and down 16% from its recent peak on January 10th.

Housing is not about to collapse into another bust, but it is due for a pause after a strong rebound since the first half of 2012. A small portion of the softness may be due to extremely cold and snowy weather in the eastern half of the country. However, some of the weakness is more fundamental.  Having led the economy into recovery, albeit later than we would have liked, housing must now depend on gains in income and employment for its next upward leg.

housing

Further indications of housing can be seen in the past stock market performance of the S&P Home Builders Index (the red line) compared to the S&P 500 (the blue line).

More data will be forthcoming this week and next including existing and new home sales and the S&P/Case-Shiller Indices for December next Tuesday morning, February 25th.

The posts on this blog are opinions, not advice. Please read our Disclaimers.

Fixed Income Update: Presidents’ Day Week

Contributor Image
Kevin Horan

Former Director, Fixed Income Indices

S&P Dow Jones Indices

A short week ahead due to yesterday’s President’s Day Holiday.  Treasuries gained today as the Empire Manufacturing report released today was a 4.48.  The survey of manufacturing executives was bearish when compared to the expected number of 8.5 and its prior number of 12.51.  February’s home builder’s sentiment was also lower as the National Association of Home Builders Market Index reported a 46 compared to the surveyed number of 56.  The next three days will provide significant economic measures as the market continues to weight the degree of strength for the U.S. economy.  Tomorrow’s MBA Mortgage Applications (-2% prior), Housing Starts (950k expected) and Thursday’s CPI (0.3% expected), along with Initial Jobless Claims (335k expected), should provide some additional guidance.  In addition to economic releases, the Federal Reserve will release its January 28-29th meeting notes.

The S&P/BGCantor Current 10 Year U.S. Treasury Bond Index was down last week by -0.23% and is now down -0.43% for the month.  The Treasury issuance calendar is light for this week including Bill issuance and $9 billion of the 30-year TIPS on Thursday.

Year-to-date the S&P U.S. Issued Investment Grade Corporate Bond Index is still performing well with a 2.01% return.  Month-to-date the index has only returned 0.08%.  After a healthy January where investors moved investments up into investment grade from riskier assets, February has been flat so far.   Bond selling each week has detracted from the three solid days of price appreciation (Feb. 3rd, 7th and 13th) which totals 1.04%.

The S&P/LSTA U.S. Leveraged Loan 100 Index made up some ground last week as the index continued its bounce from the Feb. 5th month-to-date low of -0.11%.  The index is now slightly down for the month at -0.02% and is returning 0.6% year-to-date.  TXU continued to be a drag on the index but was also joined by Weight Watchers International whose price dropped on news that Barclays downgraded the issuer to underweight.

High Yield, as measured by the S&P U.S. Issued High Yield Corporate Bond Index, on the other hand was at the same -0.11% a day prior on Feb 4th but has been able to lift itself up to the current 0.76% MTD and is returning 1.53% year-to-date.  Oil & Gas Exploration along with Wireless are two of the larger industry segments in the index and month-to-date have contributed the most by 0.07% and 0.05% respectively.


Data as of 2/14/2014, Leverage Loan data as of 2/17/2014

The posts on this blog are opinions, not advice. Please read our Disclaimers.

The VIX Factor

Contributor Image
Berlinda Liu

Former Director, Multi-Asset Indices

S&P Dow Jones Indices

After a strong 2013, the US equity market took a dive in January 2014 and dropped more than 3%. Is it a temporary market correction or something more substantial? Everyone has his own answer. Regardless of your outlook of the market, January has reminded us that market volatility is still one of the major risks that investors have to take care of.

To directly hedge against equity market risk, investors traditionally buy put options to protect their downside. In recent years, more and more investors include VIX derivatives in their portfolio to manage their market risk, including VIX futures, options, exchange traded products and other OTC products. The main benefits of using VIX derivatives are: 1) VIX is negatively correlated (~ -77%) with the S&P 500 Index historically, and 2) this negative correlation is convex, meaning that VIX shows more reaction to large decrease in the equity market than to market increases. Exhibit 1 shows that rises of the S&P 500 VIX Short-Term Futures Index were usually higher than the losses of the equity market when the market was in stress.

Daily Returns of VIX Spot and Futures on the 10 Biggest Market Drops

Isn’t convexity a nice feature of VIX futures? Unfortunately it is no free; VIX futures can lose money even if VIX does not change. All futures have fixed expiration days; hence the S&P 500 VIX Short-Term Futures Index has to roll from the first month futures contract to the second month futures contract prior to the expiration on the first month contract. Since Dec. 2005, for the majority of the time (~ 83%), the longer term VIX futures were more expensive than the shorter term futures and a roll cost was incurred.

This roll cost of VIX futures is equivalent to the upfront premium for equity put options. It is the price of the downside protection. The only difference is that the roll cost is distributed throughout the month as the futures price converges towards the spot while the put option premium is paid up front.

Exhibit 2 shows that the roll cost has led to significant performance drag in the S&P 500 VIX Short-Term Futures Index.

Exhibit 2: Performance History of S&P 500, VIX and S&P 500 VIX Short-Term Futures Index

Performance History of S&P 500, VIX and S&P 500 VIX Short-Term Futures Index

To avoid paying too much for downside protection, investors have to adjust their allocation to VIX futures wisely and implement “just-in-time hedging”. To help investors to dynamically allocate to VIX, S&P Dow Jones Indices launched the S&P 500 Dynamic VEQTOR Index (“VEQTOR”) as a prepackaged investment solution. The Index monitors two market signals, implied volatility trend and realized volatility, and allocates dynamically to equity and volatility. It also has a “stop-loss” feature that moves 100% to cash when the index has experienced more than 2% loss in the past five business days.

Compared to S&P 500, VEQTOR shows lower maximum drawdown and faster recovery. On 3/9/2009, the S&P 500 dropped 55% since its previous peak (2447.08 on 10/9/2007). It took 1120 calendar days to recover (2449.08 on 4/2/2012). VEQTOR saw its maximum drawdown on 9/15/2008 when it dropped 18% since its previous peak (137005.24. on 10/9/2007). It took only 31 calendar days to restore that level (140308.26 on 10/6/2008). See Exhibit 3.

Performance History of S&P 500 and S&P 500 Dynamic VEQTOR Index

As all volatility reduction products, VEQTOR outperforms in bear market. It also participates in the growth but underperforms in strong bull market.

For more information, please join us during our webinar on Thursday.

The posts on this blog are opinions, not advice. Please read our Disclaimers.

Surprises Come With Attractive Yields

Contributor Image
Michele Leung

Former Director, Fixed Income Indices

S&P Dow Jones Indices

Despite the headline news on India’s high deficits and low economic growth, the Indian bonds remain very popular among investors who hunt for yields. Let’s be realistic, while a 10 year U.S. Treasury Bond pays 2.7%, a similar maturity of Indian sovereign Bond is offering a yield of 8.8%!

The S&P BSE India 10 Year Sovereign Bond Index measures the performance of the current India on-the-run sovereign bond, with fixed coupons and having remaining maturity close to 10 years.  The index is created as an independent benchmark to meet strong investor demand in India sovereign bonds.

As presented in Exhibit 1, the index’s yield-to-maturity demonstrates the sensitiveness to the interest rate decision by Reserve Bank of India (RBI). On Dec 18, 2013, as RBI unexpectedly left the repo rate at 7.75%, the 10 year benchmark yield fell from 8.91% to as low as 8.52%. Subsequently, on Jan 28, 2013, while it is largely anticipated there would be no change, RBI surprised the market again by hiking its repo rate by 25bps to 8%, as it raised the concern of the high inflation. The index yield-to-maturity currently stood at 8.81%, as of Feb 14, 2014.

While the inflation is a sensitive issue, another key concern may arise from the general election to be held in May 2014. Regardless of the surprises, or the volatilities, the risk appetite for the Asian local currency bonds continues to be very solid, which implies the investors are happy with the risk premium they are receiving.

Note the Standard & Poor’s Ratings Services affirmed the ‘BBB-‘ long-term and ‘A-3’ short-term unsolicited sovereign credit ratings on India as of November 7, 2013.

The Yield-to-Maturity of S&P BSE India 10 Year Sovereign Bond Index

The posts on this blog are opinions, not advice. Please read our Disclaimers.