Get Indexology® Blog updates via email.

In This List

Commodities Crystal Ball: What do the FUTURES hold?

Active vs Passive Investing – Looking at 2013 Mid-Year Results

Who's Calculating Your Index?

Something you should know about dim sum bond market

Your Expectations Are Being Managed… by the Fed

Commodities Crystal Ball: What do the FUTURES hold?

Contributor Image
Jodie Gunzberg

Former Managing Director, Head of U.S. Equities

S&P Dow Jones Indices

What strategies will be the most profitable over the next 12 months?  Which spread will have the greatest opportunity? These are just a few questions we asked the audience at our S&P Dow Jones Indices 7th Annual Commodities Seminar, and we thought you may be interested in their answers.

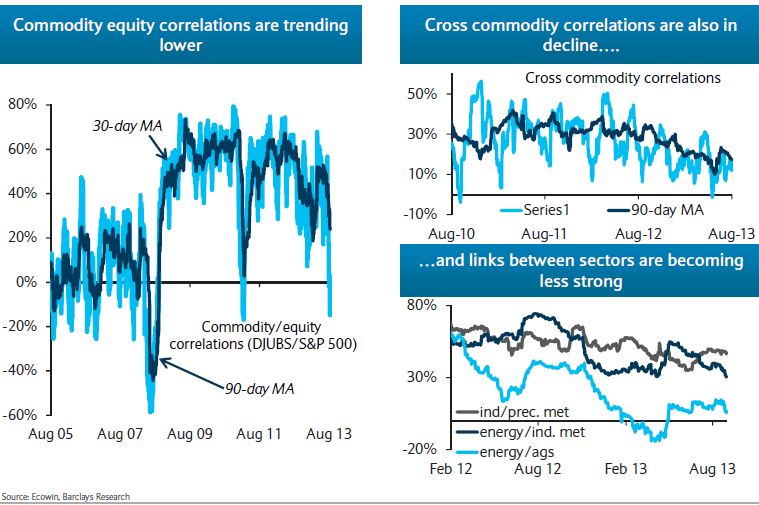
As I mentioned in a recent CNBC interview, the three main factors influencing commodities currently are quantitative easing, Chinese demand growth and geopolitical tensions.  This backdrop has been characterized by more frequent backwardation and lower correlations.

Commodity Correlations

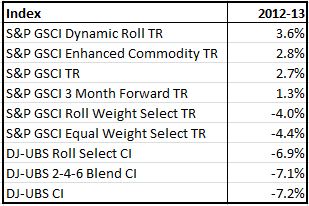
Given the more frequent backwardation in 2012 and 2013, the performance of more flexible strategies like the S&P GSCI Roll Weight Select and S&P GSCI Dynamic Roll have outperformed their static counterparts. See the table below:

Source: S&P Dow Jones Indices. Data from Dec 2011 to Aug 2013. Past performance is not an indication of future results. This chart reflects hypothetical historical performance. Please see the Performance Disclosure at the end of this document for more information regarding the inherent limitations associated with backtested performance

Also, below are two research papers on the fundamentals of why this is the case:

Research by Barclays shows investors are taking notice and assets are flowing into more active strategies.

AUM Barclays Commodities

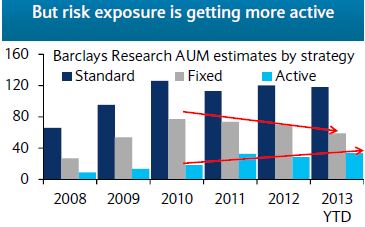
Will this continue? We asked our audience, Which index strategy do you believe will be most profitable over the next 12 months?”

Below are their answers, which match the trend of flows into active indexing but buck the trend that flows of  fixed are declining compared to standard. 

13.0%  Front month
26.1%  3-Month Forward
30.4%  Dynamic Roll
30.4%  Long-Short Trend Following

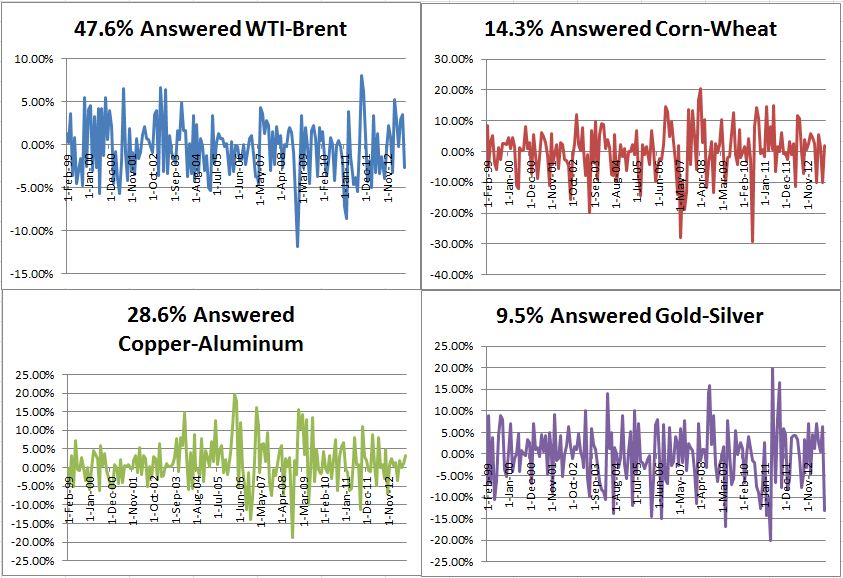
Another question we asked was regarding in which spread is the greatest opportunity?

See the answers from the audience in the charts below:

Source: S&P Dow Jones Indices. Data from Feb 1999 to Aug 2013. Past performance is not an indication of future results. This chart reflects hypothetical historical performance. Please see the Performance Disclosure at the end of this document for more information regarding the inherent limitations associated with backtested performance

What are your predictions? We’d love to hear!

The posts on this blog are opinions, not advice. Please read our Disclaimers.

Active vs Passive Investing – Looking at 2013 Mid-Year Results

Contributor Image
Aye Soe

Former Managing Director, Global Head of Core and Multi-Asset Product Management

S&P Dow Jones Indices

The past 12 months ending June 30 saw an impressive rally in the domestic equity markets with S&P 500, S&P MidCap 400 and S&P SmallCap 600 posting double digit gains.  During that period, the majority of active managers in all the categories except small cap growth underperformed their benchmarks.  The SPIVA 2013 mid-year report shows that over the past twelve months, 59.58% of large-cap funds, 68.88% of mid-cap funds and 64.27% of small-cap funds underperformed their respective benchmark indices. The figures are even more underwhelming when viewed over the three- and five- year horizons.  The majority of the active managers in all the domestic equity categories underperformed their respective benchmarks.

The report also highlights another investing myth.  Active investing is thought to be a better way to access less efficient markets such as small cap equity than passive investing.  However, as the SPIVA Scorecard shows, 77.88% of actively managed small cap funds underperform the S&P SmallCap 600 over the past five years.  If we go back further, say to the end of 2006, we can see that nothing much has changed.  Over the five year period ending December 31, 2006, 76.47% of small cap managers underperformed the benchmark.  This, of course, poses an interesting question of how much of the Efficient Market Hypothesis has been wrongly used to propel the myth of active investing for small cap equity.

indexology

The posts on this blog are opinions, not advice. Please read our Disclaimers.

Who's Calculating Your Index?

Contributor Image
Michael Mell

Global Head of Custom Indices

S&P Dow Jones Indices

Most investors assume that ETFs are passive investment tools tracking independently calculated indices, that premise has arguably been one of the key factors driving the popularity of ETFs.  In the past investors and advisors could be confident about their understanding of an ETF by reviewing the rules governing the underlying index.  To a large extent this made ETFs the diametric opposite of most mutual funds (which are actively managed) because with ETFs you knew what you were getting via the index.  Previously even self-indexed ETFs were required by the SEC to track independently calculated, rules based indices that publically disclosed their methodology and underlying constituents. This is no longer the case.

An entire crop of self-indexed “passive” ETFs are being launched where index transparency has been removed and instead only the holdings of the ETF need to be disclosed.  Arguably these types of ETFs are no longer a reliable alternative to mutual funds and other active investment products.  Alarmingly since these new “ETFs” are technically index based, they will probably enjoy a false association to ETFs that track independently calculated indices.

The philosophy behind passive index investing helped make the ETF into a trusted vehicle.  To maintain that trust it will be more important than ever for investors and their advisors to demand ETFs tracking independently calculated rules based indices.

Caveat emptor.

The posts on this blog are opinions, not advice. Please read our Disclaimers.

Something you should know about dim sum bond market

Contributor Image
Michele Leung

Former Director, Fixed Income Indices

S&P Dow Jones Indices

I am sure you have probably heard of, or even tried the Cantonese delicacies dim sum. While many people have a good knowledge of Barbecue Pork Bun or Siu Mai Dumplings, not many can tell exactly what is in the dim sum bond market.

Dim sum bonds are the debts that issued in the offshore renminbi (CNH) market.  This market was initially developed in 2009 to meet the investment demand from the growing CNH deposits in Hong Kong. Supported by a healthy supply and demand dynamic, it recorded a significant expansion since then. The global investors continue to be attracted to this particular market due to the anticipation of currency appreciation and the exposure to Chinese credits.

As tracked by the SP/DB Orbit Index, the total market value of the most liquid bonds and certificate of deposits (CD) with par amount above CNH 1 billion, is now over CNH 160 billion. The average yield of the index is 4.26% while the duration is 2.6. The index has delivered a total return of 5.28% since it incepted on Dec 31, 2010. If we take into the consideration of currency appreciation, the S&P/DB ORBIT (USD) Index rose 13.52%!

Similar to other markets, the offshore renminbi market is composed of sovereigns and quasi-sovereigns, as well as credits sectors. Under sovereigns and quasi-sovereigns, we have the bonds issued by Chinese government bonds, the four major policy banks in China, as well as the other global central bank, like Korean Development Bank. These bonds represented 39% weighting of the index.

There is also a very diversified issuers profile under the credits sector. For the Chinese properties, there are names like Yanlord and Gemdale. For Chinese corporates, we have some stated—owned corporates such as Shanghai Baosteel and Huaneng Power. There are also more foreign corporates, like Renault and Caterpillar entering into this market; in fact over 25% of the S&P/DB ORBIT index is composed of non-Hong Kong / China domiciled companies. Issuers continued to tap into the CNH market for a few reasons, firstly the offshore market offered a cost benefit compared with the onshore market, however it is no longer the case as the yields gradually converged, the offshore market is now trading around 50bp discount to onshore. Secondly, depending on the cross currency swap, some issuers may find it cheaper to issue in CNH than USD. Lastly, issuers may want to diversify its funding into CNH.

In terms of credit profile, 67% of the S&P/DB ORBIT Index is rated, and of which 55% of them are investment grade rated. While more issues are being rated nowadays, the overall creditworthiness of the market has also been enhanced.

On the other hand, liquidity has significantly improved as the regulatory continues its effort to internationalize the currency while the bond market matures. High yield names, particularly, have been very active this year, due to the high issuance and attractive yields. For example, a one-year paper of RENAULT, rated BB+, is trading about 4.30%. The average yield for high yield credits is around 7.75%, for duration of 2.3.

Perhaps one credit that got most attention recently is I.T. LTD, it is an apparel company found in Hong Kong and rapidly expanding its footprints in mainland China. Its major clienteles are the young Chinese generation with high purchasing power. It is not difficult to witness it when you walk into one of their shops in Shanghai, you can see one cardigan is easily priced in the range of USD 300-400 equivalents and it is bought without blinking an eye. Despite the strong consumer spending, the bond that the company issued at 6.25% in May plunged soon after it issued a profit warning, it is currently trading around 11%.

One thing to note, the S&P/DB ORBIT Index exhibited negative correlation to the U.S. treasury market while it also historically delivered a better risk-adjusted return, thus it provides investors an excellent way to diversify the fixed income portfolio, particularly in the current interest rate environment.

S&P/DB ORBIT Index: Performance

The posts on this blog are opinions, not advice. Please read our Disclaimers.

Your Expectations Are Being Managed… by the Fed

Contributor Image
David Blitzer

Former Managing Director and Chairman of the Index Committee

S&P Dow Jones Indices

Economists agree that what people expect the future to bring helps determine the economy’s future.  Expect prices to rise? Buy in advance.   Expect everyone to invest in that hot stock?  Go online and buy the stock now. Expect the Fed to keep interest rates so low money is almost free? Take some risks, buy that house or a new car, and buy stocks not bonds.

As central banks around the world sought new ways to stimulate economies in the face of zero interest rates, they (re)discovered the idea of convincing everyone that now is the time to spend because the good times are around the corner.  To make this sound like serious economic theory rather than hucksterism, it is called managing expectations.  It used to be called jaw boning. Moreover, the idea works.  Advertising QE1-2-3 or announcing that the Fed funds rate target would remain zero to 25 basis points until the unemployment rate dropped below 6.5% are key parts of this effort.  The expectation effects have contributed to the economy’s improvement.

One key to managing expectations is not to let anyone know their expectations are being managed.  Once they suspect that some of what they are hearing, and thinking, is there just to convince them, some people will try to out-think the management.  With increasing debate about whether QE3 was working, why it would work and what would come next, people began to wonder exactly what game was being played by whom.   The reaction to the Fed’s comments in May and June and Chairman Bernanke’s June press conference, looked like a reminder that one can fool some of the people some of the time, but not even the Fed can fool all the people all the time.  Once the expectation that interest rates might rise appeared, investors and home buyers tried to front run monetary policy.  This effort – selling bonds before yields climb and prices collapse—caused prices to drop and yields to rise.  The Fed’s response last week was an effort to create new, but temporary, expectations that rates won’t rise quite yet.   Temporary because sooner or later interest rates will rise.

If managing expectations becomes a permanent tool of monetary policy, trying to front run or out-fox expectations will continue.  Investors will listen to the Fed’s comments only to figure out what they Fed wants them to think and do. Then they will do what they think is in their best interests – often the reverse of what the Fed intended.  The result is a circular game of trying to out-guess one-another.

One suggestion for the Fed may be to return to some of its past practices and talk less.  There was a time when the Fed seemed to follow Theodore Roosevelt’s approach to speak softly and carry a big stick.

The posts on this blog are opinions, not advice. Please read our Disclaimers.