Get Indexology® Blog updates via email.

In This List

Passive Pensions

Are Dividends the Answer to Growth for Income Hunters?

What’s in a Name

Video: U.S. Market Wrap-up: Week of 7/8

25 and Counting for the Dow

Passive Pensions

Contributor Image
Craig Lazzara

Former Managing Director, Index Investment Strategy

S&P Dow Jones Indices

We read this morning that the California Public Employees’ Retirement System (CalPERS) is considering increasing its commitment to passive equity vehicles. This follows, by less than two weeks, a study suggesting that public pension funds generally could improve their performance by doing exactly what CalPERS is reported to be considering.

Of course whenever you speak about CalPERS, you’re speaking about enormous size (at $256 billion, the nation’s largest pension fund), and the fund’s size may be a key to its plans. For CalPERS to move its figurative needle, it needs to generate a huge amount of active investment return. As readers of our SPIVA reports know, most active managers underperform most of the time, so CalPERS may well conclude that the active management game isn’t worth the candle, especially at the scale required for their asset base. If that’s what they decide, it would be a hard conclusion to dispute.

The posts on this blog are opinions, not advice. Please read our Disclaimers.

Are Dividends the Answer to Growth for Income Hunters?

Contributor Image
Aye Soe

Former Managing Director, Global Head of Core and Multi-Asset Product Management

S&P Dow Jones Indices

Dividend focused strategies as well as strategies offering exposure to alternative income sources have become popular and proliferated over the past few years given the low interest rate environment.  Throughout history, dividends constitute an important part of total equity return. In decades such as the 40s and the 70s, dividends constitute 50% or more of the equity markets returns whereas during the 90s, dividends made up only 14% of the total return with capital appreciation making up the rest.  In addition, academic research has shown that dividends offer protection during bear markets.  It must be noted that, while dividends offer benefits, not all dividend strategies or dividend indices are constructed the same.  Some indices are designed with the specific purpose of absolute high yield, some focus on stable, consistent dividend growth and others encompass a bit of both.  Nearly all dividend indices employ quality measures to ensure their objectives are achieved.  During our webinar this Thursday on dividends, we will breakdown the methodology construction behind several leading dividend indices as well as highlight how different index mechanics can lead to different risk/return profiles and sector compositions.

The posts on this blog are opinions, not advice. Please read our Disclaimers.

What’s in a Name

Contributor Image
Alex Matturri

Former Chief Executive Officer

S&P Dow Jones Indices

Picking the right ETF among the hundreds that are currently available is certainly a formidable task for many investors – one that has been made more difficult by iShares recent announcement that it is removing index names from a number of its ETFs. Why should this raise concerns for investors and for the financial industry overall? Well, simply stated, it’s a transparency issue. As investors will no longer be able to determine the index that underlies an ETF just by looking at the ETF name, investor transparency has taken a few steps in the wrong direction.

As we have seen with the issues facing LIBOR and Reuters/WM, transparency of indices has become a paramount theme for investors. Knowing your exposures and where your potential returns are coming from are vital pieces of information that every investor should be aware of. As a recent Index Universe article pointed out, “the underlying index choice is the single biggest determinant of your returns”, and I couldn’t agree more. Given the growing number of indices available in the marketplace (S&P Dow Jones Indices, itself, calculates and publishes over 830,000 indices) – each with different weighting schemes, components, rebalancing schedules, and stated objectives – it’s absolutely critical that investors know what they are buying when they decide to invest in an ETF.

But what about the index provider? Finding the right index that underlies your ETF is one important step in the process, but knowing the index provider responsible for calculating and publishing the index underlying your fund is another. Does the index provider have a considerable track record in producing stock market indices, is it independent from the product, does it have a team that monitors the index 24/7, does it have a dedicated customer service department, are its benchmarks free of conflicts of interest, is it known for consistently and reliably producing indices, has it secured the necessary data licenses to ensure the ongoing calculation of the index, and does it utilize a transparent system comprised primarily of independently sourced pricing? With over 125 years of experience producing uncompromised indices and benchmarks, S&P Dow Jones Indices has worked tirelessly to ensure that our brand meets all of the above criteria while consistently and reliably serving as the seal of approval for markets both domestic and abroad.

Knowing the characteristics of the index underlying a fund, as well as the history, expertise and the integrity of the index provider are critical pieces of information that all investors should have upfront. In a time when financial market transparency is being called into question, it’s important that investors have at their fingertips the relevant information necessary to make an educated and informed investment decision.

The posts on this blog are opinions, not advice. Please read our Disclaimers.

Video: U.S. Market Wrap-up: Week of 7/8

Click here and watch Craig Lazzara, global head of index investment strategy at S&P Dow Jones Indices discuss last week’s market performance.

The posts on this blog are opinions, not advice. Please read our Disclaimers.

25 and Counting for the Dow

Contributor Image
Jamie Farmer

Former Chief Commercial Officer

S&P Dow Jones Indices

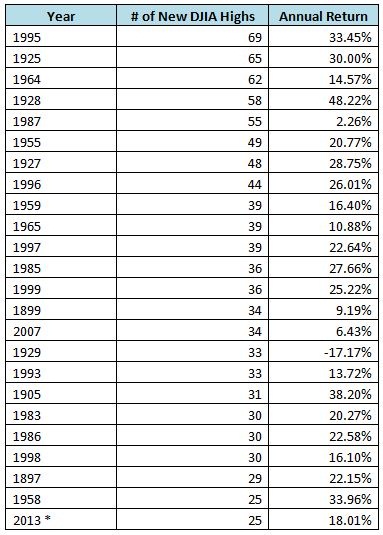
The number 25.  Christmas Day.  The atomic number of manganese.  The jersey number typically reserved for a baseball team’s best slugger.  And to date in 2013, the number of new highs hit by the Dow Jones Industrial Average.  Year to date through Friday (July 12) the Dow, ending the session at 15,464.30, has closed at a new high 25 times.  How does this compare to years past?  Well, it’s a pretty active pace – the DJIA is up over 18% on the year – but still a ways off the record.  In the 118 years since the DJIA’s inception, the most active year for new highs was 1995 when the DJIA hit a record close 69 times.  2007, in the lead up to the great recession, is on the list with 34 new highs.  With about 5 ½ months left to go – and with no apparent end to the Fed’s QE actions – 2013 currently ranks 24th on the list.  Keen observers of the list below will also note some other significant numbers: 1929 and 1987, years associated with historic equity market declines.

25 and Counting for the Dow

Source: S&P Dow Jones Indices. Data is through July 12, 2013.

The posts on this blog are opinions, not advice. Please read our Disclaimers.