Get Indexology® Blog updates via email.

In This List

Bank loan tracked by the S&P/LSTA U.S. Leveraged Loan Index is down 0.34% so far in June while high yield bonds are down 1.51%.

Shorter Duration Munis Hold Up While Longer Duration Munis Tumble

Senior Loans & High Yield Bonds

Looking Back When Interest Rates Rose

High Yield Bonds See Yields Continue to Rise

Bank loan tracked by the S&P/LSTA U.S. Leveraged Loan Index is down 0.34% so far in June while high yield bonds are down 1.51%.

Contributor Image
Kevin Horan

Former Director, Fixed Income Indices

S&P Dow Jones Indices

U.S. Treasury Bonds:
Treasury notes and bond as measured by the S&P/BGCantor US Treasury Bond Index started the year in negative territory, finally getting their head above water on a consistent basis around the beginning of April.  The positive returns did not last long as they slipped into negative territory on May 13th and have remained at a loss since the 17th.  The current year-to-date return of this index is -0.69%.


U.S. Corporate Bonds & Senior Loans:
Investment grade bonds as measured by the S&P U.S. Issued Investment Grade Corporate Bond Index have not performed any better than Treasuries.  The yield of the corporate index widened by 40 basis points since the beginning of the month to a current 2.87%.  The month-to-date return of this index currently stands at -0.75% while its year-to-date return turned negative on the 28th of May and is currently -1.41%.

The year-to-date return of the S&P U.S. Issued High Yield Corporate Bond Index has dwindled from its May 9th high of 5.43% to a current level of 2.25%.  Similarly, the S&P/LSTA U.S. Leveraged Loan 100 Index, which measures the performance of below investment grade loan facilities, has gone from a May 22nd year-to-date high of 3.32% to a 2.5%.  Senior loan’s lower return volatility to interest rate movements is apparent as high yield bonds have dropped 60 basis points from their highs, while senior loans have only given up 25 basis points. Up to this point, loans are outperforming high yield with a 2.5% year-to-date total return.


Source: S&P Dow Jones Indices LLC and/or its affiliates. Data as of Jun. 13, 2013. Past performance of the Index is not an indication of future results. Please refer to the methodology paper for the Index, available at www.spdji.com or www.spindices.com for more details about the index, including the manner in which it is rebalanced, the timing of such rebalancing, criteria for additions and deletions, as well as all index calculations. It is not possible to invest directly in an Index.

The posts on this blog are opinions, not advice. Please read our Disclaimers.

Shorter Duration Munis Hold Up While Longer Duration Munis Tumble

Contributor Image
J.R. Rieger

Former Head of Fixed Income Indices

S&P Dow Jones Indices

Duration is everything in a rising interest rate market.

Short term municipal bonds have fared better than their longer term counterparts as money moves out of bond funds.

The S&P Short Term AMT-Free Municipal Bond Index has seen its weighted average yield remain fairly steady and has recorded a modestly down June so far of -0.11%. 

One year municipal bonds tracked in the S&P AMT-Free Muni Series 2014 Index have seen a positive return of 0.02% with its yield dropping by 1bp month to date. 

Five year bonds tracked in the S&P AMT-Free Muni Series 2018 Index have seen yields rise by 17bps pushing prices down and recording a negative 0.7% return month to date.

Ten Year bonds tracked in the S&P AMT-Free Muni Series 2023 Index have returned a negative 1.81% as its yield has risen by 21bps.  The yield of these non-callable, investment grade bonds is 2.85%.  Using a tax rate of 35%, the Taxable Equivalent Yield of these investment grade municipal bonds has moved to 4.38%.

Longer municipal bonds, in the 20 year and longer range, are tracked in the S&P 20+ Year Municipal Bond Index.  That index is down 2.4% in June so far with yields rising by 45bps since May.

For June, Puerto Rico has moved the most of any state or territory down 2.43%.  The longer duration characteristics of bonds from Puerto Rico tracked in the S&P Municipal Bond Puerto Rico Index isn’t helping as interest rates rise.  

High yield municipal bonds are off 2.12% for June so far.  Helping to push down the high yield market is the long duration tobacco settlement bond sector, the S&P Municipal Bond Tobacco Index is down 4.32% month to date. (In comparison, the S&P U.S. Issued High Yield Corporate Bond Index is down 1.51% month to date)

The posts on this blog are opinions, not advice. Please read our Disclaimers.

Senior Loans & High Yield Bonds

Contributor Image
J.R. Rieger

Former Head of Fixed Income Indices

S&P Dow Jones Indices

Duration is everything in a rising interest rate environment.  Senior loans, as tracked by the S&P/LSTA U.S. Leveraged Loan 100 Index are down 0.34% month to date. These floating rate below investment grade loans have seen their weighted average yield rise by 19bps since May month end.  Meanwhile, fixed rate high yield bonds tracked in the S&P U.S. Issued High Yield Corporate Bond Index, which have a longer duration than floating rate debt, have seen a negative 1.51% return in June so far.  Bonds in that index have seen a rise in yields of about 61bps since May.

Learn more about the characteristics of the loan market and the indices that track it as we host a webinar entitled ‘The State of the Bank Loan Market’ on June 20th. 

Registration is easy: http://bit.ly/1abdjmc

The posts on this blog are opinions, not advice. Please read our Disclaimers.

Looking Back When Interest Rates Rose

Contributor Image
David Blitzer

Former Managing Director and Chairman of the Index Committee

S&P Dow Jones Indices

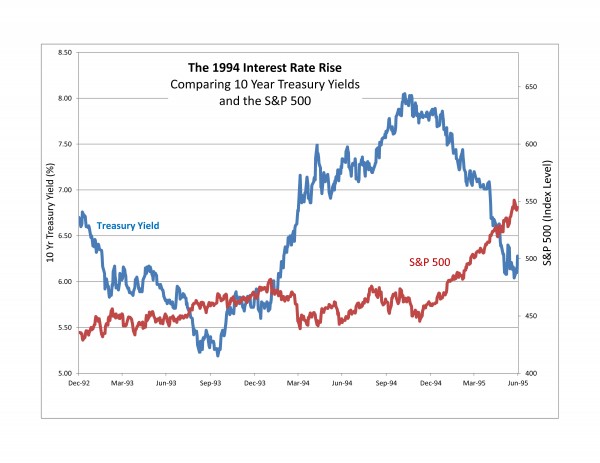
Source:  St. Louis Federal Reserve Bank and S&P Dow Jones Indices.  Daily data as of June 13, 2013 covering the period from December 31, 1992 to June 30, 1995.  Past Performance is not a guarantee of future results. It is not possible to invest directly in an index.
Source: St. Louis Federal Reserve Bank and S&P Dow Jones Indices. Daily data as of June 13, 2013 covering the period from December 31, 1992 to June 30, 1995. Past Performance is not a guarantee of future results. It is not possible to invest directly in an index.

With all the discussion about what might happen were interest rates to rise, it is worth looking at what has happened before. In 1994 the Fed tightened policy and interest rates rose faster and higher than investors expected.  The chart shows the yield on ten year treasury notes — the same instrument everyone is talking about today at a yield of about 2.2% — and the S&P 500.  As seen there, the market didn’t respond very much to the rise that began in late 1993 and early 1994; it did react when rates turned down late in 1994.  Of course there is no assurance that this time might be like the last time.


The posts on this blog are opinions, not advice. Please read our Disclaimers.

High Yield Bonds See Yields Continue to Rise

Contributor Image
J.R. Rieger

Former Head of Fixed Income Indices

S&P Dow Jones Indices

High yield corporate bonds as tracked by the S&P U.S. Issued High Yield Corporate Bond Index have seen yields rise about 56bps since month end May driving a negative total return of 1.38% so far for June 2013. High yield municipal bond yields have risen by 30bps in the same time period as the S&P Municipal Bond High Yield Index is down 1.76% so far in June.  Duration is playing a key role as municipals are down more than corporates due to their longer duration.  The duration of the S&P Municipal Bond High Yield Index is 7.58 vs a 4.98 duration of the S&P U.S. Issued High Yield Corporate Bond Index.  The longer the duration, the more the prices will move given a change in the yield.High Yield Muni & Corporate Bond Index Yields June 12, 2013

The posts on this blog are opinions, not advice. Please read our Disclaimers.