2017 was the sixth consecutive year of record U.S. corporate bond issuances, as companies continued to take advantage of the accommodative environment created by low interest rates and strong investor demand. As measured by the S&P 500® Bond Index, 325 companies came to market for a total of over USD 775 billion in 2017.
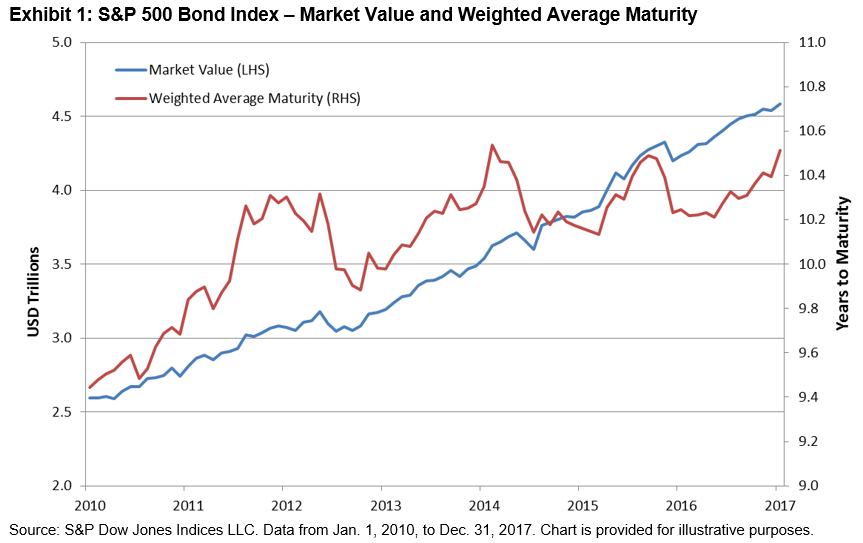
Approximately 65% of issuances were refinancings, with corporations looking to lock in lower interest rates and extend maturities. Of the nearly USD 800 billion of bonds to enter the index in 2017, 20% of issues were 30-year term deals, lifting the weighted average maturity of the index close to its 2015 peak (see Exhibit 1). The remaining USD 270 billion of net new issuance propelled the market value of the S&P 500 Bond Index to over USD 4.5 trillion by the end of 2017—an increase of 2.0 trillion since 2011 (see Exhibit 1).
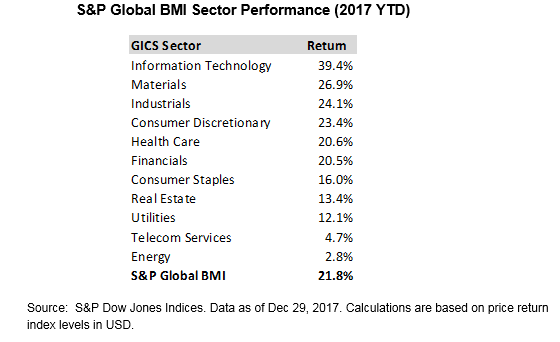
As expected, financial corporations were the top issuers in 2017; companies in the information technology and consumer discretionary sectors filled out the top three. Combined, companies from these three sectors accounted for more than 50% of all debt issuances to enter the index in the year. Issuers from all 11 GICS® sectors were represented (see Exhibit 2).

The 10 largest non-financial issuers accounted for over USD 180 billion of activity in 2017. Activity related to mergers and acquisitions was a predominant driver of bond issuance, as 6 of the top 10 issuers were involved in some form of M&A in 2017. Share buybacks and dividends were also a popular use of proceeds. Both Apple and Microsoft issued bonds to help fund their expanded share repurchase programs (see Exhibit 3).

For more information on the S&P 500 Bond Index, please visit https://spindices.com/indices/fixed-income/sp-500-bond-index.
The posts on this blog are opinions, not advice. Please read our Disclaimers.