This is the final post in our blog series that examines the domestic large-cap equity market performance, as represented by the S&P 500®, since the 2016 U.S. election.[1] We use the geographic revenue exposure of S&P 500 constituents to better understand whether or not Trump’s proposed U.S.-centric economic policies have had an impact on the equity market. In our last two posts, we looked at the performance of the Domestic Revenue and the Foreign Revenue Portfolios, as well as their macroeconomic risk exposures. This post investigates the sector-level performances of the Domestic and Foreign Revenue Portfolios.
The 11 sectors in the S&P 500 widely vary in their overall percent of total revenue obtained from the U.S. Sectors with relatively high revenue exposure to the U.S. (compared to the overall S&P 500 average) include financials, real estate, telecommunication services, and utilities, while information technology and materials tend to be more exposed to the global economy. Exhibit 1 shows the average percentage of revenue coming from the U.S. at the sector level and for the overall S&P 500 on Election Day.
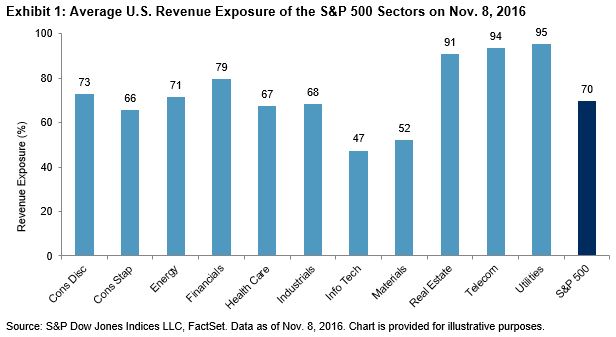
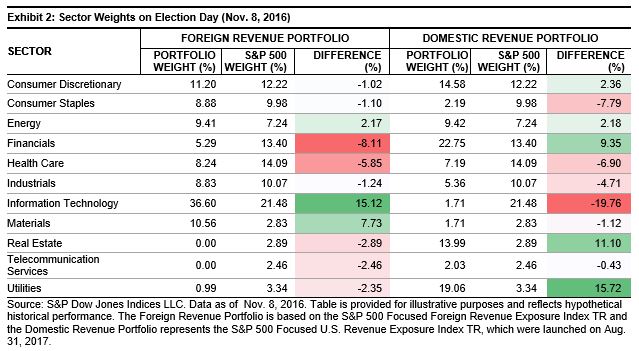
Given that the constituents of the aforementioned revenue portfolios are selected based on their percent of revenue exposure, one could infer that the sector tilts of each portfolio reflect the S&P 500 revenue exposure composition. Observing the sector weights of the Domestic Revenue and Foreign Revenue Portfolios compared to the S&P 500 on Election Day confirms this (see Exhibit 2). For example, Exhibit 1 shows that the average company in the information technology sector received 47% of its revenue from the U.S., which is substantially lower than the overall S&P 500 company average (70%). Unsurprisingly, there was a significant overweight to the information technology sector in the Foreign Revenue Portfolio (active weight of 15.12%), while the Domestic Revenue Portfolio showed minimal exposure (active weight of -19.76%).
So, are the performance differentials between the two portfolios that we presented in the first post a result of tilting the S&P 500 sectors? To determine if this is the case, a sector attribution analysis was run for the time period (Nov. 8, 2016–Oct. 31, 2017). Attribution analysis breaks out the performance differences between each portfolio and the S&P 500 into an allocation effect and a selection effect. The allocation effect shows the impact of the active sector bets in the portfolios, while the selection effect demonstrates the impact of security selection within each sector.
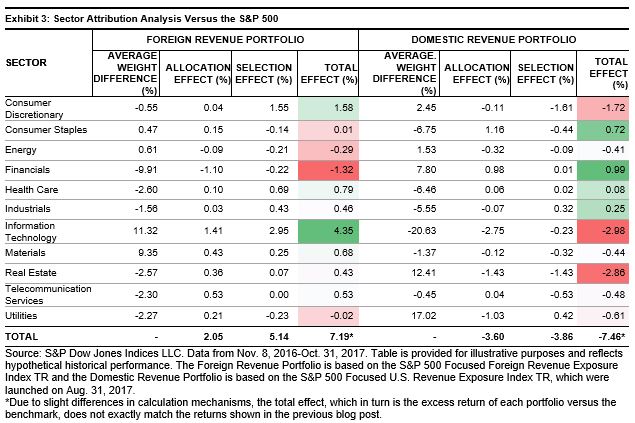
Several conclusions can be made from Exhibit 3. First, the Foreign Revenue Portfolio benefited from sector bets and stock selection; however the majority of the excess return versus the S&P 500 came from the selection effect. This illustrates that leveraging geographic revenue data to tilt sector weights and select individual securities contributed to the positive alpha of the portfolio. Secondly, the resulting underperformance of the Domestic Revenue Portfolio came from the attribution and selection effects in near equal proportion.
The analysis provided in this blog series demonstrates that allocating toward the sectors or industries that were expected to benefit from “Trumponomics” would not have been rewarding in relative performance terms. In fact, the opposite has been true. Perhaps due to the absence of implementation of any of the proposed policies, confidence in any of them becoming reality has deteriorated in the marketplace.[2] Instead of claiming the last 12 months to be the Trump Rally (self-proclaimed,[3][4] or otherwise), maybe it can be called the “Multinational Corporations Rally.”
[1] See first post here: https://www.indexologyblog.com/2017/11/08/the-trump-rally-one-year-later/
See second post here: https://www.indexologyblog.com/2017/11/13/the-trump-rally-a-macroeconomic-perspective/
[2] In the October 2017 World Economic Outlook report, The International Monetary Fund revised GDP Growth projections for the U.S. in 2017 and 2018 downward from their April 2017 report, specifically due to significant uncertainty of the proposed economic policies, such as tax cuts, actually taking effect: https://www.imf.org/en/Publications/WEO/Issues/2017/09/19/world-economic-outlook-october-2017
[3] https://twitter.com/realDonaldTrump/status/927847349648609280 and https://twitter.com/realDonaldTrump/status/927847471321141249
[4] https://twitter.com/realDonaldTrump/status/926789876556500992
The posts on this blog are opinions, not advice. Please read our Disclaimers.