Get Indexology® Blog updates via email.

In This List

The Lifetime Income Disclosure Act of 2017

Commodity Trends Boost Leveraged and Inverse Indices

The Little Cousin to TIPS

In Which Market Cycles Do Active Funds Add the Most Alpha?

How to Build a TIPS Ladder Portfolio for Millennials

The Lifetime Income Disclosure Act of 2017

Contributor Image
Peter Tsui

Former Director, Global Research & Design

S&P Dow Jones Indices

Earlier this month, both the Senate and the House introduced bipartisan legislation to amend the Employee Retirement Income Security Act that would mandate annual income disclosures on 401(k) and other defined contribution account documents.  The language in the legislation is identical to a bill introduced in 2009, early in the Obama administration.  This new effort reflects the ongoing concern that Americans are lagging significantly behind in their retirement savings.  At a minimum, the logic behind the proposed legislation is that estimates of plan participants’ future retirement income may motivate them to pay closer attention to savings rates and may encourage more aggressive deferrals to make up for savings shortfalls as evidenced by the income estimates.

However, despite the good intention, there are significant hurdles in coming up with an easy-to-understand and implementable methodology.  For the lifetime retirement income estimate to be useful, it has to be realistic, and that means quite a few assumptions have to be made, including the savings rate, investment returns, and stability in job tenure.  Besides, it is one thing to estimate the retirement income for a 65-year-old with close-to-retirement account balances, but it is something else to estimate the same thing for a 35-year-old, 30 years away from retirement.

For participants who are close to retirement, a standard, simple income calculation based on a participant’s current account balance using today’s rates in the immediate annuity market would be an easy and acceptable way to provide the income estimate.  For a younger participant with a much lower balance, using the same approach, without taking into account the anticipated future savings, would clearly result in a much lower income estimate and may or may not be helpful to the younger participant.  Thus, we may want to allow plan sponsors to provide different types of income estimates based on the participants’ proximity to retirement.

The posts on this blog are opinions, not advice. Please read our Disclaimers.

Commodity Trends Boost Leveraged and Inverse Indices

Contributor Image
Jodie Gunzberg

Former Managing Director, Head of U.S. Equities

S&P Dow Jones Indices

In the context of declining commodity prices following the global financial crisis, inverse indices became popular for market participants looking to profit from negative returns. As the oil war unfolded and drove commodity prices further down, market participants took a renewed interest in using inverse indices to bet against the market. When commodities rebounded last year, market participants remained opportunistic, demanding leveraged indices for the potential to earn extra in the comeback by doubling down. However, there have been some questions and observations about the performance of inverse and leveraged indices as their popularity has increased.

Why is the performance of the inverse indices not exactly opposite from the standard, long-only versions?  The inverse performance is exactly opposite the standard, long-only indices, but only for the stated period. For example, most of the inverse indices have a daily rebalance, which means the daily return of the inverse excess return index will be opposite from the standard excess return. However, when these returns are compounded, a performance difference arises that is beneficial in trending markets. Exhibit 1 shows a simple example of the performance impact of two daily consecutive positive moves and two daily consecutive negative moves. Note that there is an arbitrage opportunity for market participants if they pursue both strategies during trending times; when there are two consecutive negative moves, the inverse index gains more than the standard index loses, and if there are two consecutive positive moves, the standard index gains more than the inverse index loses. The magnitude of the consecutive losses and gains does not matter for this relationship to hold.What happens to the cumulative returns when the daily returns move in opposite directions?  In this case, the magnitude of the returns matters, but not the order. If a market participant were to pursue both strategies, it would likely be a losing proposition in a choppy market. The only way to profit is by picking whether the larger absolute return will be positive or negative and using the standard long index for the larger absolute positive return and the inverse index, which is like a short position, for the larger absolute negative return. If the magnitudes of the opposite consecutive returns are the same, the directional order makes no difference, as shown in the first column of Exhibit 2, and there is a certain loss for both the standard and inverse indices. However, there is a chance to win if opting for only one strategy with a correct bet on the bigger absolute return, regardless of order.What conclusions can be drawn for 2x leveraged indices when daily returns are compounded?  Similar results are observed when comparing the standard indices to the 2x leveraged indices, which double the daily return. The compounded returns when there are two days of consecutive losses or gains show that the 2x leveraged version has a better payoff profile, since it loses less than double the standard index return but gains more than double. If a market participant is sure about commodity trends over time, then the 2x leveraged index may be a winning bet, even if the direction is uncertain.

However, if the daily returns move in opposite directions, then the magnitude matters. For returns of the same magnitude moving in opposite directions, the 2x leveraged version magnifies the loss by more than a factor of two, as shown in Exhibit 3. Also, the gain in the 2x leveraged index is less than double when the magnitude of the positive return is larger than the magnitude of the negative return, while the loss is more than double when the magnitude of the negative return is bigger than the magnitude of the positive return. Again, unless a market participant picks the direction of the big move, the standard index may be the better choice in a choppy market.Are there some commodities that trend more than others, and might be advantageous in a 2x leveraged or inverse version?  The most popular commodities used in 2x leveraged and inverse indices for products are Brent crude, copper, corn, WTI crude oil, gold, natural gas, silver, and soybeans.

From Jan. 2, 2007, to March 24, 2017, each of these commodities trended nearly 50% of the time. Corn trended the most, exactly 50% of the time, while copper and silver trended the least, around 46% of the time. During trending days, silver and gold posted the highest percentage of consecutive positive returns, 55% and 53%, respectively, while natural gas posted the highest percentage of consecutive negative returns, spending 54% of its trending time with consecutive losses.

Most of the commodities had larger positive returns than negative returns on opposite consecutive days, with gold and soybeans each recording 54% of consecutive opposite direction days with a larger gain than loss. Corn, the most-trending commodity, showed 52% of its non-trending days with a bigger gain than loss. Copper, one of the least-trending commodities, had 51% of non-trending consecutive days with bigger losses than gains, as did natural gas.

Given that corn trended the most and had relatively large gains to losses on opposite days during the period studied, it may be the best overall commodity choice for 2x leveraged and inverse indices. Natural gas may be a strong choice for an inverse index, based on its high consecutive negative returns and high losses in opposite consecutive daily returns. Copper also had more losses on opposite days, which may be beneficial in its inverse version. Lastly, gold and silver may be good choices for the 2x leveraged indices, based on their high positive consecutive return rates, even though silver was more choppy than trending.

The posts on this blog are opinions, not advice. Please read our Disclaimers.

The Little Cousin to TIPS

Contributor Image
Peter Tsui

Former Director, Global Research & Design

S&P Dow Jones Indices

We explored the topic of building a 30-year TIPS portfolio in a previous blog.  If the numbers we threw around seemed too big (USD 5,000 or USD 10,000 per year over a long period of time) for a Millennial, don’t lose heart.  The U.S. Series I Savings Bonds (or I Bonds) provide an easy way to save for beginners.  Currently, any investor with a social security number can buy up to USD 10,000 per year in I Bonds, with minimum purchase of USD 25 per transaction.  This makes it much easier for a Millennial to put aside, say, USD 31.33 if he wants to save only that much.  Yes, you read that right, you can buy an I Bond to the penny, as long as it is over USD 25.00.

There are some basic differences between TIPS and I Bonds, but essentially both are financial instruments that allow one to hedge against inflation over time.  For a good illustration, please visit the TreasuryDirect website, https://www.treasurydirect.gov/.

Why bother with putting away such a small amount (in this example, USD 31.33)?  This gets at the heart of retirement readiness.  To be retirement ready, one needs to pay attention to three drivers: (1) contribution, (2) investment strategy, and (3) spending goals.  Savings are directly related to the first driver—contribution.  Whether or not retirement has been funded adequately, funding has to begin somewhere.  A thousand-mile journey begins with the first step, as does the wealth accumulation for one’s retirement income, by modest savings.  Once the amount saved has reached some critical mass, more finely calibrated investment strategy can be adopted to further grow the investment assets.  We will leave the last driver—spending goals—alone, for the time being.

I Bonds can be useful in this undertaking of funding for one’s eventual retirement many years down the road as a supplement other funding schemes.  They are meant to be long-term investments, and they continue to earn interest for up to 30 years.  Interest on an I Bond is a combination of two rates: (a) a fixed rate of return, which remains the same throughout the life of the I Bond, and (b) a variable inflation rate, which is calculated twice a year, based on changes in the nonseasonally adjusted Consumer Price Index for all Urban Consumers (CPI-U) for all items, including food and energy (CPI-U for March compared with the CPI-U for September of the same year, and then CPI-U for September compared with the CPI-U for March of the following year).

Currently, the fixed rate of return is close to zero, due to the historically low level of interest rates.  If you were to buy an I Bond now, in the month of April, the April 2017 I Bond issue would have a fixed rate of zero and a semiannual inflation rate of 1.38%, providing an annual composite rate of 2.76%, good for the six months from April to September.  For the six months between October 2017 and March 2018, the semiannual inflation rate would be based on the CPI-U for September 2016 compared with the CPI-U for March of 2017 (which was announced on April 14, 2017 to be 0.98%).  Thus the composite rate for the six months from October 2017 to March 2018 would be 1.96% [=0.0000 + (2 X 0.0098) + (0.0000 X 0.0098) = 0.0196].  So, here is the final tally: an investor who buys the USD 10,000 yearly limit in April 2017 would get a fixed rate of 0.0% and earn USD 138 in the first six months and then a bit more than USD 98 the next six months (due to compounding on the interest accrued), for a total of slightly more than USD 136.

The posts on this blog are opinions, not advice. Please read our Disclaimers.

In Which Market Cycles Do Active Funds Add the Most Alpha?

Contributor Image
Akash Jain

Director, Global Research & Design

S&P BSE Indices

Those who invest in active funds may expect portfolio managers to deliver excess returns over their benchmark indices for the fee they paid.  However, results from the SPIVA® (S&P Indices Versus Active) India Scorecard suggest this may not always be the case.  The scorecard, which is a biannual report, attempts to capture the performance of active funds (both equity and debt funds) domiciled in India against S&P BSE benchmarks over different time horizons.

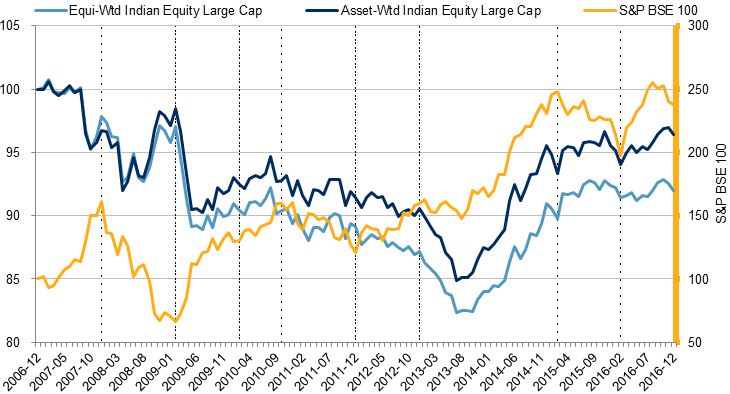
In our extended study of Indian Equity Large-Cap and Indian Equity Mid-/Small-Cap fund performance, we found that fund managers did not deliver persistent outperformance across market cycles.  We divided the ten-year period ending December 2016 into three market regimes, including bear (peak to trough), recovery (first 12 months after the trough), and bull phase (from recovery to the peak), based on the S&P BSE Sensex total return performance, and examined performance of the Indian Equity Large-Cap and Indian Equity Mid-/Small-Cap funds in different markets (see Exhibit 1).  We also compared asset-weighted and equal-weighted excess returns versus the benchmarks for these two categories, in order to understand how the larger funds (by assets under management) performed against their peers.

Exhibit 1: Illustrative Market Cycles
MARKET CYCLE PHASE PERIOD
Bear Market Periods December 2007-February 2009
December 2010-December 2011
February 2015-February 2016
Bull Market Periods December 2006-December 2007
February 2010-December 2010
December 2012-February 2015
Recovery Periods February 2009-February 2010
December 2011-December 2012
February 2016-December 2016

Source: S&P Dow Jones Indices LLC.  Data from December 2006 to December 2016.  Table is provided for illustrative purposes.

We observed that the fund returns in these two categories had relatively low beta across different market cycles, which may have been driven by allocation to cash or defensive/low beta stocks in their portfolios.  As a result, the active funds tended to outperform by a more significant margin in bear markets and by a relatively modest margin in bull markets.  This also indicates that the alpha generation by fund managers’ stock selection was more limited during bull markets, which may not be expected.

Exhibit 2: Beta and Active Fund Average Excess Return in Bull, Bear, and Recovery Markets
MARKET CYCLE INDIAN EQUITY LARGE-CAP INDIAN EQUITY MID-/SMALL-CAP
BETA
Bull 0.95 0.84
Bear 0.89 0.82
Recovery 0.89 0.79
EXCESS RETURNS VERSUS BENCHMARK (EQUAL-WEIGHTED, ANNUALIZED, %)
Bull 0.0 2.0
Bear 0.4 6.7
Recovery -3.0 -6.3
EXCESS RETURNS VERSUS BENCHMARK (ASSET-WEIGHTED, ANNUALIZED, %)
Bull -0.2 2.3
Bear 0.8 8.4
Recovery -1.6 -5.9

Source: S&P Dow Jones Indices LLC.  Benchmark for Indian Equity Large Cap is S&P BSE 100 and for Indian Equity Mid/Small Cap is S&P BSE MidCap.  Beta calculated using Asset-Weighted Fund Returns.  Data from December 2006, to December 2016 based on SPIVA India Year-End 2016 Scorecard.  Past performance is no guarantee of future results.  Table is provided for illustrative purposes.

Furthermore, active funds outperformed in trend-continuation markets and underperformed when the market regime changed, as active funds underperformed their benchmark indices by large margins and their return betas versus their benchmark remained low during recovery phases.  This implied that most fund managers may not have reduced their cash positions or tilted their portfolios to less defensive stocks when the market recovered from market downturns.

Indian Equity Large-Cap and Indian Equity Mid-/Small-Cap funds did not deliver persistent outperformance across different markets; they underperformed or had limited outperformance versus their benchmark for the 10-year period, as reported in our latest SPIVA India Scorecard.  It is also clear that larger funds in these two categories tended to perform better than smaller funds across different market cycles.

To discover more about the performance of Indian active funds versus their benchmarks, check out the SPIVA India Year-End 2016 Scorecard.

Exhibit 3: Outperformance of Indian Large-Cap Funds Versus the S&P BSE 100

Source: S&P Dow Jones Indices LLC.  Data from December 2006 to December 2016 based on SPIVA India Year-End 2016 Scorecard.  Past performance is no guarantee of future results.  Chart is provided for illustrative purposes.

Exhibit 4: Outperformance of Indian Mid-/Small-Cap Funds Versus the S&P BSE Midcap

Source: S&P Dow Jones Indices LLC.  Data from December 2006, to December 2016 based on SPIVA India Year-End 2016 Scorecard.  Past performance is no guarantee of future results.  Chart is provided for illustrative purposes and reflects hypothetical historical performance.  The S&P BSE Midcap was launched on April 15, 2015.

The posts on this blog are opinions, not advice. Please read our Disclaimers.

How to Build a TIPS Ladder Portfolio for Millennials

Contributor Image
Peter Tsui

Former Director, Global Research & Design

S&P Dow Jones Indices

In his January blog post entitled “Try a TIPS Mixer in Your Equities Cocktail,” Phillip Murphy described the potential benefits of including Treasury Inflation-Protected Securities (TIPS) in one’s portfolio.  In this blog aimed at Millennials, I would like to propose an easy way to build up a 30-year TIPS portfolio for retirement.

Let us assume that Alice, age 25, wants to create her own do-it-yourself TIPS portfolio to be one of her sources of retirement income when she turns 65, 40 years hence.  Without a lot of investment decision-making experience, what would be an affordable way for Alice to accomplish her goal?

To begin with, it may help for Alice to read “Risk Less and Prosper: Your Guide to Safer Investing,” by Zvi Bodie and Rachelle Taqqu, in which the authors argue for accumulating TIPS in one’s portfolio, because TIPS provide inflation protection and hedge against interest rate risk.  In addition, if the TIPS securities were held to maturity, as would be the case for a laddered portfolio, then there shouldn’t be any risk.

Currently, if Alice has a TreasuryDirect account, she can participate in non-competitive biddings throughout the year.  Some key facts about TIPS are as follows:

  1. TIPS are issued in terms of 5, 10, and 30 years;
  2. The interest rate on a TIPS is determined at auction,
  3. TIPS are sold in increments of USD 100, with the minimum purchase at USD 100;
  4. TIPS are issued in electronic form; and
  5. TIPS can be held until they mature or, if desired, they can be sold in the secondary market before they mature.

For more details, please visit the TreasuryDirect website at: https://www.treasurydirect.gov/indiv/research/indepth/tips/res_tips.htm.

As described by Wikipedia: “TreasuryDirect is a website run by the Bureau of the Fiscal Service under the United States Department of the Treasury that allows U.S. individual investors to purchase Treasury securities such as T-Bills, TIPS, and others directly from the U.S. government.  Its website allows money to be deposited from and withdrawn to personal bank accounts, and allows rolling repurchase of securities as the currently held items mature.”

Thus, for Alice, her TreasuryDirect account would be a cost-effective investment account to accumulate TIPS.  From age 25 to 34, at a relatively modest salary, Alice would buy the 10-year TIPS, at USD 5,000 a year.  From age 35 to 44, as her compensation grew, she would roll over the maturing 10-year TIPS into 30-year TIPS each year, and she would buy an additional USD 5,000 of the 30-year TIPS.  From age 45 to 54, she would buy USD 10,000 each year of the 30-year TIPS.  Finally, from age 55 to 64, she would buy USD 10,000 each year of the 30-year TIPS.  As she turns 65, she would have built up a 30-year laddered TIPS portfolio, with USD 10,000 of TIPS securities maturing in each of the next 30 years.  Since these TIPS securities have coupons and inflation-adjusted principal amounts, the nominal amounts would be much different from the face amount of USD 10,000; but in real terms, meaning on an inflation-adjusted basis, each maturing tranche of the laddered portfolio would provide the same purchasing power of a real USD 10,000.

For Alice, having a 30-year TIPS laddered portfolio of USD 10,000 real income each year would be a nice supplement to her other sources of income from Social Security benefits and defined-contribution retirement savings.  If, along the way to her retirement, she could afford to buy more TIPS, then her TIPS nest-egg could be correspondingly larger.

It may not seem like a big deal to have such a USD 10,000 30-year TIPS laddered portfolio available for retirement income when one is ready to retire.  However, bear in mind that the maximum social security benefits one may get (in current U.S. dollars) is around USD 2,800 per month, or USD 32,600 a year.  In this context, an income of USD 10,000 a year would increase one’s social security income by about one-third.

The posts on this blog are opinions, not advice. Please read our Disclaimers.